
USDCAD Technical Analysis 2015, 15.11 - 22.11: daily breakout, weekly ranging

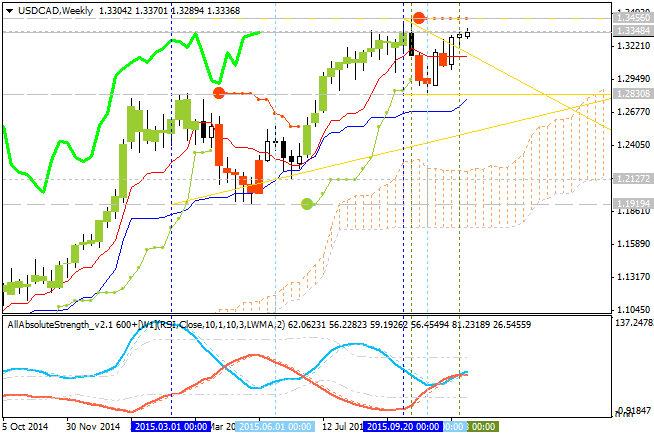
Daily price is on the primary bullish market condition located above Ichimoku cloud and 'reversal' Senkou Span lines within the following fundamental support/resistance levels:
- 1.3456 resistance level located far above Ichimoku cloud in the primary bullish area of the chart, and
- 1.2830 support level located far below Ichimoku cloud in the primary bearish area of the chart.
Bearish reversal support level for the pair is 1.3037 located near and below Ichimoku cloud; if the price breaks this level from above to below so the bearish reversal of the price movement will be started.
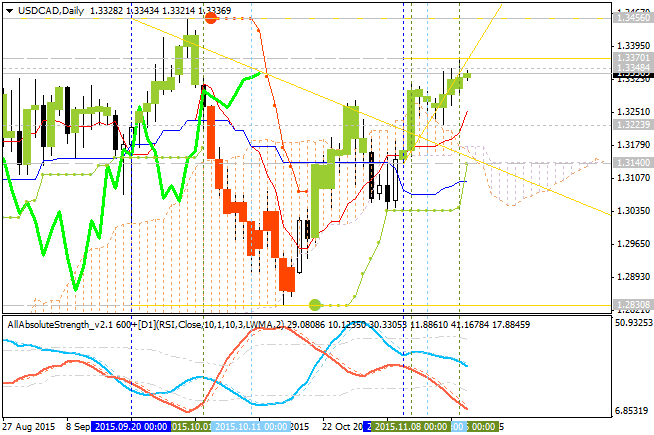
D1 price - bullish breakout:
- Tenkan-sen line is above Kijun-sen line for the bullish trend to be continuing.
- Absolute Strength indicator's data is estimating the secondary ranging.
- Chinkou Span line broke the price from below to above for the bullish breakout.
- 'Reversal' Senkou Span line (as the border between the primary bullish and the primary bearish on the chart) is located near and below the price which makes the bearish reversal to be likely in this year or in the beginning of 2016 for example.
- Nearest support levels are 1.3037 and 1.2830.
- Nearest resistance levels are 1.3370 and 1.3456.
If D1 price will break 1.3037
support level on close D1 bar so the reversal of the price movement to the primary bearish market condition will be started.
If D1 price will break 1.3370
resistance level on close D1 bar so the bullish breakout will be continuing with 1.3456 as the next nearest bullish target.
If D1 price will break 1.3456
resistance level on close D1 bar so the price will be in the primary bullish market condition without secondary ranging up to the new 'top' (new resistance level) to be forming on the way.
If not so the price will be on ranging within the levels.
- Recommendation for long: watch close D1 price to break 1.3456 for possible buy trade
- Recommendation
to go short: watch D1 price to break 1.3037 support level for possible sell trade
- Trading Summary: breakout
| Resistance | Support |
|---|---|
| 1.3370 | 1.3037 |
| 1.3456 | 1.2830 |
SUMMARY : bullish


")

")