

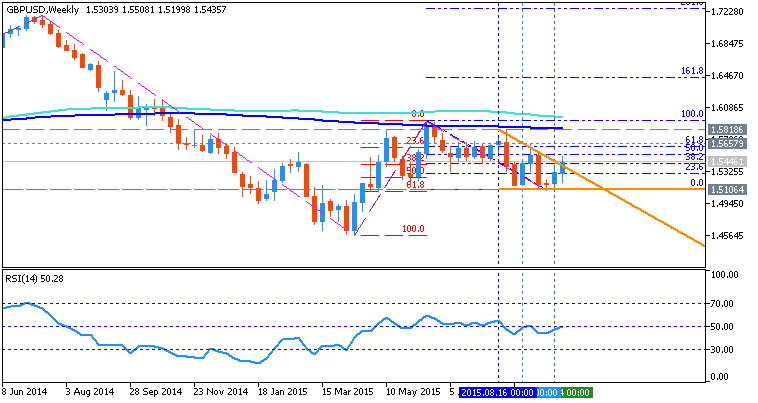
W1 price is on bearish ranging between the following key support/resistance levels:
- Fibo resistance level at 1.5930 located near 100 period SMA and 200 period SMA on the border between the primary bearish and the primary bullish area of the chart;
- Fibo support level at 1.5106 located far below 100-SMA/200-SMA in the primary bearish area of the chart.
RSI indicator is estimating the ranging market condition to be continuing. "It’s all about the line that extends off of the 2009 and 2011 highs. The
long term picture in GBP/USD is bearish due to the behavior at this
line and its associated parallels. The rate is at resistance now from
the line that extends off of the 2014 and 2015 highs. A push above
probably delays anything significantly bearish until near 1.60."
If the price will break Fibo support level at 1.5106 so the bearish market condition will be continuing.
If the price will break Fibo resistance level at 1.5930 so the bullish reversal of the price movement will be started.
If not so the price will be ranging between the levels.
Trend:
- W1 - ranging bearish


")
 & AMD Framework")