
NZD/USD Price Action Analysis - ranging near Fibo support level for direction
13 August 2015, 15:11

0
946
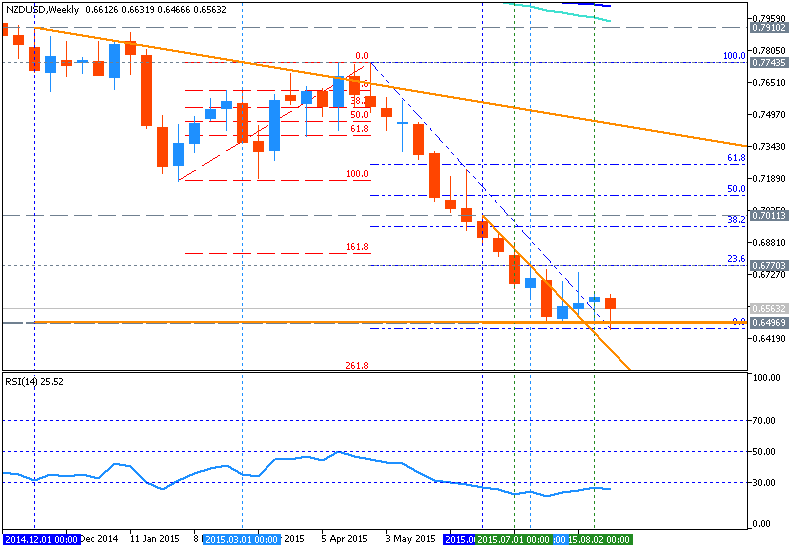
W1 price is located below 200-SMA
and 100-SMA for the primary bearish with secondary ranging between 23.6% Fibo resistance level at 0.6769 and Fibo support level at 0.6466:
- The price is ranging between ranging between 0.6769 and 0.6466 levels.
- Descending triangle pattern is going to be broken by price with 0.6496 support.
- If the price breaks Fibo support level at 0.6466 on close weekly bar so the bearish trend will be continuing, otherwise - ranging.
- "A move under .6500 is needed to set up a test of a key long-term retracement around .6400."
- "A daily close above the .6735 would turn us positive on the bird."
If the price will break Fibo support level at 0.6466 on close weekly bar so the bearish trend will be continuing with good possible breakdown of the price movement.
If not so the price will be ranging between the levels.
Trend:


 Trading Guide")

