
GBPUSD Next Month Outlook - trying to reverse to the bullish

MN price is located just on Senkou Span A line which is the virtual border between the primary bullish and primary
bearish on the chart. The price broke Ichimoku cloud and trying to break trendline together with Senkou Span A line to come to the bullish area of the chart for the total reversal of the price movement from ranging bearish to the primary bullish market condition. If the price will break 1.6021 resistance level on close monthly bar so we may see the reversal of the price to the bullish, otherwise the price will be continuing with ranging between 1.6021 resistance and 1.4565 support levels.
- The
price is crossing the last border of Ichimoku cloud - Senkou Span A line which is the virtual border between the primary bullish and the
primary
bearish on the chart.
- Tenkan-sen line is below Kijun-sen line of Ichimoku indicator which is indicating the primary bearish market condition to be continuing in the future.
- Chinkou Span line broke the price from above to below for good possible breakout with reversal to the bullish trend.
- The data of Absolute Strength indicator is estimating the breakout to be continuing.
- Nearest support levels are 1.4565 (MN1).
- Nearest key resistance level is 1.6021 (MN1)
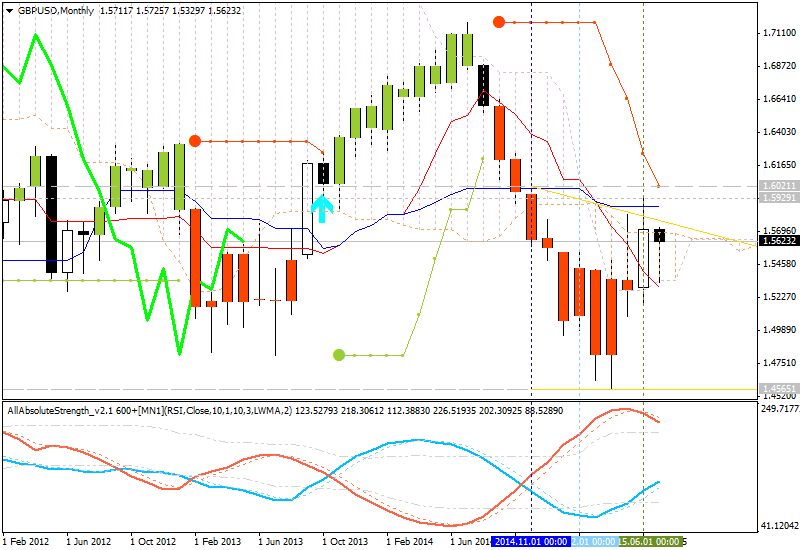
If MN1 price will break 1.4565
support level so the primary bearish will be continuing.
If MN1 price will break 1.6021 resistance level so we may see the reversal to the primary bullish
condition.
If not so the price will be ranging between 1.6021 and 1.4565 levels with primary bearish.
- Recommendation for long: watch close price to break 1.6021 for possible buy trade
- Recommendation
to go short: watch price to break 1.4565 support level for possible sell trade
- Trading Summary: ranging
| Resistance | Support |
|---|---|
| 1.6021 (MN1) | 1.4565 (MN1) |
| 1.5929 (MN1) | N/A |
Trend:


")
