
The Scalpers Checklist - support and resistance levels are critical areas for scalpers to identify

One of the most important concepts a scalper needs to master is how to find levels of support and resistance. These levels will act as price ceilings and floors which will ultimately help us determine our scalping strategy.
While there are many ways to identify support and resistance, today we are going to take a look at three of the most common methods that can be applied in our day trading.
Price Action
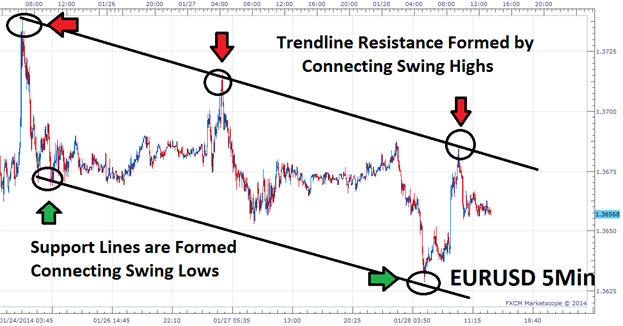
The first way of finding support and resistance is by using price action. Scalpers should become comfortable with finding swing highs and swing lows on their charts as they are natural areas of support and resistance. A swing high is identified as a peak on the graph and a swing low can be pinpointed as a valley.
Pivot Points
Pivot points also make great areas of support and resistance. These lines are drawn using a preset formula and are often favored by scalpers because they can be added to virtually any chart. Above is a great example of support in action on a EURGBP 30 minute chart using Camarilla Pivot Points. Once added, you can clearly see levels of support denoted by an “S” whereas lines of resistance are marked by an “R”. It should be noted that there are a variety of pivot points to choose from. Regardless of the pivots you use, their key purpose is to find these support and resistance levels for you.
Moving Averages
Last we will take a look at using simple moving averages as a level of support and resistance. Most traders may be familiar with this average on longer period graphs, but is just as effective on shorter time frames such as the 30 minute and 5 minute charts. If price is above the average, traders can wait for dips and look to buy a currency pair. Conversely if price breaks below this value, the 200 moving average will change from an area of support to new resistance. Traders can then look for selling opportunities as long as price remains under the indicator.


