
Learn how to design a trading system by Bollinger Bands
Introduction
In the world of trading, there are many tools and methods that we can use in our favor to achieve out trading goals. These tools can be used according to market condition or according to market status.
One of such methods is trading bands. The main concept of trading bands is to trade between two bands buying and selling to benefit from the determined bands. One of these tools is the Bollinger Bands indicator. This indicator is one of the most popular or one of the most commonly used one in the world of technical analysis and trading.
In this article, I will share with you information about this Bollinger Bands indicator to enhance our understanding about what it is, how we calculate it, and how we can use it in our favor. After that you will be able to use it in your favorite way according to your strategy. Next, I will share with you how we can design a trading system by using this Bollinger Bands indicator in an accurate and easy way. Thus, we will cover the following topics:
- Bollinger Bands Definition
- Bollinger Bands Strategies
- Bollinger Bands Strategies System Designing
- Conclusion
- References
As we will learn about Bollinger Band, it measures the dispersion of data around its mean. This indicator was created by John Bollinger. It is constructed by two bands surrounding with 20 days moving average to measure the dispersion of data (prices) around its mean (20 days moving average).
It may seem that Bollinger Bands indicator is the same like Envelopes indicator as it also has two bands surrounding the prices. But this is not true because the difference between Bollinger Bands and Envelopes is that the Bollinger Bands indicator is not placed at a fixed percentage beyond the moving average but its calculation allows that Bollinger Bands indicator expands or contracts according to the standard deviation of the moving average. We will learn this and other details in the Bollinger Bands Definition section or topic.
We will also learn how we can use Bollinger Bands through some strategies of Bollinger Bands in a way to be expressive and beneficial for our trading and this is for sure will be in the Bollinger Bands Strategies section.
Then we will move to the most interesting part of this article: how to use these strategies in an algorithmic trading system in an accurate and reliable manner and this is what we will learn at Bollinger Bands Strategies Blueprint and Bollinger Bands Strategies System Designing sections.- All codes through this article will be written by MQL5 and execution will on MetaTrader 5.
- I advice you to write and execute codes by yourself if you want to practice and enhance your learning.
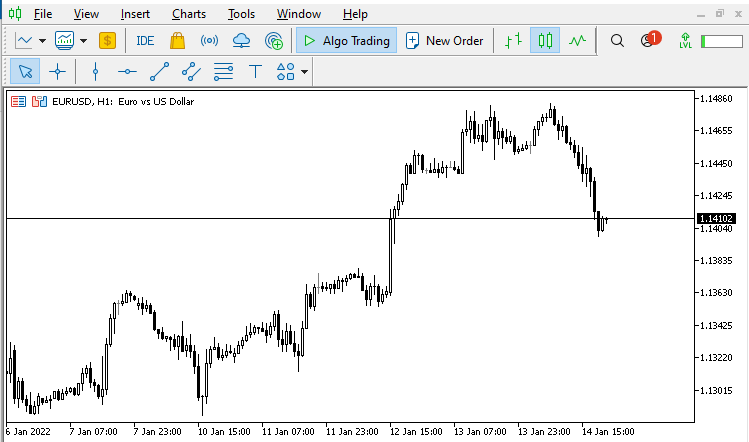
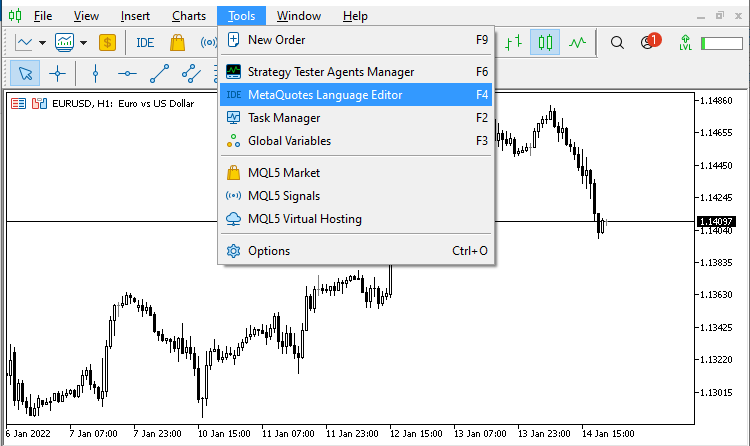
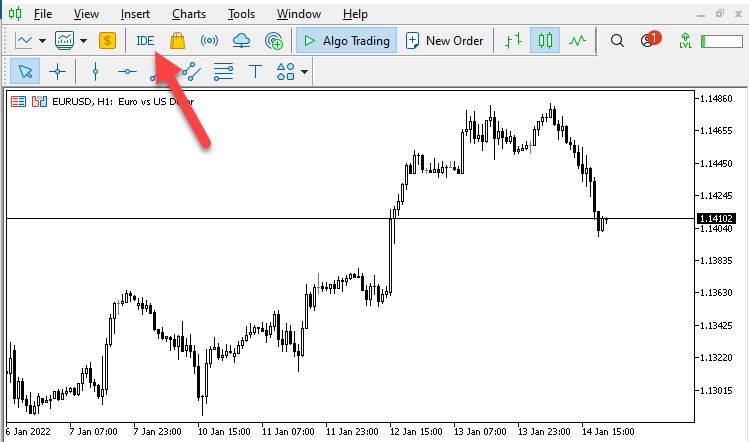
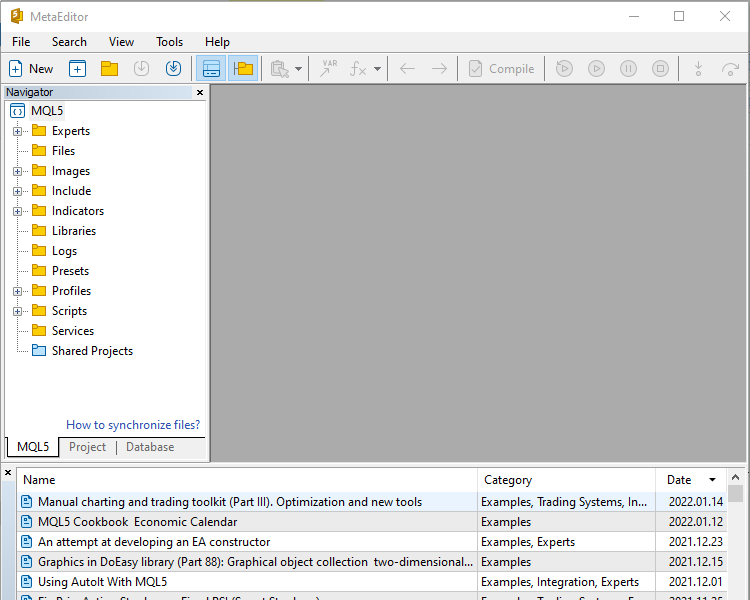
- So, you will need MetaTrader 5 terminal to execute codes and MetaEditor of MQL5 to write codes and the following pictures are for them.
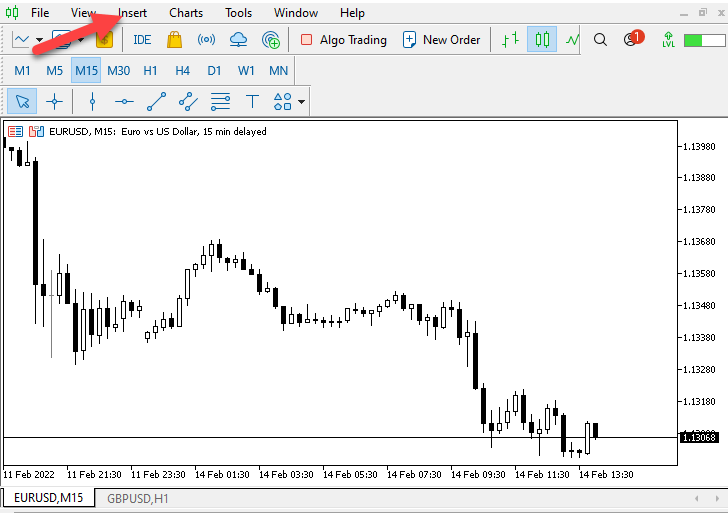
After downloading and installing the MetaTrader 5 on your device and you can download it from the following link: https://www.metatrader5.com/en/download. After that you will find the MetaTrader 5 window will be the same like the following picture:
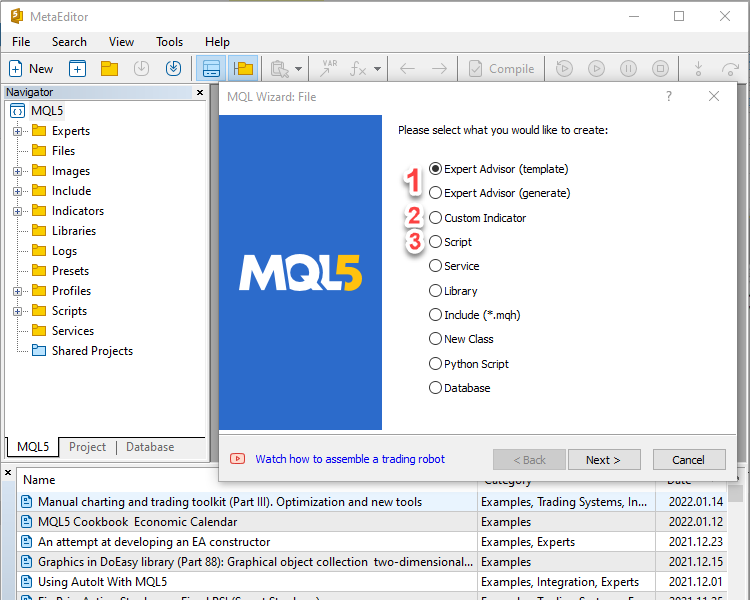
- Open a new file to write an Expert Advisor
- Open a new file to write a custom indicator
- Open a new file to write a script
For more info, you can read my previous article through the following link: https://www.mql5.com/en/articles/10293
As I like to mention always in different events, programming or coding is an amazing tool which allows us to make our life easy and smooth with accurate actions which are done automatically. So, it is an important objective to put an investment at this kind of field to learn how to use it in a proper way to generate desired goals in different areas of life.
When it comes to trading, I need to imagine how life can be easy and enjoyable when you give your instructions to the computer to do what you want to do and at the time you want then the computer do what you want exactly without any objections and you can do anything else in your life. It is an amazing lifestyle, so, it will be an important objective to give this coding or programming your interest in your suitable way even if you will code by yourself or let someone else to do it for you.
Disclaimer
All content of this article is made for the purpose of education only not for anything else. So, you will be responsible for any action you take based on the content of this article, as the content of this article does not guarantee any kind of results.
So, let's go through our article sections to learn more about this interesting topic and the indicator.
Bollinger Bands Definition
The history of the idea of trading bands is long and interesting and is utilized by many methods. Trading bands is mainly based on constructing bands above and below some measure of tendency.
For example, we can use moving averages shifted up and down by a percentage of itself or Envelopes. Also, there are channels which are two parallel lines above and below prices to detect turning points. But all these methods are fixed and do not react according to price movements. In other words, they do not expand or contract with the price movements.
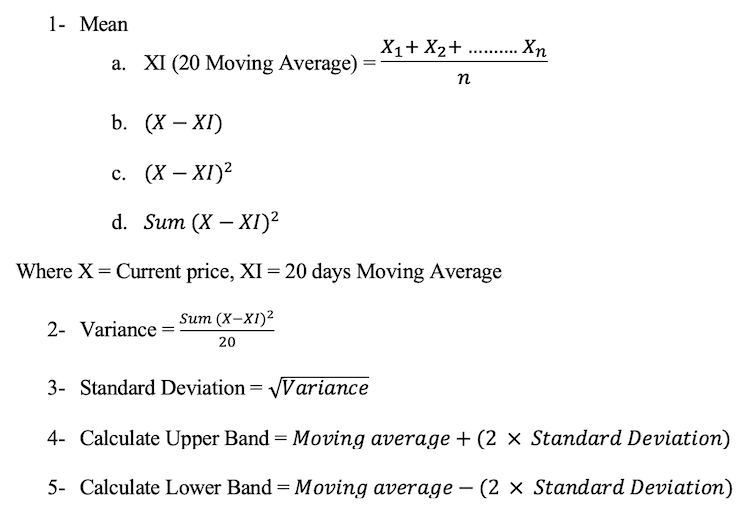
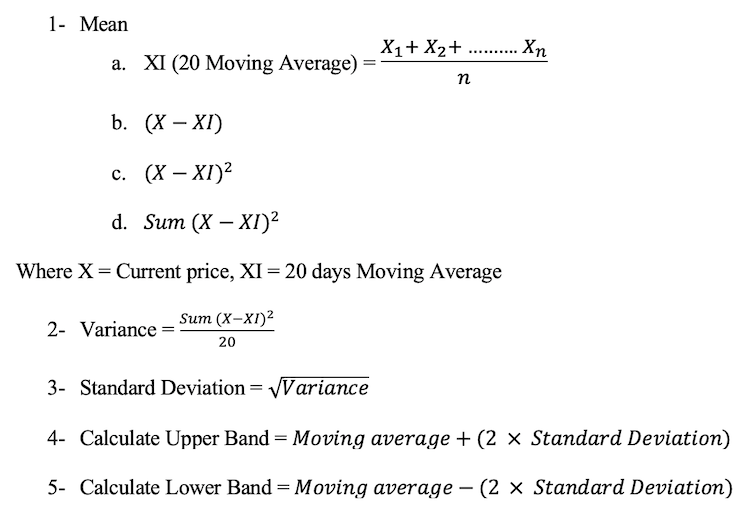
Bollinger Bands can do that because of its specific calculation. We will see the details of the indicator calculation in this part.
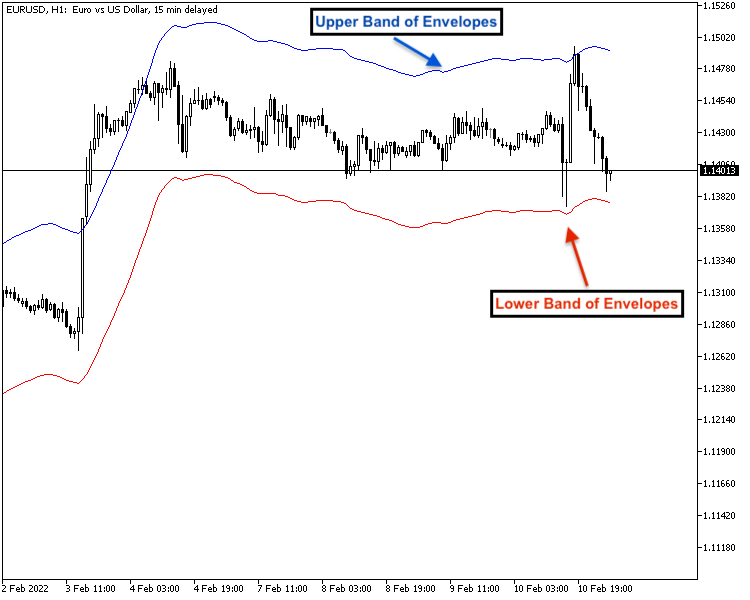
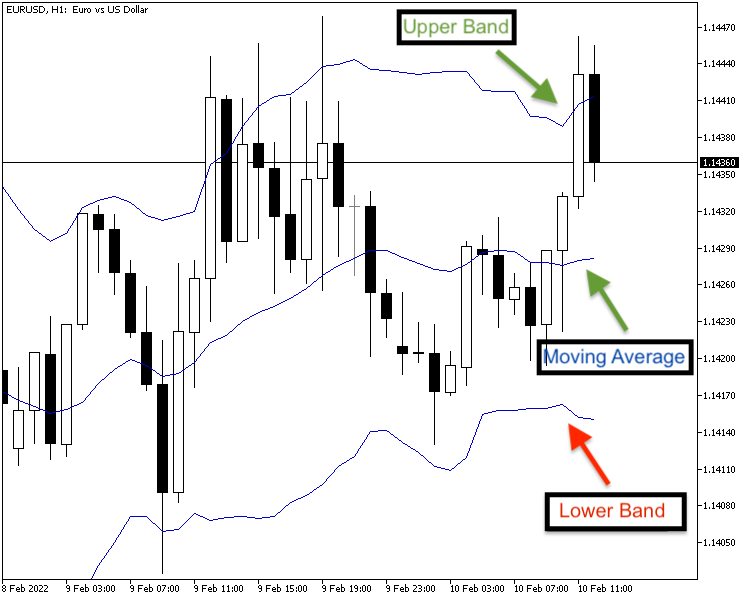
As you can see in the previous picture, we have two bands that surround the prices: the lower band surrounds the prices from the below and upper the band surrounds them from the above. So, the main idea here that we need to know is that there are a lot of methods which are based on trading bands from the history and the most common were percentage bands.
There are also many developments on the trading bands idea. One of these developments is the Bollinger Bands indicator which is used to trade bands. It differs from the previously mentioned methods in that it can be expanded and contracted as its calculation allows it to do that.
The Bollinger Bands indicator is created by John Bollinger in the early 1980s, he is one of the popular experts in the field of financial market and trading. He is a CFA ( Chartered Financial Analyst) and a CMT ( Chartered Market Technician).
The Bollinger Bands indicator is a popular technical indicators, it measures the volatility and can be expanded and contracted according to the market condition. It can be used in all financial markets like stocks, forex...etc. Now, let’s talk about the construction of Bollinger Bands:Like what we mention before the concept of trading bands is to start with some measure of central tendency. Then we construct bands above and below this measure. For the Bollinger Bands indicator, the measure of central tendency is the simple moving average and the interval is determined by a measure of volatility of a moving standard deviation.
The Bollinger bands indicator:
- It measures dispersion of data around its mean (Moving Average).
- It a volatility indicator.
- The difference between Bollinger bands and Envelopes or any percentage trading bands method is that they have specific percentages of moving average above and below moving average but Bollinger Bands is a standard deviation of Moving average.
- The bands automatically widen when volatility increases and contract when volatility decreases. Their dynamic nature allows them to be used on different securities with the standard settings.
- Bollinger Bands are a trading tool used to determine entry and exit points for a trade.
- The bands are often used to determine overbought and oversold conditions.
- It can be used to identify M-Tops and W-Bottoms or to determine the strength of the trend.
| Day number | Closing Price $ |
|---|---|
| 1 | 20 |
| 2 | 30 |
| 3 | 35 |
| 4 | 30 |
| 5 | 40 |
| 6 | 45 |
| 7 | 50 |
| 8 | 55 |
| 9 | 40 |
| 10 | 45 |
| 11 | 50 |
| 12 | 35 |
| 13 | 40 |
| 14 | 50 |
| 15 | 60 |
| 16 | 65 |
| 17 | 70 |
| 18 | 60 |
| 19 | 70 |
| 20 | 75 |
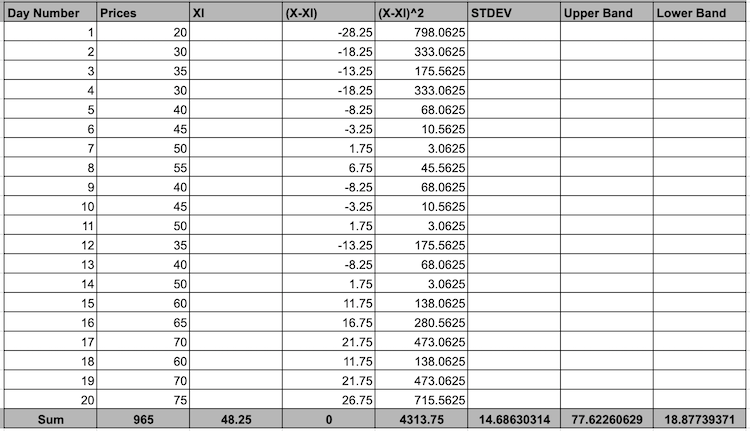
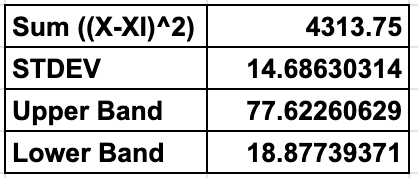
Adjusting the Settings:
Now If some asked about if we can adjust settings of Bollinger Bands in any other way to be adopted with our strategy or trading plan, the answer is yes we can do that especially if these adjustments tested and gave us a good results. And also we have to know that Bollinger recommends to make a small adjustments for the standard deviation multiplier. Also what we have to know that changing the period of the moving average affects the period used to calculate the standard deviation. Bollinger also suggests to increase the multiplier of standard deviation to 2.1 if we will use a 50 period simple moving average and decrease it to 1.9 if we will use a 10 period simple moving average.
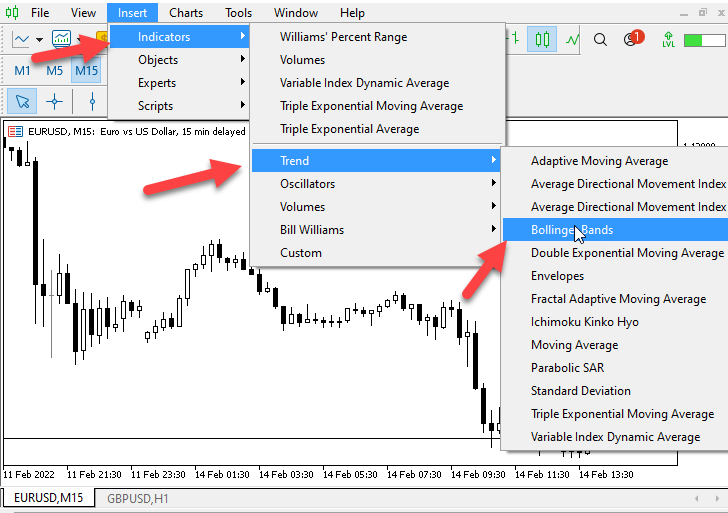
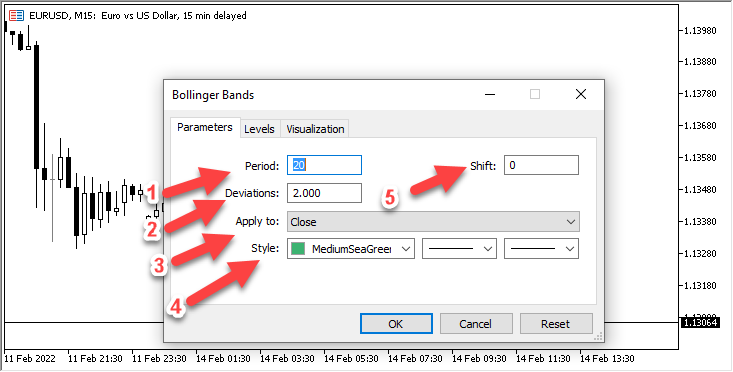
1. Period to select the period of Moving average.
2. Deviations to select deviation parameter of upper and lower bands.
3. Apply to: to select the kind of prices that parameters which will be applied (Close, Open, High, Low, Median Price, Typical Price, and Weighted Close).
4. Style: to select the style of indicator (Color, shape and width of lines of indicator.
5. Shift: to set a value to apply a shift for indicator.
And like what I mention before we can adjust these settings according to the trader inputs and his strategy.
Now, we have the Bollinger Bands indicator drawing on the price chart, and it will be shown the same like the following picture:
Bollinger Bands Strategies
At this we will talk about Bollinger Bands strategies and we will know how to use it in a beneficial way.
We can use Bollinger Bands with different market condition or different market movements, we can use during uptrend, downtrend, and sideways. And with every market condition, there are many strategies that we can use but here we will mention some of them.
- During Uptrend
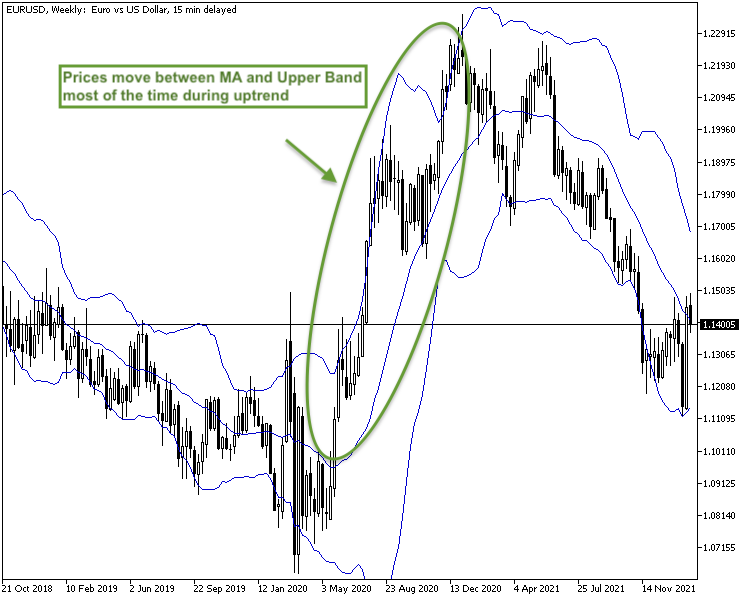
First, we need to understand how prices will move during uptrend with Moving Average, as we can find that prices move most of the time during the uptrend above its mean (Moving Average).
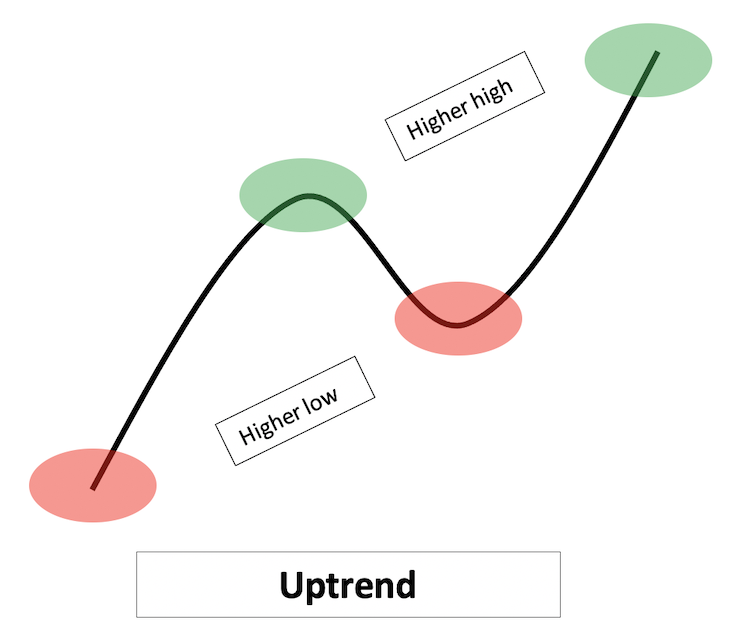
So, we will find that during the uptrend prices move between Moving Average and Upper Band most of the time. It means that prices make higher lows and higher highs as there is control from buyers.
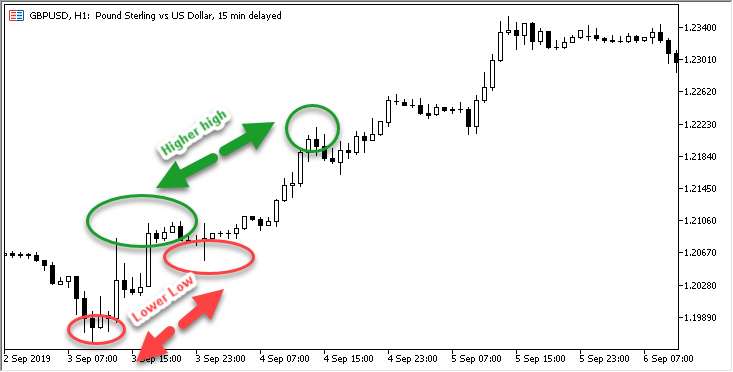
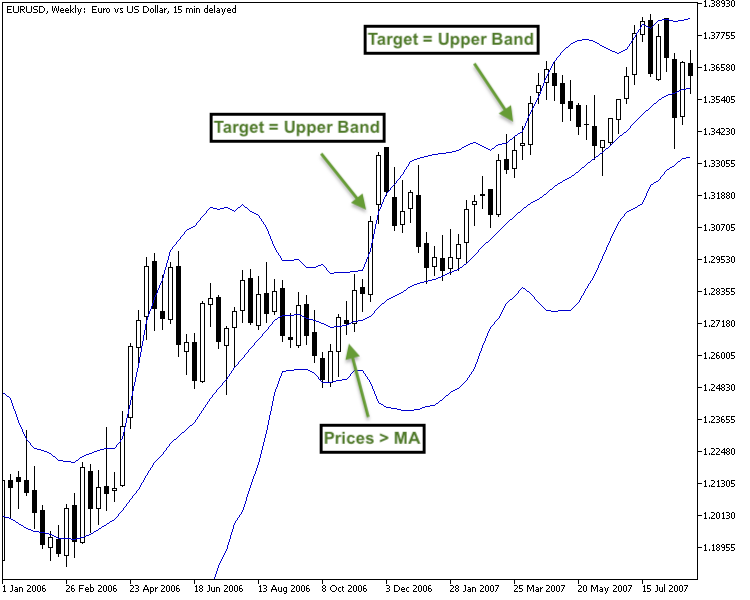
- Buy when prices crossover above Moving Average and the target will be the Upper Band.
- Prices > MA = Buy, Upper Band = Target
- During Downtrend
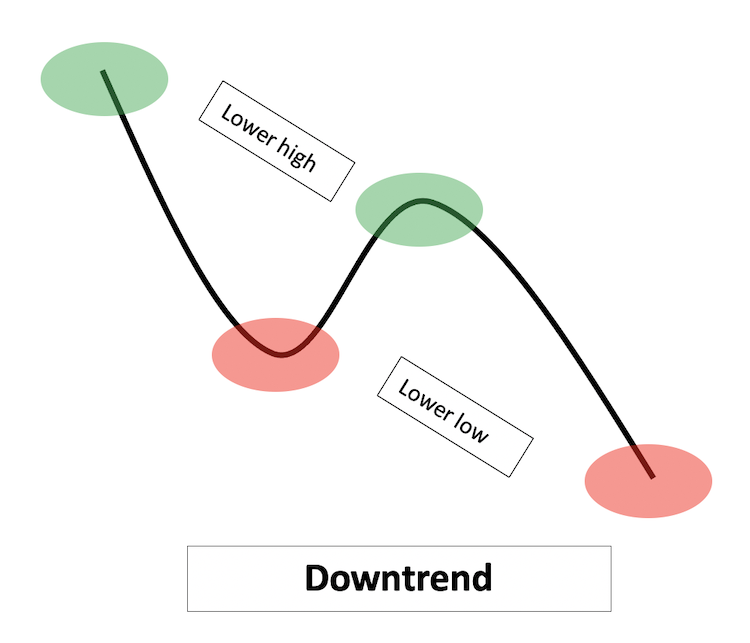
First, we need to understand how prices will move during downtrend with Moving Average, as we can find that prices move most of the time during the downtrend below its mean (Moving Average).
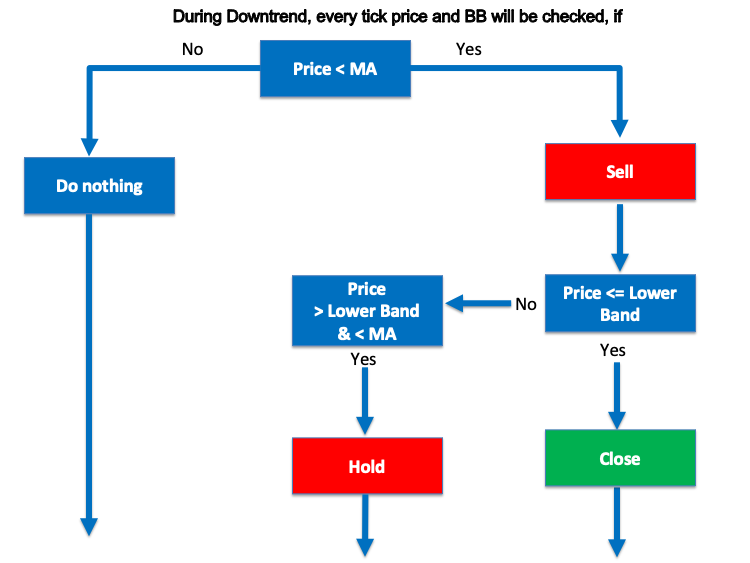
So, we will find that during the downtrend prices move between Moving Average and Lower Band most of the time. It means that prices make lower highs and lower lows as Sellers control the market and prices move down.
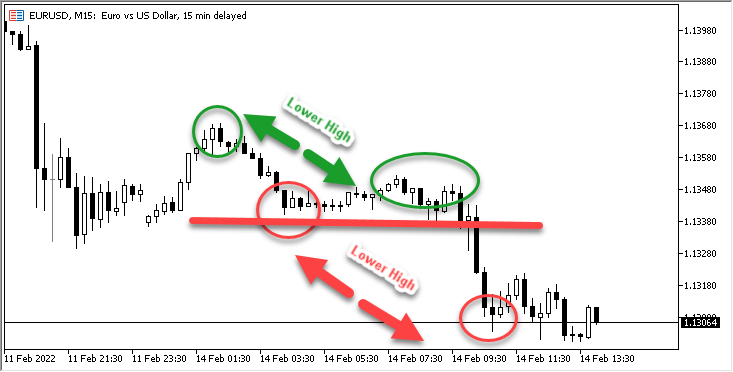
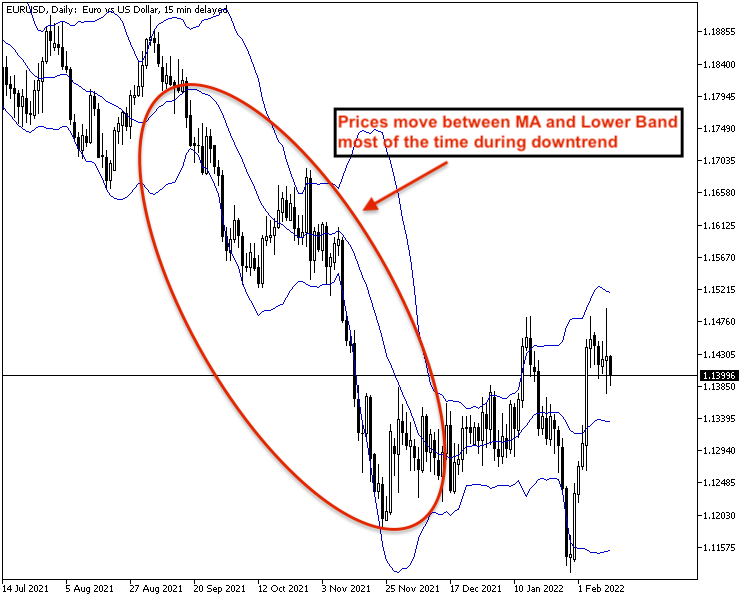
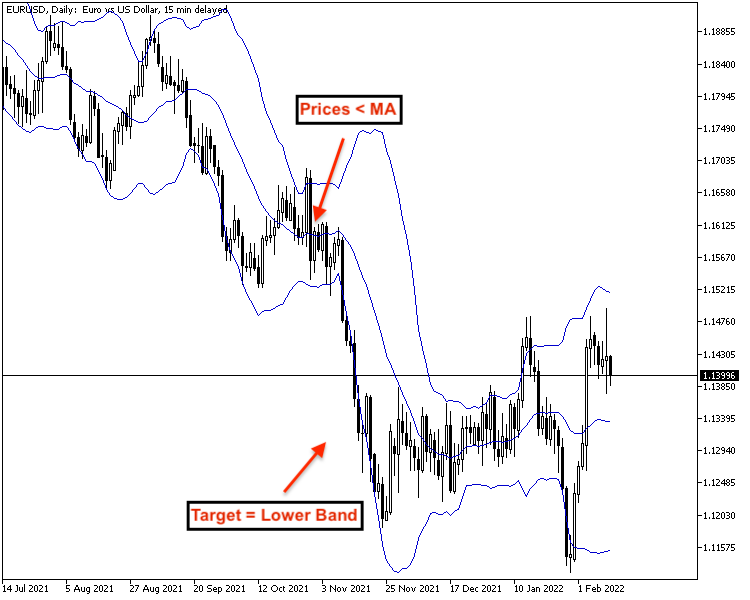
- Short when prices crossover below Moving Average and the target will be the Lower Band.
- Prices < MA = Short, Lower Band = Target
- During Sideways
First, we need to understand how prices move during sideways as we can find that sideways are any movement except uptrend and downtrend.
Sideways show a balance between buyers and sellers as there is no full control on the market from one party of them. The following pictures are examples for some of sideways movements:
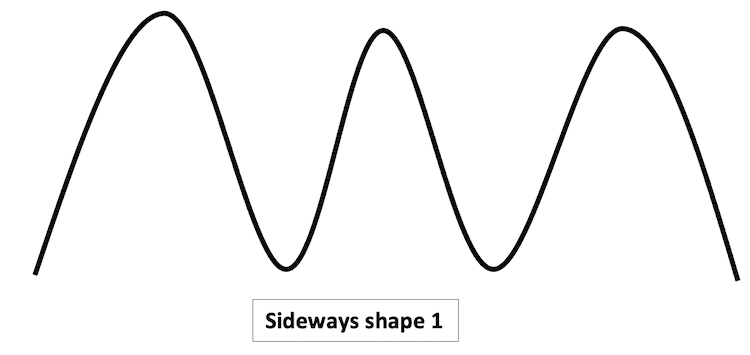
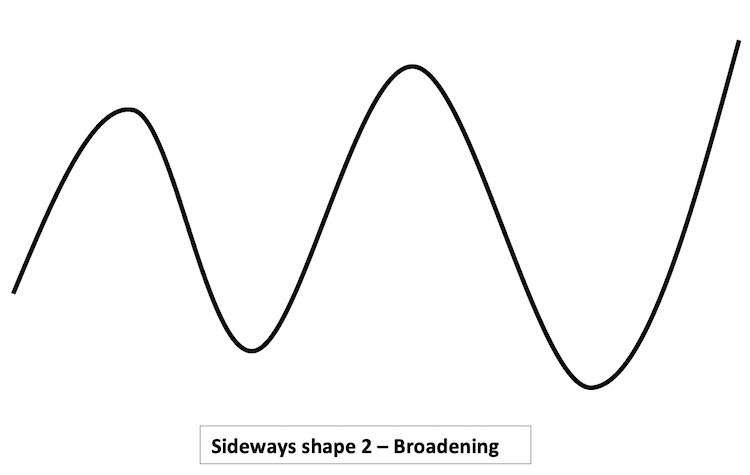
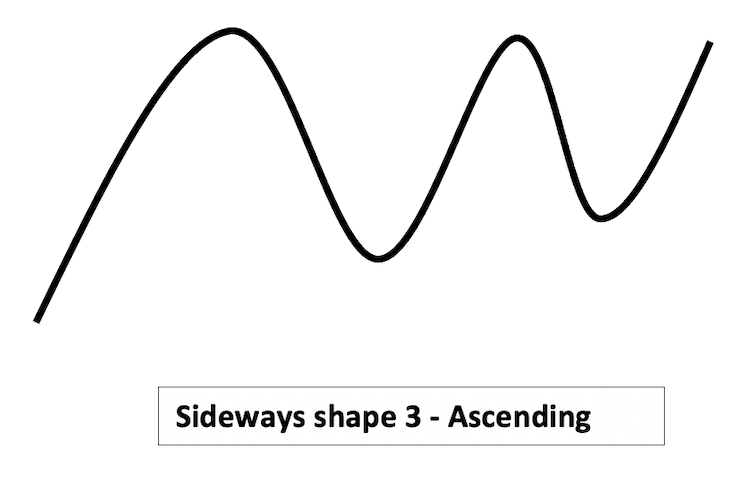
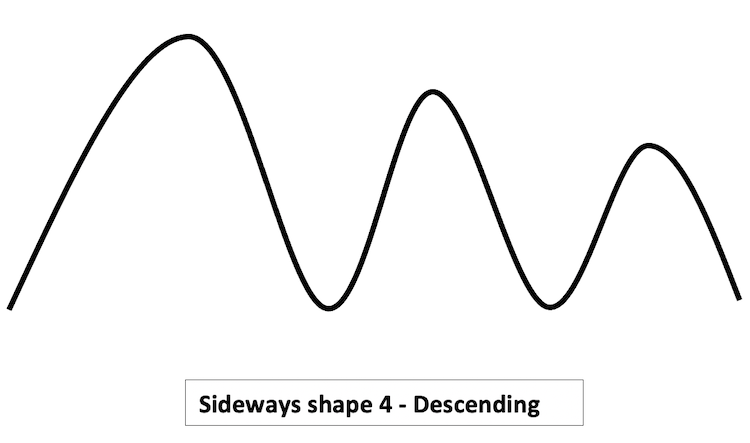
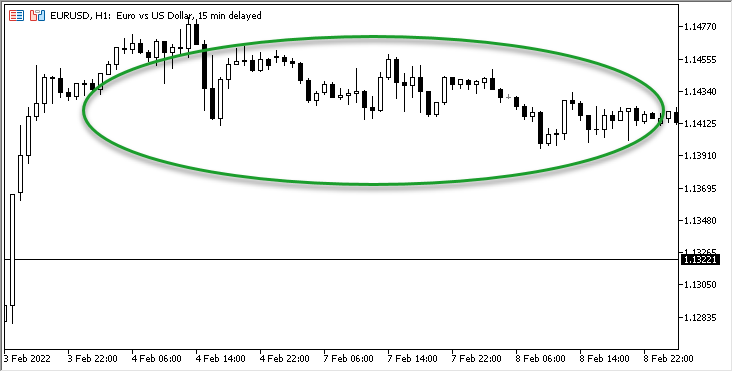
The previous figures are examples for sideways movement and there are more than what I mentioned but the concept of sideways movement is it is any movement except uptrend and downtrend.
Now, we need to know how sideways movement will act with Moving Average as prices do not respect Moving Average as it will crossover to above and below. And the following figure is an example for that:
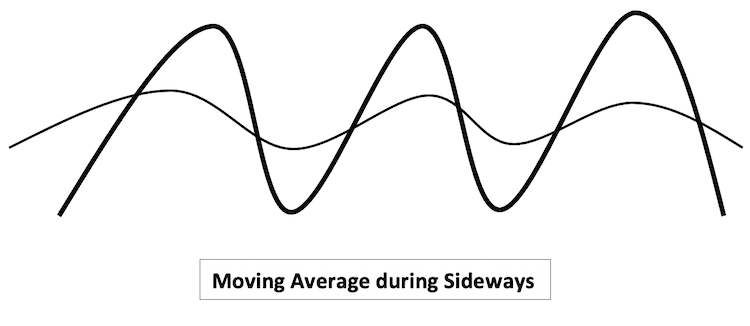
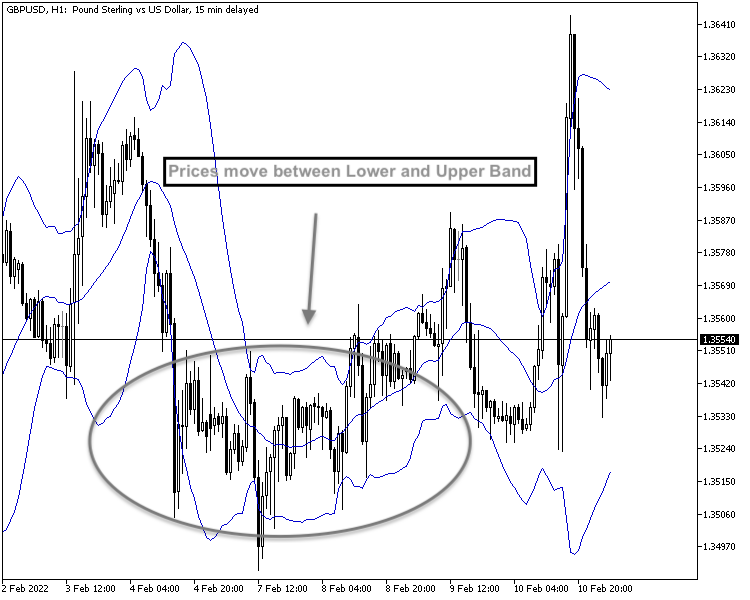
- Prices on Lower Band = Buy, Upper Band = Target
- Prices on Upper Band = Sell, Lower Band = Target
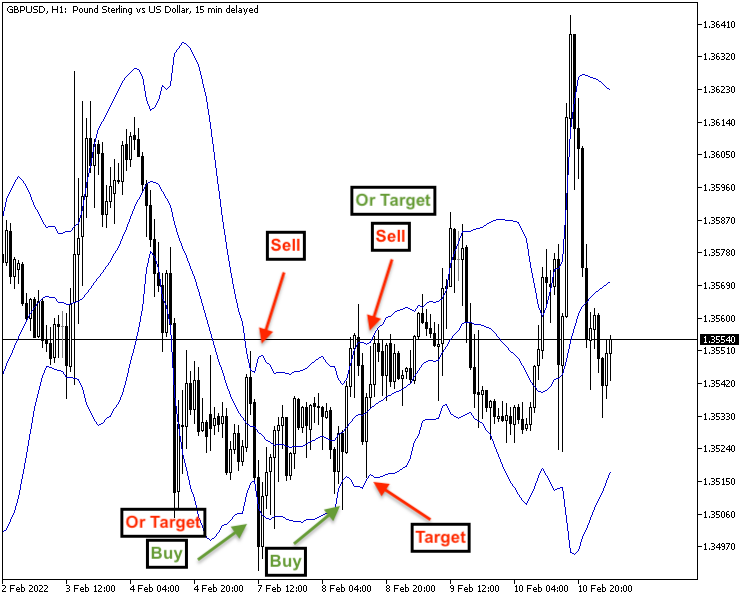
- We can buy on the lower band and take profit on the upper band.
- We can sell on the upper band and take profit on the lower band.
Bollinger Bands Strategies System Designing
In this interesting part, we will learn how to code an algorithmic trading system based on the Bollinger Bands indicator. We will also learn how to create three trading strategies which we mentioned before (Uptrend strategy, Downtrend strategy, and sideways strategy).
You can design your trading system whatever you want, from a simple trading system to an advanced trading system. For example, you can create and design a simple trading system which will generate a simple signal based on a simple concept then you will act according to this signal or you can create and design an advanced trading system which will not only give you a simple signal but gives an advanced signal based on a combination of related concepts and execute it automatically. There are a lot of different approaches. Within this article, we will deal with a simple trading systems - we will create it for educational purposes only to learn the concept. Based on this knowledge, you will be able to develop similar systems or to design your own trading system in your own terms. I hope that you find this article useful for you and it helps you to achieve your trading or investment goals.
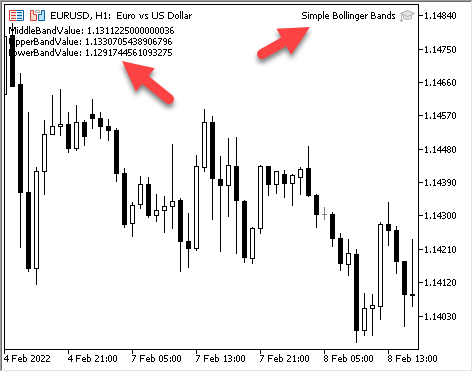
First, we will learn how to design a pure Bollinger Bands code which will allow to appear three comments on the chart with Moving Average Value, Upper Band Value, and Lower Band Value.
The following is the code to do that:
//+------------------------------------------------------------------+
//|                                       Simple Bollinger Bands.mq5 |
//|                                  Copyright 2022, MetaQuotes Ltd. |
//|                                             https://www.mql5.com |
//+------------------------------------------------------------------+

//+------------------------------------------------------------------+
//| Expert tick function                                             |
//+------------------------------------------------------------------+
void OnTick()
  {
   //create an array for several prices
   double MiddleBandArray[];
   double UpperBandArray[];
   double LowerBandArray[];

   //sort the price array from the cuurent candle downwards
   ArraySetAsSeries(MiddleBandArray,true);
   ArraySetAsSeries(UpperBandArray,true);
   ArraySetAsSeries(LowerBandArray,true);

   //define Bollinger Bands
   int BollingerBands = iBands(_Symbol,_Period,20,0,2,PRICE_CLOSE);

   //copy price info into the array
   CopyBuffer(BollingerBands,0,0,3,MiddleBandArray);
   CopyBuffer(BollingerBands,1,0,3,UpperBandArray);
   CopyBuffer(BollingerBands,2,0,3,LowerBandArray);

   //calcualte EA for the cuurent candle
   double MiddleBandValue=MiddleBandArray[0];
   double UpperBandValue=UpperBandArray[0];
   double LowerBandValue=LowerBandArray[0];

   //comments
   Comment("MiddleBandValue: ",MiddleBandValue,"\n",
   "UpperBandValue: ",UpperBandValue,"\n","LowerBandValue: ",LowerBandValue,"\n");

  }
//+------------------------------------------------------------------+
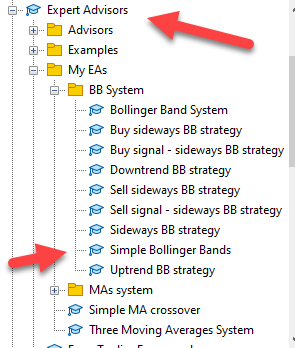
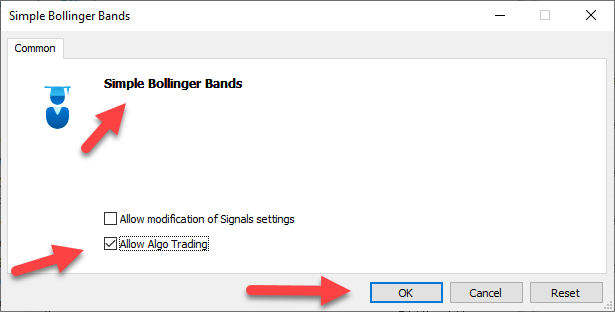
And now after writing the code and compiling it, we have to make sure that the code has no errors or warning the same like the following picture:

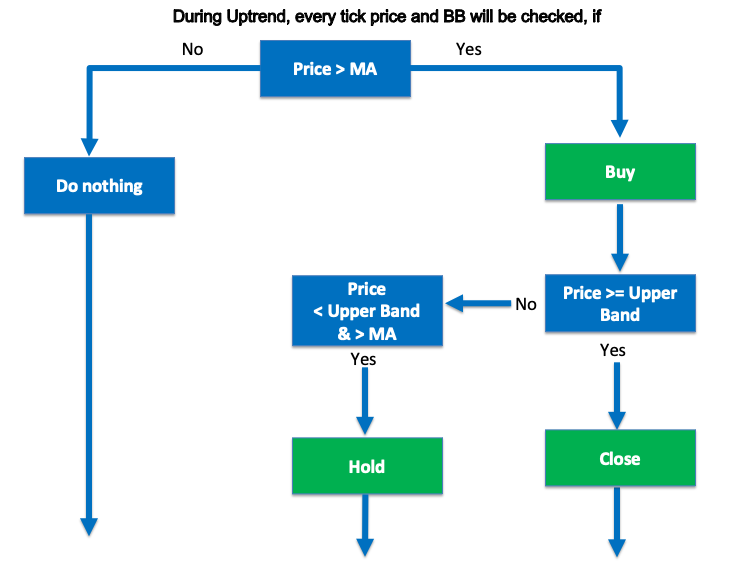
- Uptrend Bollinger Band Strategy Blueprint:
- Prices > MA = Buy, Upper Band = Take Target, Or = No Signal
//+------------------------------------------------------------------+
//|                                          Uptrend BB strategy.mq5 |
//|                                  Copyright 2022, MetaQuotes Ltd. |
//|                                             https://www.mql5.com |
//+------------------------------------------------------------------+
//+------------------------------------------------------------------+
//| Expert tick function                                             |
//+------------------------------------------------------------------+
void OnTick()
  {
   //define Ask, Bid
   double Ask = NormalizeDouble(SymbolInfoDouble(_Symbol,SYMBOL_ASK),_Digits);
   double Bid = NormalizeDouble(SymbolInfoDouble(_Symbol,SYMBOL_BID),_Digits);

   //create an array for several prices
   double MiddleBandArray[];
   double UpperBandArray[];
   double LowerBandArray[];

   //sort the price array from the cuurent candle downwards
   ArraySetAsSeries(MiddleBandArray,true);
   ArraySetAsSeries(UpperBandArray,true);
   ArraySetAsSeries(LowerBandArray,true);

   //define Bollinger Bands
   int BollingerBands = iBands(_Symbol,_Period,20,0,2,PRICE_CLOSE);


   //copy price info into the array
   CopyBuffer(BollingerBands,0,0,3,MiddleBandArray);
   CopyBuffer(BollingerBands,1,0,3,UpperBandArray);
   CopyBuffer(BollingerBands,2,0,3,LowerBandArray);

   //calcualte EA for the cuurent candle
   double MiddleBandValue=MiddleBandArray[0];
   double UpperBandValue=UpperBandArray[0];
   double LowerBandValue=LowerBandArray[0];

   //giving buy signal when price > MA
   if (
      (Ask>=MiddleBandArray[0])
   && (Ask<UpperBandArray[0])
      )
         {
         Comment("BUY");
         }

   //check if we have a take profit signal
   if (
      (Bid>=UpperBandArray[0])
      )
         {
         Comment("TAKE PROFIT");
         }

      //check if we have no signal
   if (
      (Ask<MiddleBandArray[0])
      )
         {
         Comment("NO SIGNAL");
         }
  }
//+------------------------------------------------------------------+
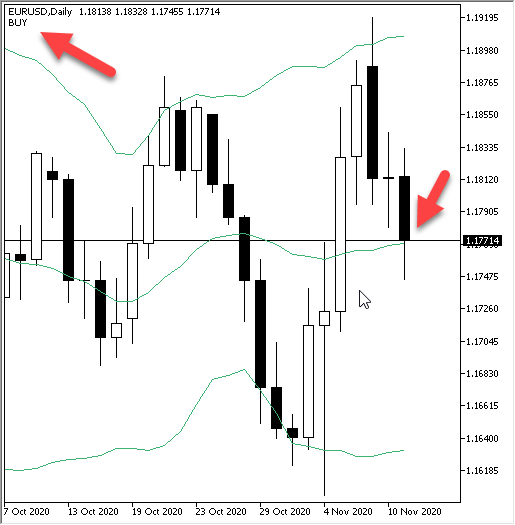
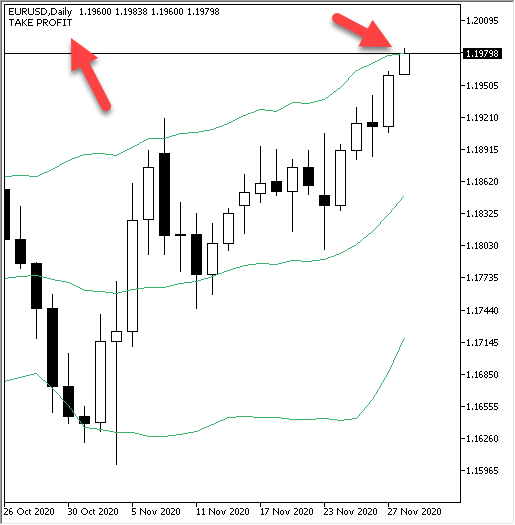
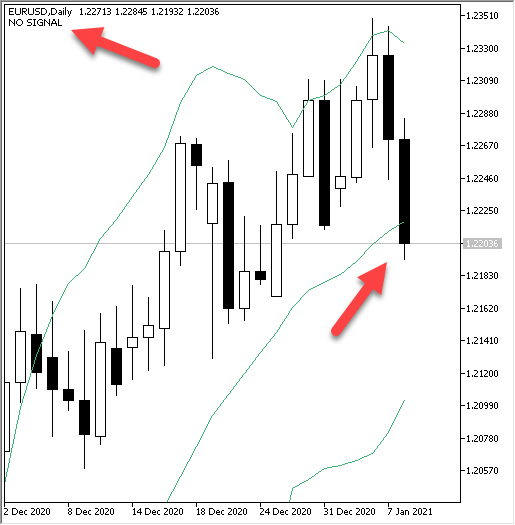
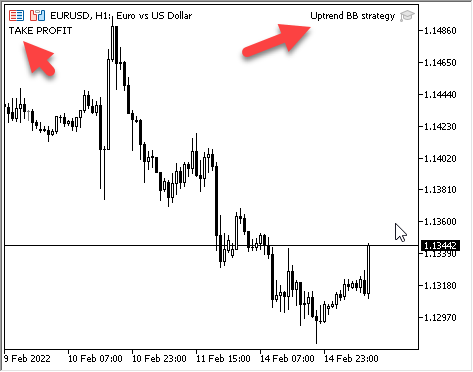
The following screenshots show the signals of this strategy:
- Make sure that your code has no errors or warnings
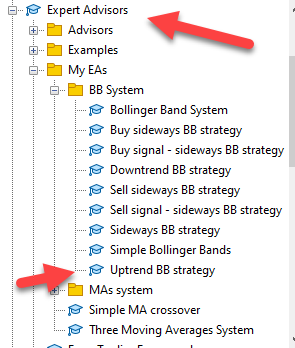
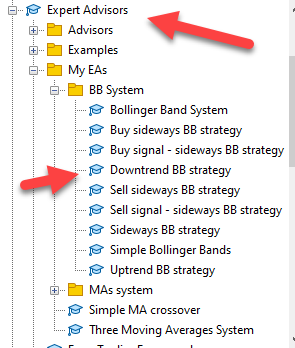
- Find the file
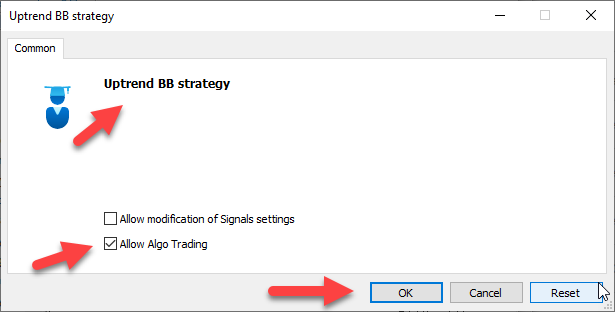
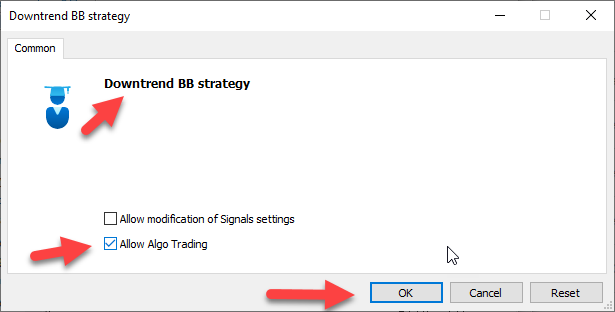
- Execute the code by drag and drop or double click on the file to be attached on the chart

- Downtrend Bollinger Band Strategy Blueprint:
- Prices < MA = Short, Lower Band = Target
//+------------------------------------------------------------------+
//|                                        Downtrend BB strategy.mq5 |
//|                                  Copyright 2022, MetaQuotes Ltd. |
//|                                             https://www.mql5.com |
//+------------------------------------------------------------------+
//+------------------------------------------------------------------+
//| Expert tick function                                             |
//+------------------------------------------------------------------+
void OnTick()
  {
   //define Ask, Bid
   double Ask = NormalizeDouble(SymbolInfoDouble(_Symbol,SYMBOL_ASK),_Digits);
   double Bid = NormalizeDouble(SymbolInfoDouble(_Symbol,SYMBOL_BID),_Digits);

   //create an array for several prices
   double MiddleBandArray[];
   double UpperBandArray[];
   double LowerBandArray[];

   //sort the price array from the cuurent candle downwards
   ArraySetAsSeries(MiddleBandArray,true);
   ArraySetAsSeries(UpperBandArray,true);
   ArraySetAsSeries(LowerBandArray,true);

   //define Bollinger Bands
   int BollingerBands = iBands(_Symbol,_Period,20,0,2,PRICE_CLOSE);


   //copy price info into the array
   CopyBuffer(BollingerBands,0,0,3,MiddleBandArray);
   CopyBuffer(BollingerBands,1,0,3,UpperBandArray);
   CopyBuffer(BollingerBands,2,0,3,LowerBandArray);

   //calcualte EA for the cuurent candle
   double MiddleBandValue=MiddleBandArray[0];
   double UpperBandValue=UpperBandArray[0];
   double LowerBandValue=LowerBandArray[0];

   //giving sell signal when price < MA
   if (
      (Bid<=MiddleBandArray[0])
   && (Bid>LowerBandArray[0])
      )
         {
         Comment("SELL");
         }

   //check if we have a take profit signal
   if (
      (Ask<=LowerBandArray[0])
      )
         {
         Comment("TAKE PROFIT");
         }

      //check if we have no signal
   if (
      (Bid>MiddleBandArray[0])
      )
         {
         Comment("NO SIGNAL");
         }
  }
//+------------------------------------------------------------------+
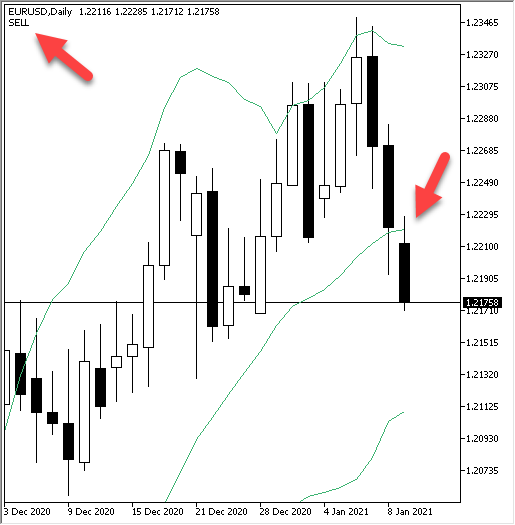
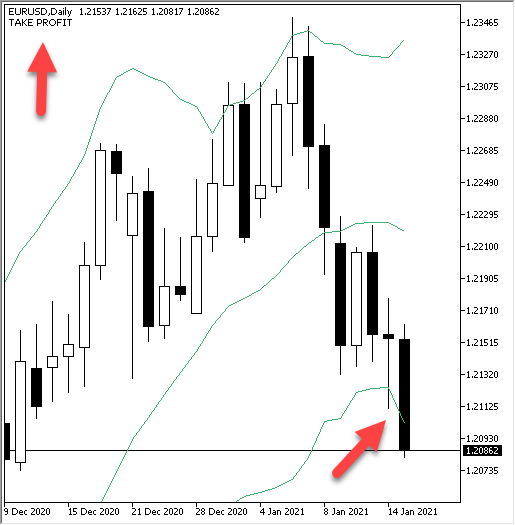
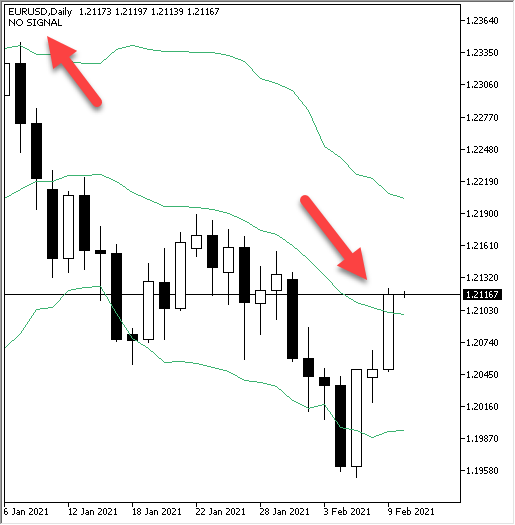
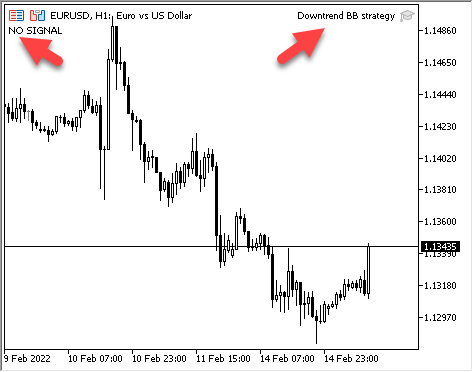
The below screenshots display the signals which were generated by this strategy:
- Make sure that your code has no errors or warnings
- Find the file
- Execute the code by drag and drop or double click on the file to be attached on the chart

- Sideways Bollinger Band Strategy Blueprint:
- Prices on Lower Band = Buy, Upper Band = Target
- Prices on Upper Band = Sell, Lower Band = Target

A- Buy signal which is generated when touching lower band,
//+------------------------------------------------------------------+
//|                                     Buy sideways BB strategy.mq5 |
//|                                  Copyright 2022, MetaQuotes Ltd. |
//|                                             https://www.mql5.com |
//+------------------------------------------------------------------+
//+------------------------------------------------------------------+
//| Expert tick function                                             |
//+------------------------------------------------------------------+
void OnTick()
  {
   //define Ask, Bid
   double Ask = NormalizeDouble(SymbolInfoDouble(_Symbol,SYMBOL_ASK),_Digits);
   double Bid = NormalizeDouble(SymbolInfoDouble(_Symbol,SYMBOL_BID),_Digits);

   //create an array for several prices
   double MiddleBandArray[];
   double UpperBandArray[];
   double LowerBandArray[];

   //sort the price array from the cuurent candle downwards
   ArraySetAsSeries(MiddleBandArray,true);
   ArraySetAsSeries(UpperBandArray,true);
   ArraySetAsSeries(LowerBandArray,true);

   //define Bollinger Bands
   int BollingerBands = iBands(_Symbol,_Period,20,0,2,PRICE_CLOSE);


   //copy price info into the array
   CopyBuffer(BollingerBands,0,0,3,MiddleBandArray);
   CopyBuffer(BollingerBands,1,0,3,UpperBandArray);
   CopyBuffer(BollingerBands,2,0,3,LowerBandArray);

   //calcualte EA for the cuurent candle
   double MiddleBandValue=MiddleBandArray[0];
   double UpperBandValue=UpperBandArray[0];
   double LowerBandValue=LowerBandArray[0];

   //giving buy signal when price > MA
   if (
      (Ask<=LowerBandArray[0])
      )
         {
         Comment("BUY");
         }

   //check if we have a take profit signal
   if (
      (Bid>=UpperBandArray[0])
      )
         {
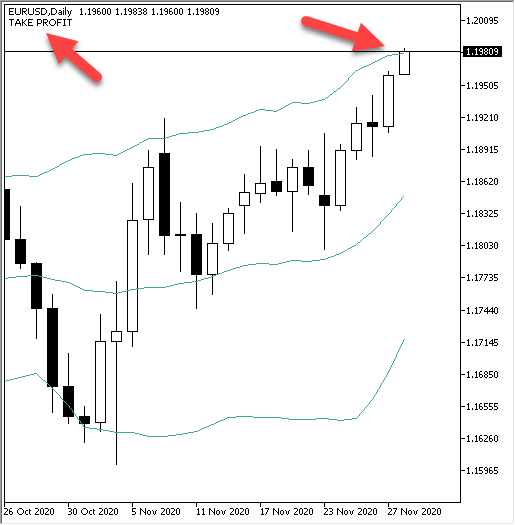
         Comment("TAKE PROFIT");
         }

  }
//+------------------------------------------------------------------+
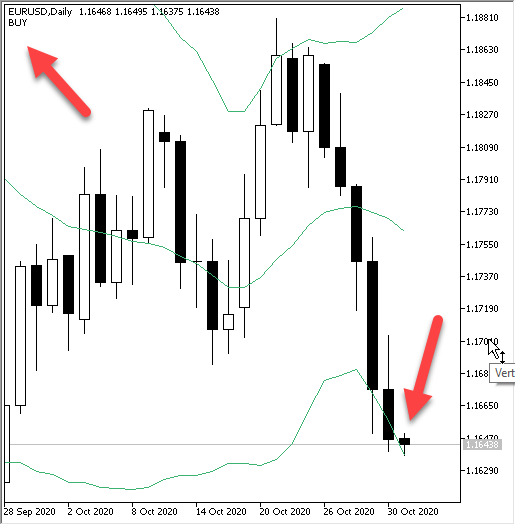
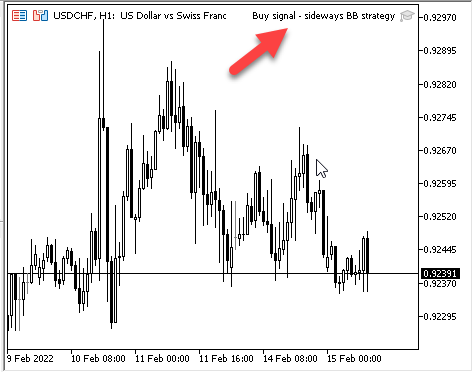
The signals generated by this strategy:
- Make sure that your code has no errors or warning
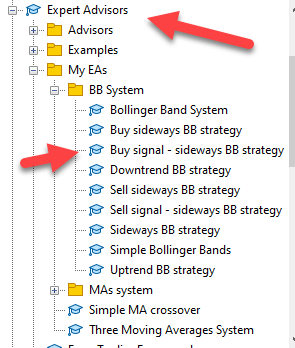
- Find the file
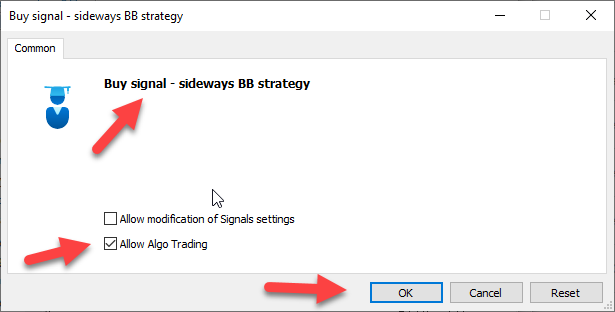
- Execute the code by drag and drop or double click on the file to be attached on the chart

The following is the code to do that:B- Sell signal which is generated when touching upper band,
//+------------------------------------------------------------------+
//|                                    Sell sideways BB strategy.mq5 |
//|                                  Copyright 2022, MetaQuotes Ltd. |
//|                                             https://www.mql5.com |
//+------------------------------------------------------------------+
//+------------------------------------------------------------------+
//| Expert tick function                                             |
//+------------------------------------------------------------------+
void OnTick()
  {
   //define Ask, Bid
   double Ask = NormalizeDouble(SymbolInfoDouble(_Symbol,SYMBOL_ASK),_Digits);
   double Bid = NormalizeDouble(SymbolInfoDouble(_Symbol,SYMBOL_BID),_Digits);

   //create an array for several prices
   double MiddleBandArray[];
   double UpperBandArray[];
   double LowerBandArray[];

   //sort the price array from the cuurent candle downwards
   ArraySetAsSeries(MiddleBandArray,true);
   ArraySetAsSeries(UpperBandArray,true);
   ArraySetAsSeries(LowerBandArray,true);

   //define Bollinger Bands
   int BollingerBands = iBands(_Symbol,_Period,20,0,2,PRICE_CLOSE);


   //copy price info into the array
   CopyBuffer(BollingerBands,0,0,3,MiddleBandArray);
   CopyBuffer(BollingerBands,1,0,3,UpperBandArray);
   CopyBuffer(BollingerBands,2,0,3,LowerBandArray);

   //calcualte EA for the cuurent candle
   double MiddleBandValue=MiddleBandArray[0];
   double UpperBandValue=UpperBandArray[0];
   double LowerBandValue=LowerBandArray[0];

   //giving sell signal when price < MA
   if (
      (Bid>=UpperBandArray[0])
      )
         {
         Comment("SELL");
         }

   //check if we have a take profit signal
   if (
      (Ask<=LowerBandArray[0])
      )
         {
         Comment("TAKE PROFIT");
         }
  }
//+------------------------------------------------------------------+
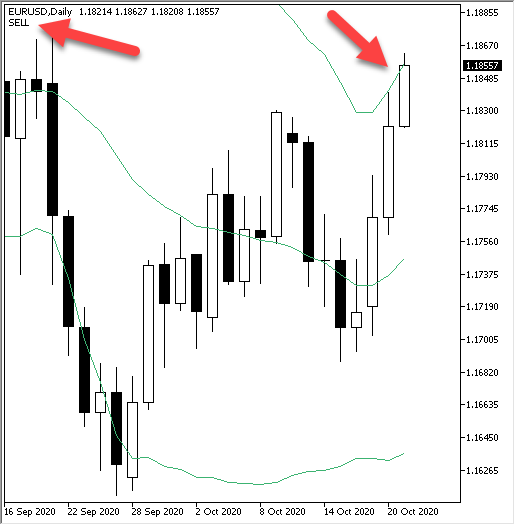
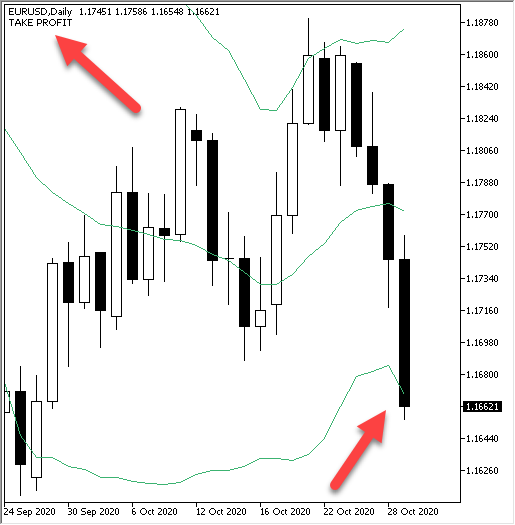
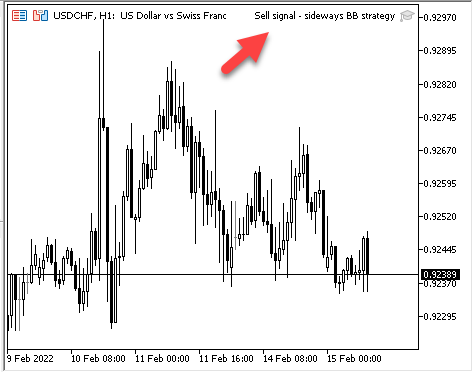
The following are screen shots for signal which is generated by this strategy:
- Make sure that your code has no errors or warning
- Find the file
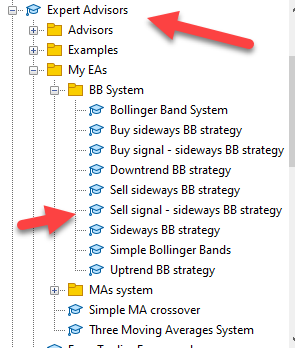
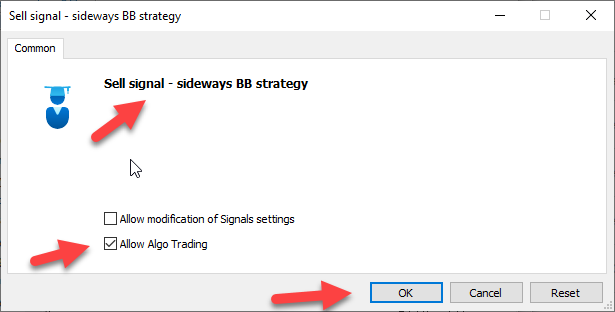
- Execute the code by drag and drop or double click on the file to be attached on the chart

Conclusion
The concept of Trading Bands is very good as it gives us a clear expectation for the upcoming movement to take an advantage from this movement and benefit from it and there are many methods to trade bands like Bollinger Bands and like what we knew that it is a good tool or methods as it can expand and contract with price movements and we can use it with all market conditions or trends.
And like what I mention before, at this article I tried to share with the concept of Bollinger Bands indicators, how we can calculate it to enhance the understanding of it, and mentioned simple trading strategies by Bollinger Bands indicator then learned how to design simple trading systems for these simple strategies.
Now, you can develop or design your own strategy which will be suitable for your trading style. I hope you find this article useful for you and your trading.
References
- Bollinger on Bollinger Bands by John Bollinger
- https://www.bollingerbands.com/about-us
- https://www.investopedia.com/trading/using-bollinger-bands-to-gauge-trends
- https://school.stockcharts.com/doku.php?id=technical_indicators:bollinger_bands
Warning: All rights to these materials are reserved by MetaQuotes Ltd. Copying or reprinting of these materials in whole or in part is prohibited.
This article was written by a user of the site and reflects their personal views. MetaQuotes Ltd is not responsible for the accuracy of the information presented, nor for any consequences resulting from the use of the solutions, strategies or recommendations described.
 An Analysis of Why Expert Advisors Fail
 Improved candlestick pattern recognition illustrated by the example of Doji
- Free trading apps
- Over 8,000 signals for copying
- Economic news for exploring financial markets
You agree to website policy and terms of use
Dear Sir,
Could you please help to also provide the code for auto trade EA for this trading system? So we can have an EA for auto trade/robot. Thank you.
Best Regards,
Rusmin
Thanks for your comment and I will try.
Thanks for this useful info.
I think there is an issue in your Trend system: if the current price is near the Upper/Lower band for a long time, it will generate too many signals. To reduce their number, you can add some offset from the Upper/Lower band to the Middle line:
or you can make it wait for a rollback beyond the Middle line and its re-crossing.
You can use only one order per expert .
Some like:
if(m_Position.SelectByMagic( Symbol() ,order_magic))