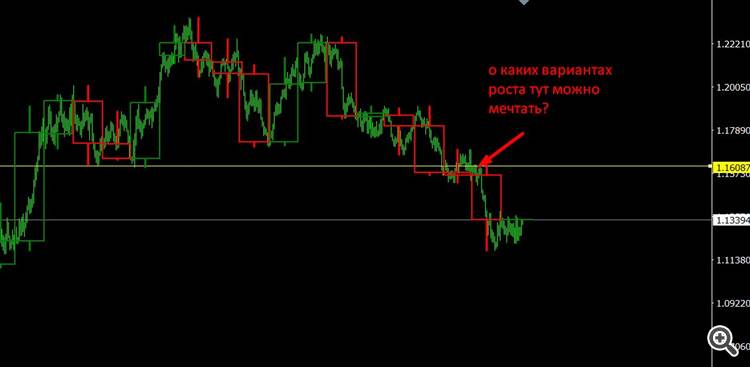
Это не какая-то магия или лукавый трюк. Это самые настоящие свечи Доджи, основанные на реальных ценовых движениях длиной в 5, 4 и 3 часовых баров, которые не было видно на стандартном таймфрейме H4 просто потому, что там жестко задана длина бара в 4 часа и жесткое время начала этого бара. Отличие длины всего на 1 час или сдвиг границ бара на 1 час приводят к серьезной разнице в результате.
How many of these Dodgy candles are not seen by traders? And that's a huge number of missed signals for trading.
One problem. All candlestick patterns, as well as the rest of technical analysis, work only because everyone sees them (self-fulfilling prophecy).
And for the masses to start looking at these "shifted" patterns, they must become popular. But they won't, because they won't work (see point 1).
Such a vicious circle ;)
But the idea is interesting, thanks for the article.
All known price patterns, if they are put together like this, will turn into some known candlestick pattern. And vice versa.
This is such a fixation of extremum and price return to the same values with an extended range in time) I.e. if in the return prices coincide with growth prices on the border of bars of smaller TFs, it is a change of direction, and if they do not coincide, then no)))))
I don't even know, but there may be logic in it, but definitely not 100%
Interesting article, as the author has identified an important analytics problem, viz:
in traditional TA, no elementary structure suitable for analysis at any moment, which is present on the graph without discontinuities in time and has reliable parameters, has been identified. In physics it is an atom, in chemistry it is a molecule or an element of the Mendeleev table. Someone will say, what is wrong with a candle?
The candlestick is convenient and is constantly present on the chart, but the point is that its Close level is not reliable, as it is not fractal, but only an intermediate level within the corrective movement.
- Free trading apps
- Over 8,000 signals for copying
- Economic news for exploring financial markets
You agree to website policy and terms of use

New article Improved candlestick pattern recognition illustrated by the example of Doji has been published:
How to find more candlestick patterns than usual? Behind the simplicity of candlestick patterns, there is also a serious drawback, which can be eliminated by using the significantly increased capabilities of modern trading automation tools.
The M1 timeframe with wide metabars has enabled us to look into a new dimension that was previously inaccessible. Each dense sequence of candlesticks displayed on such an indicator describes in fact one candlestick which changes in time. The analysis of this dynamics might allow someone to make additional conclusions about candlesticks which are not available in the traditional approach, in which a candlestick was considered as a static entity bound to one bar. With static candlesticks, there is no information about what would happen to the candlestick if the time parameter slightly changed. This new area is now available for research.
Figure 13. Doji candlestick indicator constructed on metabars each consisting of 180-300 M1 bars, with the height filter
Author: ds2