
Custom indicators and infographics in CCanvas

Contents
- Introduction
- CLineRounded class
- CHexagon class
- CPetal class
- CHistogram class
- CPyramid class
- Conclusion
Introduction
In our previous article we considered the principles of constructing graphical indicators using the methods for developing simple primitives of the CCanvas class. However, the custom graphics library has much broader capabilities, therefore I suggest to have a look at new types of indicators with more complex structural implementation. In addition, we are going to plot pseudo-3D indicator types and dynamic infographics.
CLineRounded class
I am not going to recreate the general structure of basic classes in this article in order to implement graphical objects. Instead, we will use the ready-made CustomGUI library described in the previous article. In particular, the CCanvasBase class is to be used as a base one. The newly developed classes are to complement the list in the CustomGUI.mqh file.
To develop a simple linear indicator, we should define its structure and basic elements. The Fig. 1 presents the elements you can manage when using this indicator type. Note that they are not simple elements.
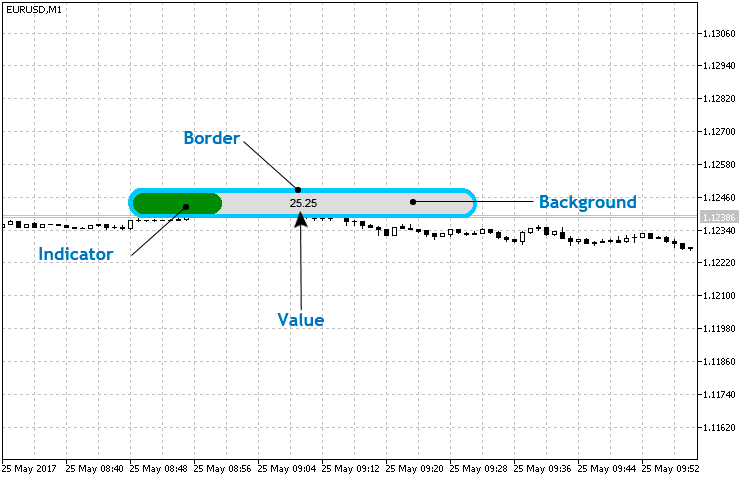
Fig. 1. The basic structure of a simple linear indicator
The element implemented by the CCanvas class methods is considered to be simple (basic). For example, only the Value is considered to be simple in the linear indicator since it is implemented using the CCanvas::TextOut() method. The three remaining elements are similar and consist mainly of three basic figures — two filled circles (CCanvas::FillCircle() implementation) and a rectangle (CCanvas::FillRectangle()).
Create the LineRounded.mqh file in the CustomGUI/Indicators folder, create the СLineRounded class in the newly generated file and assign the previously created CCanvasBase class as a base one for it.
//+------------------------------------------------------------------+
//|                                                  LineRounded.mqh |
//|                                Copyright 2017, Alexander Fedosov |
//|                           https://www.mql5.com/en/users/alex2356 |
//+------------------------------------------------------------------+
#include "..\CanvasBase.mqh"
//+------------------------------------------------------------------+
//| Rounded linear indicator                                         |
//+------------------------------------------------------------------+
class CLineRounded : public CCanvasBase
Also, add it to the list in the CustomGUI.mqh file providing quick access to all the library classes. Considering the previously developed classes, its code will look as follows:
//+------------------------------------------------------------------+
//|                                                    CustomGUI.mqh |
//|                                Copyright 2017, Alexander Fedosov |
//|                           https://www.mql5.com/en/users/alex2356 |
//+------------------------------------------------------------------+
#include "Indicators\CircleSimple.mqh"
#include "Indicators\CircleArc.mqh"
#include "Indicators\CircleSection.mqh"
#include "Indicators\LineGraph.mqh"
#include "Indicators\LineRounded.mqh"
//+------------------------------------------------------------------+
The full list of properties and methods of the СLineRounded class can be studied in the CustomGUI/Indicators/LineRounded.mqh file. Let's focus on the methods for developing and setting the indicator and updating its values. As mentioned above, the indicator is to consist of composite elements. The implementation of these elements is commented on in separate blocks in the listing below.
//+------------------------------------------------------------------+
//| Create the indicator                                             |
//+------------------------------------------------------------------+
void CLineRounded::Create(string name,int x,int y)
  {
//--- Modify the indicator location relative to the coordinate axes
   x=(x<m_x_size/2)?m_x_size/2:x;
   y=(y<m_y_size/2)?m_y_size/2:y;
   Name(name);
   X(x);
   Y(y);
   XSize(m_x_size);
   YSize(m_y_size);
   if(!CreateCanvas())
      Print("Error. Can not create Canvas.");
//--- Frame
   m_canvas.FillRectangle(YSize()/2,0,XSize()-YSize()/2,YSize(),ColorToARGB(m_border_color,m_transparency));
   m_canvas.FillCircle(YSize()/2,YSize()/2-1,YSize()/2,ColorToARGB(m_border_color,m_transparency));
   m_canvas.FillCircle(XSize()-YSize()/2-1,YSize()/2,YSize()/2,ColorToARGB(m_border_color,m_transparency));
//--- Backdrop
   m_canvas.FillRectangle(YSize()/2,m_border,XSize()-YSize()/2,YSize()-m_border,ColorToARGB(m_bg_color,m_transparency));
   m_canvas.FillCircle(YSize()/2,YSize()/2,YSize()/2-m_border,ColorToARGB(m_bg_color,m_transparency));
   m_canvas.FillCircle(XSize()-YSize()/2,YSize()/2,YSize()/2-m_border,ColorToARGB(m_bg_color,m_transparency));
   m_canvas.Update();
  }
As you can see, the Frame and Backdrop are implemented using the two methods. Do not forget that these objects are layers and are drawn overlapping each other. Therefore, first, we draw the frame followed by the smaller backdrop, indicator scale and numerical value.
Consider the CLineRounded::NewValue() method.
//+------------------------------------------------------------------+
//| Set and update the indicator value                               |
//+------------------------------------------------------------------+
void CLineRounded::NewValue(double value,double maxvalue,int digits=0)
  {
   int v;
   v=int((XSize()-YSize()/2)/maxvalue*value);

//--- Backdrop
   m_canvas.FillRectangle(YSize()/2,m_border,XSize()-YSize()/2,YSize()-m_border,ColorToARGB(m_bg_color,m_transparency));
   m_canvas.FillCircle(YSize()/2,YSize()/2,YSize()/2-m_border,ColorToARGB(m_bg_color,m_transparency));
   m_canvas.FillCircle(XSize()-YSize()/2,YSize()/2,YSize()/2-m_border,ColorToARGB(m_bg_color,m_transparency));
//--- Scale
   if(v>=YSize()/2 && v<=(XSize()-YSize()/2))
     {
      m_canvas.FillRectangle(YSize()/2,m_border,v,YSize()-m_border,ColorToARGB(m_scale_color,m_transparency));
      m_canvas.FillCircle(YSize()/2,YSize()/2,YSize()/2-m_border,ColorToARGB(m_scale_color,m_transparency));
      m_canvas.FillCircle(v,YSize()/2,YSize()/2-m_border,ColorToARGB(m_scale_color,m_transparency));
     }
   else if(v>(XSize()-YSize()/2))
     {
      m_canvas.FillRectangle(YSize()/2,m_border,XSize()-YSize()/2,YSize()-m_border,ColorToARGB(m_scale_color,m_transparency));
      m_canvas.FillCircle(YSize()/2,YSize()/2,YSize()/2-m_border,ColorToARGB(m_scale_color,m_transparency));
      m_canvas.FillCircle(XSize()-YSize()/2,YSize()/2,YSize()/2-m_border,ColorToARGB(m_scale_color,m_transparency));
     }
   else if(v>0 && v<YSize()/2)
      m_canvas.FillCircle(YSize()/2,YSize()/2,YSize()/2-m_border,ColorToARGB(m_scale_color,m_transparency));

//--- Numerical value
   m_canvas.FontSizeSet(m_font_size);
   m_canvas.TextOut(XSize()/2,YSize()/2,DoubleToString(value,digits),ColorToARGB(m_value_color,m_transparency),TA_CENTER|TA_VCENTER);
   m_canvas.Update();
  }
//+------------------------------------------------------------------+
As we can see, the backdrop implementation block is present again at the beginning of the method. Why? Keep in mind the layer-by-layer drawing of the elements by means of consistent application of the corresponding methods. In other words, first, we display the scale background followed by the indicator with its length defined by the maximum parameter value. When the new indicator value arrives, the backdrop layer is re-drawn first followed by the scale with a new length.
Creating and passing the value to the indicator is implemented in a very simple manner. In the listing below, you can see the two indicators with small settings differing only in that one of them has a maximum value two times greater than that of another one.
//+------------------------------------------------------------------+
//|                                                          001.mq5 |
//|                                Copyright 2017, Alexander Fedosov |
//|                           https://www.mql5.com/en/users/alex2356 |
//+------------------------------------------------------------------+
#property version   "1.00"
#property indicator_plots 0
#property indicator_chart_window

#include <CustomGUI\CustomGUI.mqh>
//---
CLineRounded ind1,ind2;
//+------------------------------------------------------------------+
//| Custom indicator initialization function                         |
//+------------------------------------------------------------------+
int OnInit()
  {
//---
   ind1.XSizeInd(350);
   ind1.YSizeInd(30);
   ind1.Create("line1",300,100);
//---
   ind2.XSizeInd(350);
   ind2.YSizeInd(30);
   ind2.ScaleColor(clrFireBrick);
   ind2.Create("line2",300,150);
//---
   return(INIT_SUCCEEDED);
  }
//+------------------------------------------------------------------+
//| Custom indicator iteration function                              |
//+------------------------------------------------------------------+
int OnCalculate(const int rates_total,
                const int prev_calculated,
                const datetime &time[],
                const double &open[],
                const double &high[],
                const double &low[],
                const double &close[],
                const long &tick_volume[],
                const long &volume[],
                const int &spread[])
  {
//---
   ind1.NewValue(50,100,2);
   ind2.NewValue(50,200,2);
//--- return value of prev_calculated for next call
   return(rates_total);
  }
//+------------------------------------------------------------------+
//| Custom indicator deinitialization function                       |
//+------------------------------------------------------------------+
void OnDeinit(const int reason)
  {
   ind1.Delete();
   ind2.Delete();
  }
//+------------------------------------------------------------------+
The Fig. 2 clearly shows that the indicator scale length has an appropriate value in case of similar values and different scales. The value of 50 and maximum (100 for the first and 200 for the second one) are selected so that the display result can be evaluated visually.
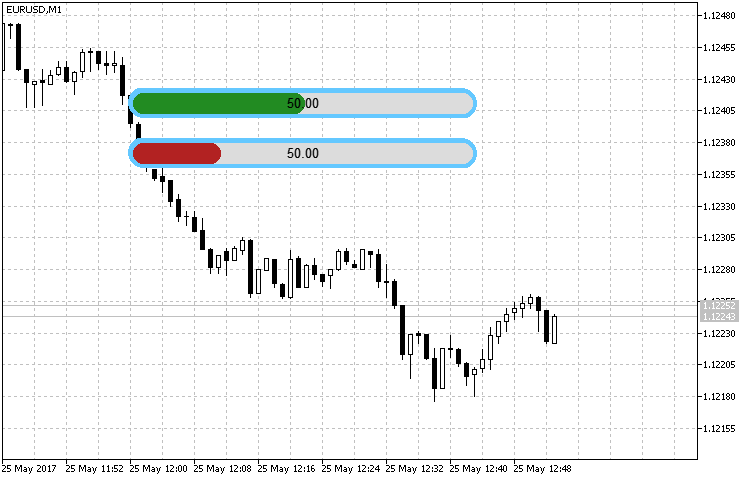
Fig. 2. Sample rounded linear indicator
CHexagon class
We can use a number of methods to plot an indicator in the form of a regular hexagon using the primitives set by the CCanvas class. They include construction of a polyline with subsequent filling in the area and "assembling" six equilateral triangles, like slices of pizza. However, our objective is the maximum simplicity. Therefore, we are going to construct a regular hexagon using three primitives — a rectangle and two isosceles triangles.
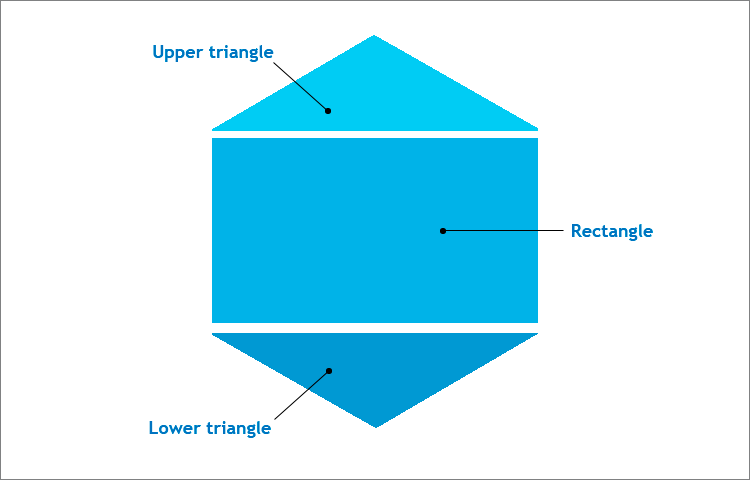
Fig. 3. A regular hexagon structure
The right hexagon is inserted in the square canvas. Keep in mind the figure properties:
- The side of the regular hexagon is equal to the radius of the circle circumscribed around it (in our case, this is the half of the canvas side). This feature is necessary when plotting a rectangle.
- The hexagon angle is 120 degrees, therefore the angles at the bases of isosceles triangles are 30 degrees each. This data is necessary for defining the triangle height and finding the coordinates of the triangles base points when using the CCanvas::FillTriangle() method.
The basic structure of the indicator itself is quite simple and, in addition to the hexagon, includes two text objects - numerical value and description (Fig. 4).
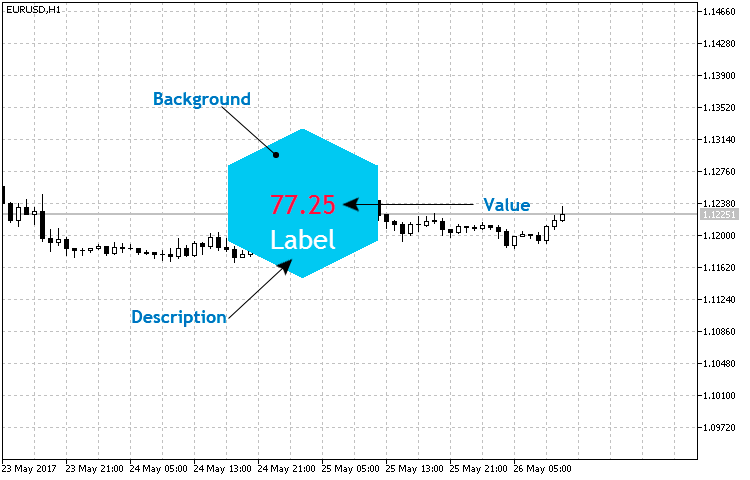
Fig. 4. The basic structure of the hexagonal indicator
Create the Hexagon.mqh file in the CustomGUI/Indicators folder, create the СHexagon class in the newly generated file and assign the previously created CCanvasBase class as a base one for it. Include it to the general list:
//+------------------------------------------------------------------+
//|                                                    CustomGUI.mqh |
//|                                Copyright 2017, Alexander Fedosov |
//|                           https://www.mql5.com/en/users/alex2356 |
//+------------------------------------------------------------------+
#include "Indicators\CircleSimple.mqh"
#include "Indicators\CircleArc.mqh"
#include "Indicators\CircleSection.mqh"
#include "Indicators\LineGraph.mqh"
#include "Indicators\LineRounded.mqh"
#include "Indicators\Hexagon.mqh"
//+------------------------------------------------------------------+
The full list of properties and methods can be found in the file created above. Let's highlight the methods responsible for the indicator visualization.
//+------------------------------------------------------------------+
//| Create the indicator                                             |
//+------------------------------------------------------------------+
void CHexagon::Create(string name,int x,int y)
  {
   int a,r;
   r=m_size;
//--- Modify the indicator location relative to the coordinate axes
   x=(x<r/2)?r/2:x;
   y=(y<r/2)?r/2:y;
   Name(name);
   X(x);
   Y(y);
   XSize(r);
   YSize(r);
   if(!CreateCanvas())
      Print("Error. Can not create Canvas.");
//--- Calculate the triangles height
   a=int(YSize()/2*MathSin(30*M_PI/180));
//--- Hexagonal form
   m_canvas.FillTriangle(XSize()/2,0,0,a,XSize(),a,ColorToARGB(m_bg_color,m_transparency));
   m_canvas.FillRectangle(0,a,XSize(),a+YSize()/2,ColorToARGB(m_bg_color,m_transparency));
   m_canvas.FillTriangle(0,a+YSize()/2,XSize(),a+YSize()/2,XSize()/2,YSize(),ColorToARGB(m_bg_color,m_transparency));
//--- Description and numerical values
   m_canvas.FontNameSet("Trebuchet MS");
   m_canvas.FontSizeSet(m_value_font_size);
   m_canvas.TextOut(r/2,r/2,"-",ColorToARGB(m_value_color,m_transparency),TA_CENTER|TA_VCENTER);
   m_canvas.FontSizeSet(m_label_font_size);
   m_canvas.TextOut(r/2,r/2+m_value_font_size,m_label_value,ColorToARGB(m_label_color,m_transparency),TA_CENTER|TA_VCENTER);
//---
   m_canvas.Update();
  }
In the Create() method, the value of the isosceles triangles is assigned to a variable. In fact, in this way we find the coordinates of the triangle points along the ordinate (Y) axis. The method of transferring and updating the numerical value is different only in the fact that the text object responsible for drawing a numerical value receives the value argument:
//+------------------------------------------------------------------+
//| Set and update the indicator value                               |
//+------------------------------------------------------------------+
void CHexagon::NewValue(double value,int digits=2)
  {
   int a,r;
   r=m_size;
//--- Calculate the triangles height
   a=int(YSize()/2*MathSin(30*M_PI/180));
//--- Hexagonal form
   m_canvas.FillTriangle(XSize()/2,0,0,a,XSize(),a,ColorToARGB(m_bg_color,m_transparency));
   m_canvas.FillRectangle(0,a,XSize(),a+YSize()/2,ColorToARGB(m_bg_color,m_transparency));
   m_canvas.FillTriangle(0,a+YSize()/2,XSize(),a+YSize()/2,XSize()/2,YSize(),ColorToARGB(m_bg_color,m_transparency));
//--- Text
   m_canvas.FontNameSet("Trebuchet MS");
   m_canvas.FontSizeSet(m_value_font_size);
   m_canvas.TextOut(r/2,r/2,DoubleToString(value,digits),ColorToARGB(m_value_color,m_transparency),TA_CENTER|TA_VCENTER);
   m_canvas.FontSizeSet(m_label_font_size);
   m_canvas.TextOut(r/2,r/2+m_value_font_size,m_label_value,ColorToARGB(m_label_color,m_transparency),TA_CENTER|TA_VCENTER);
//---
   m_canvas.Update();
  }
//+------------------------------------------------------------------+
Let's implement a small set of hexagonal indicators as an example:
//+------------------------------------------------------------------+
//|                                                          002.mq5 |
//|                                Copyright 2017, Alexander Fedosov |
//|                           https://www.mql5.com/en/users/alex2356 |
//+------------------------------------------------------------------+
#property version   "1.00"
#property indicator_plots 0
#property indicator_chart_window

#include <CustomGUI\CustomGUI.mqh>
//---
CHexagon ind1,ind2,ind3,ind4,ind5,ind6,ind7,ind8,ind9,ind10,ind11,ind12,ind13,ind14;
//+------------------------------------------------------------------+
//| Custom indicator initialization function                         |
//+------------------------------------------------------------------+
int OnInit()
  {
//---
   ind1.BgColor(clrWhite);
   ind1.Size(110);
   ind1.Create("hex1",300,200);
   ind2.BgColor(C'60,170,220');
   ind2.Create("hex2",300,200);
//---
   ind3.BgColor(clrWhite);
   ind3.Size(110);
   ind3.Create("hex3",300,80);
   ind4.BgColor(C'230,80,25');
   ind4.Create("hex4",300,80);
//---
   ind5.BgColor(clrWhite);
   ind5.Size(110);
   ind5.Create("hex5",300,320);
   ind6.BgColor(C'150,190,15');
   ind6.Create("hex6",300,320);
//---
   ind7.BgColor(clrWhite);
   ind7.Size(110);
   ind7.Create("hex7",180,140);
   ind8.BgColor(C'10,115,185');
   ind8.Create("hex8",180,140);
//---
   ind9.BgColor(clrWhite);
   ind9.Size(110);
   ind9.Create("hex9",420,140);
   ind10.BgColor(C'20,150,150');
   ind10.Create("hex10",420,140);
//---
   ind11.BgColor(clrWhite);
   ind11.Size(110);
   ind11.Create("hex11",420,280);
   ind12.BgColor(C'225,0,80');
   ind12.Create("hex12",420,280);
//---
   ind13.BgColor(clrWhite);
   ind13.Size(110);
   ind13.Create("hex13",180,280);
   ind14.BgColor(C'240,145,5');
   ind14.Create("hex14",180,280);
//---
   return(INIT_SUCCEEDED);
  }
//+------------------------------------------------------------------+
//| Custom indicator deinitialization function                       |
//+------------------------------------------------------------------+
void OnDeinit(const int reason)
  {
   ind1.Delete();
   ind2.Delete();
   ind3.Delete();
   ind4.Delete();
   ind5.Delete();
   ind6.Delete();
   ind7.Delete();
   ind8.Delete();
   ind9.Delete();
   ind10.Delete();
   ind11.Delete();
   ind12.Delete();
   ind13.Delete();
   ind14.Delete();
  }
//+------------------------------------------------------------------+
The result is displayed in Fig. 5. This basic template is very easy to configure and change.
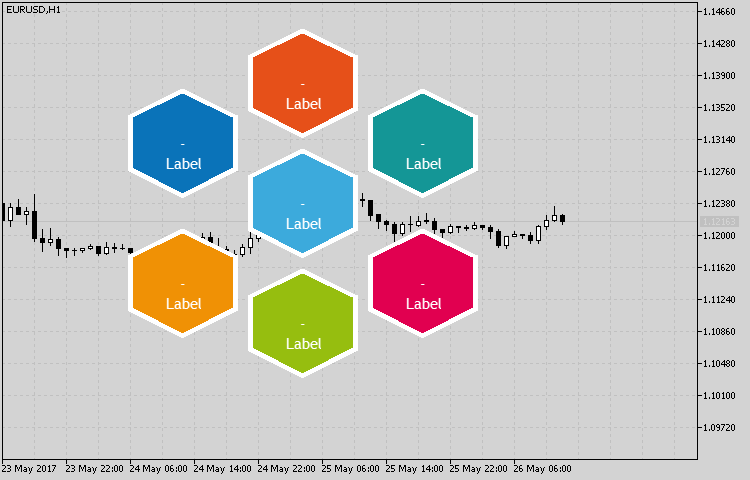
Fig. 5. Sample implementation of the indicator set using the CHexagon class
CPetal class
The implementation of the petal-shaped indicator requires 2-3 primitives from the CCanvas class of methods. These are the filled circle (the FillCircle() method) and, depending on the form, 1-2 filled triangles (FillTriangle()). The structure and set of elements are shown in Fig. 6.
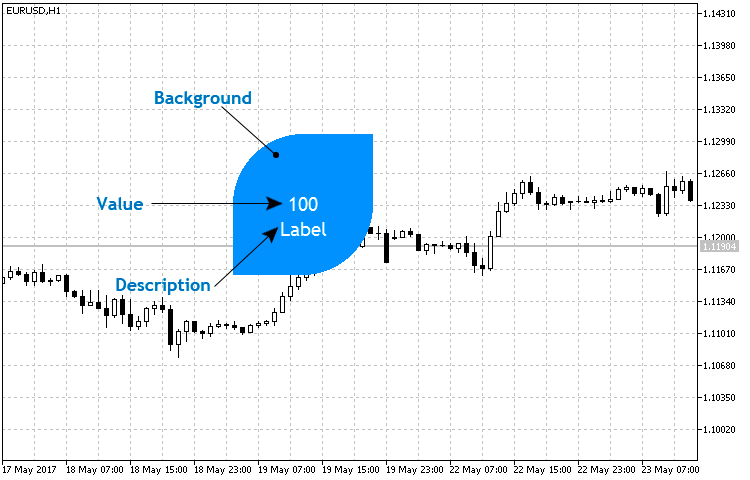
Fig. 6. The basic structure of the petal indicator
As we can see, two triangles are used here but we are going to include several form types to the class using the 'enum' enumeration. Let's consider these types in more detail:
enum ENUM_POSITION
  {
   TOPRIGHT=1,
   TOPLEFT=2,
   BOTTOMRIGHT=3,
   BOTTOMLEFT=4,
   BOTHRIGHT=5,
   BOTHLEFT=6
  };
- TOPRIGHT — consists of a circle and triangle with its visible vertex directed to the upper right corner.
- TOPLEFT — consists of a circle and triangle with its visible vertex directed to the upper left corner.
- BOTTOMRIGHT — consists of a circle and triangle with its visible vertex directed to the lower right corner.
- BOTTOMLEFT — consists of a circle and triangle with its visible vertex directed to the lower left corner.
- BOTHRIGHT — consists of a circle and two triangles. The upper triangle is located in the upper right corner.
- BOTHLEFT— consists of a circle and two triangles. The upper triangle is located in the upper left corner.
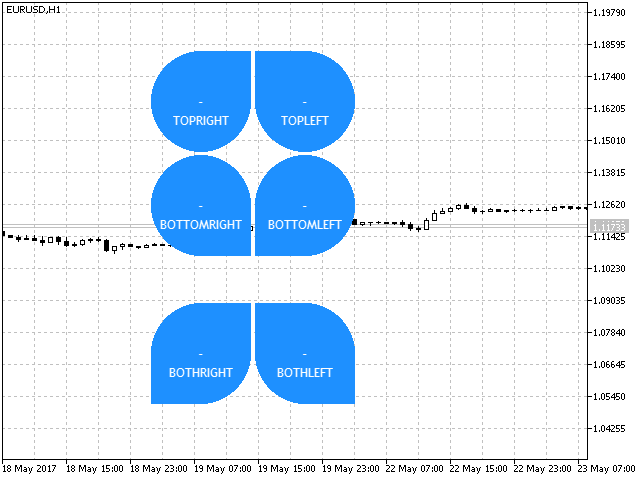
Fig. 7. Petal indicator form types
Let's start implementation. Create the Petal.mqh file in the CustomGUI/Indicators folder, create the СPetal class in the newly generated file and assign the previously created CCanvasBase class as a base one for it. Also, include it to the common list that now looks as follows:
//+------------------------------------------------------------------+
//|                                                    CustomGUI.mqh |
//|                                Copyright 2017, Alexander Fedosov |
//|                           https://www.mql5.com/en/users/alex2356 |
//+------------------------------------------------------------------+
#include "Indicators\CircleSimple.mqh"
#include "Indicators\CircleArc.mqh"
#include "Indicators\CircleSection.mqh"
#include "Indicators\LineGraph.mqh"
#include "Indicators\LineRounded.mqh"
#include "Indicators\Hexagon.mqh"
#include "Indicators\Petal.mqh"
//+------------------------------------------------------------------+
We will not dwell on the standard properties. Let's consider the methods of creating an indicator and updating its values. In the Create() method, after the construction of the filled circle, filled triangles are drawn in the specified positions using the ENUM_POSITION enumeration depending on the previously considered "form type" property:
//+------------------------------------------------------------------+
//| Create the indicator                                             |
//+------------------------------------------------------------------+
void CPetal::Create(string name,int x,int y)
  {
   int r=m_radius;
//--- Modify the indicator location relative to the radius
   x=(x<r)?r:x;
   y=(y<r)?r:y;
   Name(name);
   X(x);
   Y(y);
   XSize(2*r+1);
   YSize(2*r+1);
   if(!CreateCanvas())
      Print("Error. Can not create Canvas.");
//---
   m_canvas.FillCircle(r,r,r,ColorToARGB(m_bg_color,m_transparency));
   if(m_orientation==TOPRIGHT)
      m_canvas.FillTriangle(XSize()/2,0,XSize(),0,XSize(),YSize()/2,ColorToARGB(m_bg_color,m_transparency));
   else if(m_orientation==TOPLEFT)
      m_canvas.FillTriangle(0,0,XSize()/2,0,0,YSize()/2,ColorToARGB(m_bg_color,m_transparency));
   else if(m_orientation==BOTTOMRIGHT)
      m_canvas.FillTriangle(XSize(),YSize(),XSize(),YSize()/2,XSize()/2,YSize(),ColorToARGB(m_bg_color,m_transparency));
   else if(m_orientation==BOTTOMLEFT)
      m_canvas.FillTriangle(0,YSize(),0,YSize()/2,XSize()/2,YSize(),ColorToARGB(m_bg_color,m_transparency));
   else if(m_orientation==BOTHRIGHT)
     {
      m_canvas.FillTriangle(XSize()/2,0,XSize(),0,XSize(),YSize()/2,ColorToARGB(m_bg_color,m_transparency));
      m_canvas.FillTriangle(0,YSize(),0,YSize()/2,XSize()/2,YSize(),ColorToARGB(m_bg_color,m_transparency));
     }
   else if(m_orientation==BOTHLEFT)
     {
      m_canvas.FillTriangle(0,0,XSize()/2,0,0,YSize()/2,ColorToARGB(m_bg_color,m_transparency));
      m_canvas.FillTriangle(XSize(),YSize(),XSize(),YSize()/2,XSize()/2,YSize(),ColorToARGB(m_bg_color,m_transparency));
     }
//--- Description and numerical values
   m_canvas.FontNameSet("Trebuchet MS");
   m_canvas.FontSizeSet(m_value_font_size);
   m_canvas.TextOut(r,r,"-",ColorToARGB(m_value_color,m_transparency),TA_CENTER|TA_VCENTER);
   m_canvas.FontSizeSet(m_label_font_size);
   m_canvas.TextOut(r,r+m_value_font_size,m_label_value,ColorToARGB(m_label_color,m_transparency),TA_CENTER|TA_VCENTER);
   m_canvas.Update();
  }
Let's develop the template for creating a butterfly-shaped indicator as an example.
//+------------------------------------------------------------------+
//|                                                          003.mq5 |
//|                                Copyright 2017, Alexander Fedosov |
//|                           https://www.mql5.com/en/users/alex2356 |
//+------------------------------------------------------------------+
#property version   "1.00"
#property indicator_plots 0
#property indicator_chart_window

#include <CustomGUI\CustomGUI.mqh>
//---
CPetal ind1,ind2,ind3,ind4;
//+------------------------------------------------------------------+
//| Custom indicator initialization function                         |
//+------------------------------------------------------------------+
int OnInit()
  {
   int b=2;
//---
   ind1.BgColor(C'230,80,80');
   ind1.Orientation(BOTHLEFT);
   ind1.Create("petal1",200-b,100-b);

   ind2.BgColor(C'35,170,190');
   ind2.Orientation(BOTHRIGHT);
   ind2.Create("petal2",300+b,100-b);

   ind3.BgColor(C'245,155,70');
   ind3.Orientation(BOTHRIGHT);
   ind3.Create("petal3",200-b,200+b);

   ind4.BgColor(C'90,200,130');
   ind4.Orientation(BOTHLEFT);
   ind4.Create("petal4",300+b,200+b);
   return(INIT_SUCCEEDED);
  }
//+------------------------------------------------------------------+
//| Custom indicator iteration function                              |
//+------------------------------------------------------------------+
int OnCalculate(const int rates_total,
                const int prev_calculated,
                const datetime &time[],
                const double &open[],
                const double &high[],
                const double &low[],
                const double &close[],
                const long &tick_volume[],
                const long &volume[],
                const int &spread[])
  {
//---

//--- return value of prev_calculated for next call
   return(rates_total);
  }
//+------------------------------------------------------------------+
//| Custom indicator deinitialization function                       |
//+------------------------------------------------------------------+
void OnDeinit(const int reason)
  {
   ind1.Delete();
   ind2.Delete();
   ind3.Delete();
   ind4.Delete();
  }
//+------------------------------------------------------------------+
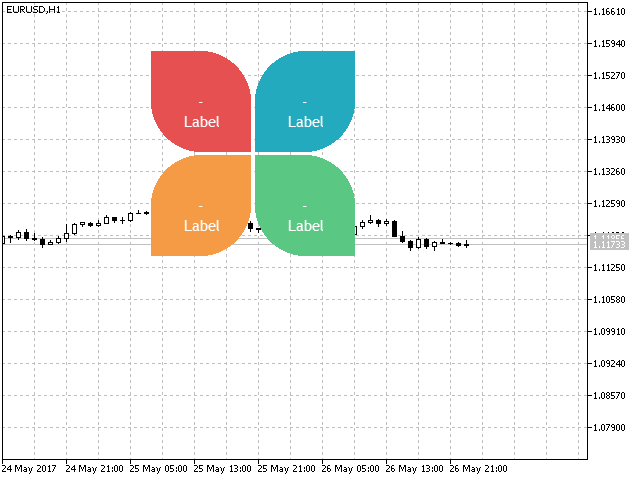
Fig. 8. Using the petal indicator
CHistogram class
The histogram class is based on the CLIneGraph class, or more precisely — the general structure of constructing the coordinate axes, axis scales and their values. Therefore, there is no need to describe this stage. Let's dwell in more details on the types of histograms and the implementation using the CCanvas class primitives. Before moving on to the implementation of the histogram indicator, let's define the form types.
enum ENUM_TYPE_HISTOGRAM
  {
   SIMPLE=1,
   TRIANGLE=2,
   RECTANGLE=3
  };
- SIMPLE — a simple form is based on the triangle-shaped histogram (Fig.10) with its height fixed as a numerical value on the chart.
- TRIANGLE — triangle-shaped histogram of a pseudo-volume type (Fig. 11).
- RECTANGLE — standard histogram type in the form of columns (Fig. 12).
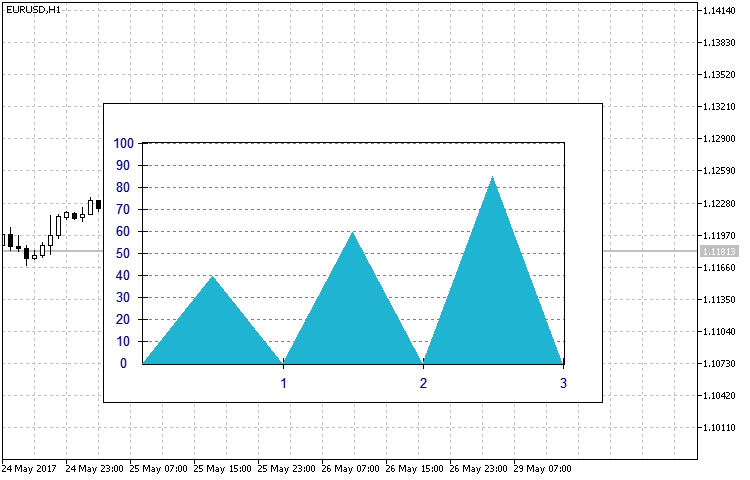
Fig. 10. SIMPLE type histogram
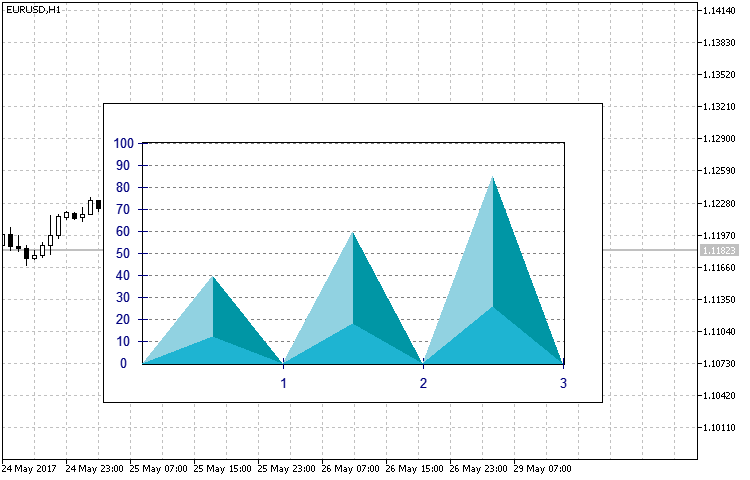
Fig. 11. TRIANGLE type histogram
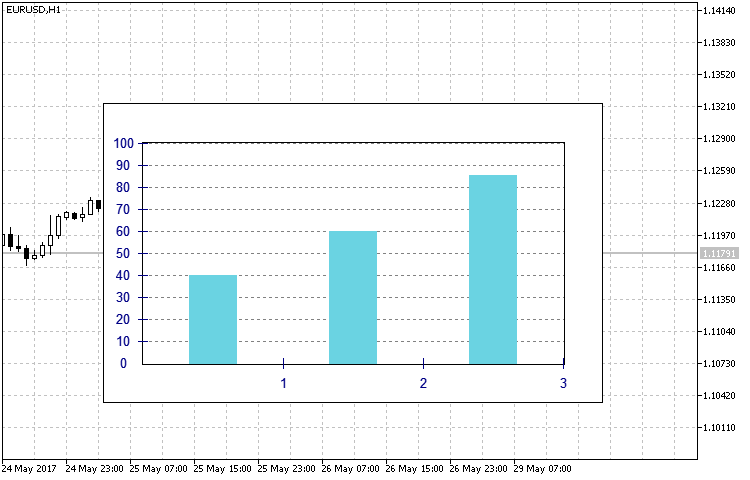
Fig. 12. RECTANGLE type histogram
Create the Histogram.mqh file in the CustomGUI/Indicators folder, create the СHistogram class in the newly generated file and assign the previously created CCanvasBase class as a base one for it. Also, include it to the common list in the CustomGUI.mqh file. Most class methods and properties are similar to the CLineGraph class, including the Create() method. Therefore, let's have a look at the fundamental differences only, namely the SetArrayValue() method.
//+------------------------------------------------------------------+
//| Set the input array                                              |
//+------------------------------------------------------------------+
void CHistogram::SetArrayValue(double &data[])
  {
   int x,y,y1,y2;
//--- Create the graph frame and backdrop
   m_canvas.FillRectangle(0,0,XSize(),YSize(),ColorToARGB(m_border_color,m_transparency));
   m_canvas.FillRectangle(1,1,XSize()-2,YSize()-2,ColorToARGB(m_bg_color,m_transparency));
//--- Create the axes and the graph background
   m_canvas.FillRectangle(m_gap-1,m_gap-1,XSize()-m_gap+1,YSize()-m_gap+1,ColorToARGB(m_border_color,m_transparency));
   m_canvas.FillRectangle(m_gap,m_gap,XSize()-m_gap,YSize()-m_gap,ColorToARGB(m_bg_graph_color,m_transparency));
//--- If the maximum data array value exceeds the upper Y border, the axis is scaled.
   if(data[ArrayMaximum(data)]>m_y_max)
      m_y_max=data[ArrayMaximum(data)];
//--- Create the axis scales and their values
   VerticalScale(m_y_min,m_y_max,m_num_grid);
   HorizontalScale(ArraySize(data));
   ArrayResize(m_label_value,ArraySize(data));
//--- Create the histogram based on the data array
   for(int i=0;i<ArraySize(data);i++)
     {
      if(data[i]>0)
        {
         x=int(m_x[i]+(m_x[i+1]-m_x[i])/2);
         y=int((YSize()-m_gap)-(YSize()-2*m_gap)/m_y_max*data[i]);
         y1=int((YSize()-m_gap)-(YSize()-2*m_gap)/m_y_max*data[i]*0.3);
         y2=int((YSize()-m_gap)-(YSize()-2*m_gap)/m_y_max*data[i]*0.1);
         y=(y<m_gap)?m_gap:y;
         if(m_type==SIMPLE)
            m_canvas.FillTriangle(m_x[i],YSize()-m_gap,m_x[i+1],YSize()-m_gap,x,y,ColorToARGB(m_graph_color1,m_transparency));
         else if(m_type==TRIANGLE)
           {
            m_canvas.FillTriangle(m_x[i],YSize()-m_gap,x,y,x,y1,ColorToARGB(m_graph_color1,m_transparency));
            m_canvas.FillTriangle(m_x[i],YSize()-m_gap,m_x[i+1],YSize()-m_gap,x,y1,ColorToARGB(m_graph_color2,m_transparency));
            m_canvas.FillTriangle(x,y,x,y1,m_x[i+1],YSize()-m_gap,ColorToARGB(m_graph_color3,m_transparency));
           }
         else if(m_type==RECTANGLE)
           {
            int x1,x2;
            x1=int(m_x[i]+(m_x[i+1]-m_x[i])/3);
            x2=int(m_x[i]+2*(m_x[i+1]-m_x[i])/3);
            m_canvas.FillRectangle(x1,y,x2,YSize()-m_gap,ColorToARGB(m_graph_color1,m_transparency));
           }
         //--- Description and numerical values
         m_canvas.FontNameSet("Trebuchet MS");
         m_canvas.FontSizeSet(m_value_font_size);
         m_canvas.TextOut(x,y2,DoubleToString(data[i],2),ColorToARGB(m_value_color,m_transparency),TA_CENTER|TA_VCENTER);
         m_canvas.TextOut(x,y-5,m_label_value[i],ColorToARGB(m_label_color,m_transparency),TA_CENTER|TA_VCENTER);
        }
     }
   m_canvas.Update();
  }
The fundamental difference is that the ENUM_TYPE_HISTOGRAM histogram type described above is considered in the histogram plotting block by the specified data array. The method of visual display of three RSI indicators with different periods has been implemented as a usage example.
//+------------------------------------------------------------------+
//|                                                          004.mq5 |
//|                                Copyright 2017, Alexander Fedosov |
//|                           https://www.mql5.com/en/users/alex2356 |
//+------------------------------------------------------------------+
#property copyright "Copyright 2017, Alexander Fedosov"
#property link      "https://www.mql5.com/en/users/alex2356"
#property version   "1.00"
#property indicator_plots 0
#property indicator_chart_window

#include <CustomGUI\CustomGUI.mqh>
//+------------------------------------------------------------------+
//|  Indicator inputs                                                |
//+------------------------------------------------------------------+

input int                  RSIPeriod1=10;        //Period of the indicator1
input int                  RSIPeriod2=14;        //Period of the indicator2
input int                  RSIPeriod3=18;        //Period of the indicator3
input ENUM_TYPE_HISTOGRAM  Type=RECTANGLE;       //Type Histogram
//---
CHistogram ind;
int InpInd_Handle1,InpInd_Handle2,InpInd_Handle3;
double rsi1[],rsi2[],rsi3[],ex[3];
string descr[3];
//+------------------------------------------------------------------+
//| Custom indicator initialization function                         |
//+------------------------------------------------------------------+
int OnInit()
  {
//---- get the indicator handle
   InpInd_Handle1=iRSI(Symbol(),PERIOD_CURRENT,RSIPeriod1,PRICE_CLOSE);
   InpInd_Handle2=iRSI(Symbol(),PERIOD_CURRENT,RSIPeriod2,PRICE_CLOSE);
   InpInd_Handle3=iRSI(Symbol(),PERIOD_CURRENT,RSIPeriod3,PRICE_CLOSE);
   if(InpInd_Handle1==INVALID_HANDLE ||
      InpInd_Handle2==INVALID_HANDLE ||
      InpInd_Handle3==INVALID_HANDLE
      )
     {
      Print("Failed to get indicator handle");
      return(INIT_FAILED);
     }
//---
   descr[0]="RSI("+IntegerToString(RSIPeriod1)+")";
   descr[1]="RSI("+IntegerToString(RSIPeriod2)+")";
   descr[2]="RSI("+IntegerToString(RSIPeriod3)+")";
   ind.NumGrid(10);
   ind.YMax(100);
   ind.Type(Type);
   ind.Create("rsi",350,250);
   ind.SetArrayLabel(descr);
//---
   ArraySetAsSeries(rsi1,true);
   ArraySetAsSeries(rsi2,true);
   ArraySetAsSeries(rsi3,true);
//---
   return(INIT_SUCCEEDED);
  }
//+------------------------------------------------------------------+
//| Custom indicator iteration function                              |
//+------------------------------------------------------------------+
int OnCalculate(const int rates_total,
                const int prev_calculated,
                const datetime &time[],
                const double &open[],
                const double &high[],
                const double &low[],
                const double &close[],
                const long &tick_volume[],
                const long &volume[],
                const int &spread[])
  {
//---
   if(CopyBuffer(InpInd_Handle1,0,0,1,rsi1)<=0   ||
      CopyBuffer(InpInd_Handle2,0,0,1,rsi2)<=0   ||
      CopyBuffer(InpInd_Handle3,0,0,1,rsi3)<=0
      )
      return(0);
   ex[0]=rsi1[0];
   ex[1]=rsi2[0];
   ex[2]=rsi3[0];
   ind.SetArrayValue(ex);
//--- return value of prev_calculated for next call
   return(rates_total);
  }
//+------------------------------------------------------------------+
//| Custom indicator deinitialization function                       |
//+------------------------------------------------------------------+
void OnDeinit(const int reason)
  {
   ind.Delete();
   ChartRedraw();
  }
//+------------------------------------------------------------------+
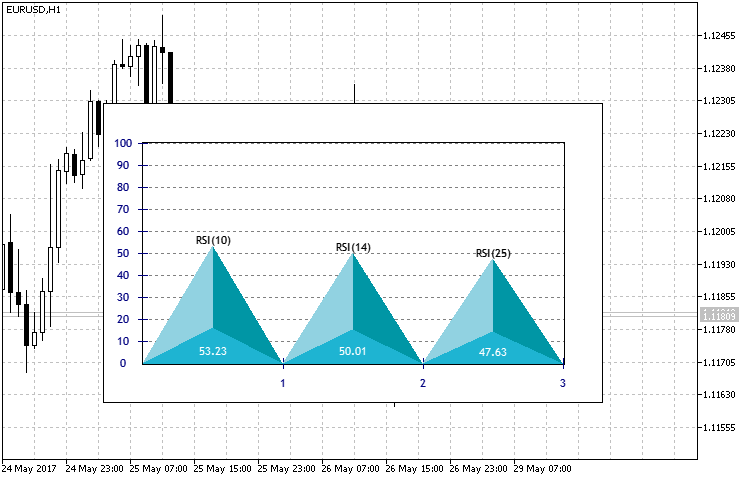
Fig. 13. Result of the indicator in the form of a histogram of three RSI periods
CPyramid class
We have examined the classes and principles of constructing complex shapes using primitives. While describing the class for constructing histogram-type indicators, I have mentioned plotting pseudo-3D objects (Fig. 13) by means of color selection. However, the pyramid is not a flat figure. Therefore, we have to use its isometric projection in a given two-dimensional coordinate system. The basic structure does not contain too many elements (Fig.14), but the method of the pyramid projection and visualization is the main part of the class implementation.
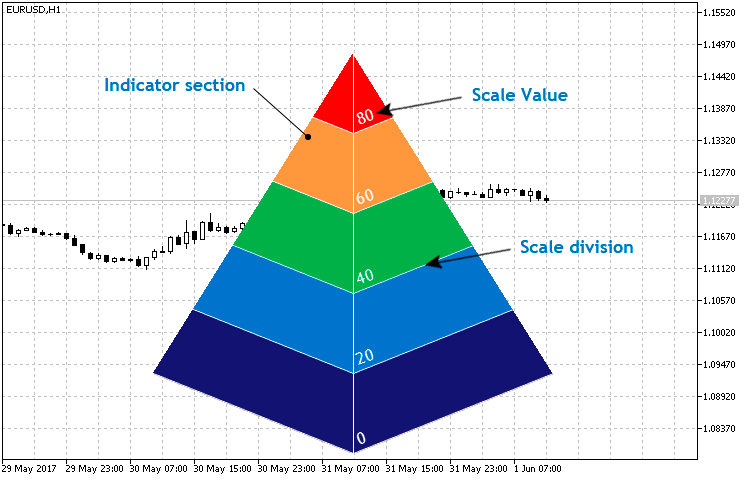
Fig. 14. Basic structure of the CPyramid class
Create the Pyramid.mqh file in the CustomGUI/Indicators folder, create the СPyramid class in the newly generated file and assign the previously created CCanvasBase class as a base one for it. Also, include it to the common list in the CustomGUI.mqh file. Now, the general list of included classes looks as follows:
//+------------------------------------------------------------------+
//|                                                    CustomGUI.mqh |
//+------------------------------------------------------------------+
#include "Indicators\CircleSimple.mqh"
#include "Indicators\CircleArc.mqh"
#include "Indicators\CircleSection.mqh"
#include "Indicators\LineGraph.mqh"
#include "Indicators\LineRounded.mqh"
#include "Indicators\Hexagon.mqh"
#include "Indicators\Petal.mqh"
#include "Indicators\Histogram.mqh"
#include "Indicators\Pyramid.mqh"
//+------------------------------------------------------------------+
You can find the full list of properties and methods in the class itself. Let's focus on the key ones. Before considering the basic Create() and NewValue() methods, we will dwell on the private methods used in it.
//+------------------------------------------------------------------+
//| Write two-point straight-line equation ratios to the array       |
//+------------------------------------------------------------------+
void CPyramid::Equation(double x1,double y1,double x2,double y2,double &arr[])
  {
   ArrayResize(arr,2);
   arr[0]=(y1-y2)/(x1-x2);
   arr[1]=y2-arr[0]*x2;
  }
The Equation() method is used to find the two-point straight-line equation. In particular, it defines the k and b ratios for the general equation y = kx + b from the conventional two-point straight-line equation:
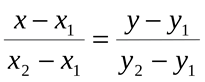
This method is used to further define the straight-line equations by specified points to find the crossing points of the AB and AC pyramid edges and straight lines parallel to the pyramid's base lines. The coordinates of the points shown in Fig. 15 are necessary for constructing triangles similar to the side faces of the pyramid. In turn, they are sections of our indicator.
Fig. 15. Crossing points of the pyramid edges and straight lines parallel to the pyramid's base lines
Knowing the ratios of the two straight lines, let's calculate the crossing point coordinates using a system of equations. The Cross() method is used for that:
//+---------------------------------------------------------------------------------+
//| Write the coordinates of the two straight lines crossing point by their ratio   |
//+---------------------------------------------------------------------------------+
void CPyramid::Cross(double k1,double b1,double k2,double b2,double &arr[])
  {
   double x,y;
   ArrayResize(arr,2);
   y=(b1*k2-b2*k1)/(k2-k1);
   x=(y-b2)/k2;
   arr[0]=x;
   arr[1]=y;
  }
//+------------------------------------------------------------------+
Now, that we know the functions used in plotting the pyramid we can fully focus on the Create() method.
//+------------------------------------------------------------------+
//| Create the indicator                                             |
//+------------------------------------------------------------------+
void CPyramid::Create(string name,int x,int y)
  {
   int size=m_size;
//--- Modify the indicator location relative to its size
   x=(x<size/2)?size/2:x;
   y=(y<size/2)?size/2:y;
   Name(name);
   X(x);
   Y(y);
   XSize(size);
   YSize(size);
   if(!CreateCanvas())
      Print("Error. Can not create Canvas.");
//--- Description and numerical values
   m_canvas.FontNameSet("Trebuchet MS");
   m_canvas.FontSizeSet(m_font_size);
   m_canvas.FontAngleSet(200);
//--- Find the AB straight line equation
   double x1,x2,y1,y2;
   x1=XSize()/2;y1=0;
   x2=0;y2=4*YSize()/5;
   Equation(x1,y1,x2,y2,m_line1);
//--- Construct the indicator's left sections
   for(int i=5;i>0;i--)
     {
      //--- Define the ordinates of two points
      y1=i*YSize()/5;
      y2=(i-1)*YSize()/5;
      Equation(x1,y1,x2,y2,m_line2);
      //--- Define the coordinates of the crossing point between the AB edge and a straight line parallel to the pyramid base side
      Cross(m_line1[0],m_line1[1],m_line2[0],m_line2[1],m_cross);
      m_canvas.FillTriangle(int(x1),0,int(x1),int(y1),int(m_cross[0]),int(m_cross[1]),ColorToARGB(m_section_color[i-1],m_transparency));
      //--- Plot the scale marks
      m_canvas.LineAA(int(x1),int(y1),int(m_cross[0]),int(m_cross[1]),ColorToARGB(m_scale_color,m_transparency));
     }
//--- Find the AC straight line equation
   x1=XSize()/2;y1=0;
   x2=XSize();y2=4*YSize()/5;
   Equation(x1,y1,x2,y2,m_line1);
//--- Construct the indicator's right sections
   for(int i=5;i>0;i--)
     {
      //--- Define the ordinates of two points
      y1=i*YSize()/5;
      y2=(i-1)*YSize()/5;
      Equation(x1,y1,x2,y2,m_line2);
      //--- Define the coordinates of the crossing point between the AC edge and a straight line parallel to the pyramid base side
      Cross(m_line1[0],m_line1[1],m_line2[0],m_line2[1],m_cross);
      m_canvas.FillTriangle(int(x1),0,int(x1),int(y1),int(m_cross[0]),int(m_cross[1]),ColorToARGB(m_section_color[i-1]));
      //--- Plot the scale marks
      m_canvas.LineAA(int(x1),int(y1),int(m_cross[0]),int(m_cross[1]),ColorToARGB(m_scale_color,m_transparency));
      //--- Plot the scale values
      m_canvas.TextOut(int(x1+2),int(y2+YSize()/6)," - ",ColorToARGB(m_label_color,m_transparency),TA_LEFT|TA_VCENTER);
     }
   m_canvas.LineVertical(XSize()/2,0,YSize(),ColorToARGB(m_scale_color,m_transparency));
   m_canvas.Update();
  }
The pyramid construction algorithm is as follows:
- Build the left side of the pyramid. Define A and B points coordinates and use them to find the straight-line equation.
- Then, find the straight-line equations parallel to the pyramid base sides and the point of their crossing with the AB edge consequently in the cycle.
- Use the obtained points to build sections and scale marks (divisions).
- Construct the right side of the pyramid in a similar way.
- Apart from sections and scale marks, add the scale values on the right side.
- Vertical separation of two sections.
The method of setting and updating data features the two arguments: the current passed and maximum values. The essence of the method: Define the threshold values based on the maximum set value. When passing them, each section changes its color. When exceeding the threshold value, the section receives a specified color. When the value is crossed downwards, the section receives the color set as inactive.
//+------------------------------------------------------------------+
//| Set and update the indicator value                               |
//+------------------------------------------------------------------+
void CPyramid::NewValue(double value,double maxvalue)
  {
//---
   double s;
   color col;
//--- Find the AB straight-line equation
   double x1,x2,y1,y2;
   x1=XSize()/2;y1=0;
   x2=0;y2=4*YSize()/5;
   Equation(x1,y1,x2,y2,m_line1);
//--- Construct the indicator's left sections
   for(int i=5;i>0;i--)
     {
      //--- Find the scale mark values
      s=maxvalue-(i-1)*maxvalue/5;
      //--- Define the section color
      col=(value>=s)?m_section_color[i-1]:m_bg_color;
      //--- Define the ordinates of two points
      y1=i*YSize()/5;
      y2=(i-1)*YSize()/5;
      Equation(x1,y1,x2,y2,m_line2);
      //--- Define the coordinates of the crossing point between the AB edge and a straight line parallel to the pyramid base side
      Cross(m_line1[0],m_line1[1],m_line2[0],m_line2[1],m_cross);
      m_canvas.FillTriangle(int(x1),0,int(x1),int(y1),int(m_cross[0]),int(m_cross[1]),ColorToARGB(m_section_color[i-1],m_transparency));
      m_canvas.FillTriangle(int(x1),0,int(x1),int(y1),int(m_cross[0]),int(m_cross[1]),ColorToARGB(col,m_transparency));
      //--- Plot the scale marks
      m_canvas.LineAA(int(x1),int(y1),int(m_cross[0]),int(m_cross[1]),ColorToARGB(clrWhite));
     }
//--- Find the AC straight-line equation
   x1=XSize()/2;y1=0;
   x2=XSize();y2=4*YSize()/5;
   Equation(x1,y1,x2,y2,m_line1);
//--- Construct the indicator's right sections
   for(int i=5;i>0;i--)
     {
      //--- Find the scale mark values
      s=maxvalue-(i-1)*maxvalue/5;
      //--- Define the section color
      col=(value>=s)?m_section_color[i-1]:m_bg_color;
      //--- Define the ordinates of two points
      y1=i*YSize()/5;
      y2=(i-1)*YSize()/5;
      Equation(x1,y1,x2,y2,m_line2);
      //--- Define the coordinates of the crossing point between the AC edge and a straight line parallel to the pyramid base side
      Cross(m_line1[0],m_line1[1],m_line2[0],m_line2[1],m_cross);
      m_canvas.FillTriangle(int(x1),0,int(x1),int(y1),int(m_cross[0]),int(m_cross[1]),ColorToARGB(m_section_color[i-1],m_transparency));
      m_canvas.FillTriangle(int(x1),0,int(x1),int(y1),int(m_cross[0]),int(m_cross[1]),ColorToARGB(col,m_transparency));
      //--- Define the scale marks
      m_canvas.LineAA(int(x1),int(y1),int(m_cross[0]),int(m_cross[1]),ColorToARGB(m_scale_color,m_transparency));
      //--- Plot the scale values
      m_canvas.TextOut(int(x1+2),int(y2+YSize()/6),DoubleToString(s,0),ColorToARGB(m_label_color,m_transparency),TA_LEFT|TA_VCENTER);
     }
   m_canvas.LineVertical(XSize()/2,0,YSize(),ColorToARGB(m_scale_color,m_transparency));
   m_canvas.Update();
  }
Despite the more complex implementation of the indicator's rendering, its creation, setup and application are not more difficult as compared to the previous ones. Let's apply it for displaying standard ADX values as a small example. Depending on the indicator location, add the circular indicator in the upper left for comparison and visibility.
//+------------------------------------------------------------------+
//|                                                          005.mq5 |
//|                                Copyright 2017, Alexander Fedosov |
//|                           https://www.mql5.com/en/users/alex2356 |
//+------------------------------------------------------------------+
#property copyright "Copyright 2017, Alexander Fedosov"
#property link      "https://www.mql5.com/en/users/alex2356"
#property version   "1.00"
#property indicator_plots 0
#property indicator_chart_window

#include <CustomGUI\CustomGUI.mqh>
//+------------------------------------------------------------------+
//|  Indicator inputs                                                |
//+------------------------------------------------------------------+
input int               period=10;                                //ADX Period
input double            maxval=50;                                //Max value
//---
CPyramid ind1;
CCircleSimple ind2;
int InpInd_Handle;
double adx[];
//+------------------------------------------------------------------+
//| Custom indicator initialization function                         |
//+------------------------------------------------------------------+
int OnInit()
  {
//---- get the indicator handle
   InpInd_Handle=iADX(Symbol(),PERIOD_CURRENT,period);
   if(InpInd_Handle==INVALID_HANDLE)
     {
      Print("Failed to get indicator handle");
      return(INIT_FAILED);
     }
   ArraySetAsSeries(adx,true);
//---
   ind1.Size(250);
   ind1.Create("pyramid",200,0);
//---
   ind2.FontSize(ind1.FontSize());
   ind2.LabelSize(ind1.FontSize());
   ind2.Label("ADX");
   ind2.Radius(30);
   ind2.Create("label",ind1.X()-ind1.Size()/3,ind1.Y()-ind1.Size()/4);
   return(INIT_SUCCEEDED);
  }
//+------------------------------------------------------------------+
//| Custom indicator iteration function                              |
//+------------------------------------------------------------------+
int OnCalculate(const int rates_total,
                const int prev_calculated,
                const datetime &time[],
                const double &open[],
                const double &high[],
                const double &low[],
                const double &close[],
                const long &tick_volume[],
                const long &volume[],
                const int &spread[])
  {
//---
   if(CopyBuffer(InpInd_Handle,0,0,2,adx)<=0)
      return(0);
   ind1.NewValue(adx[0],maxval);
   ind2.NewValue(adx[0]);
//--- return value of prev_calculated for next call
   return(rates_total);
  }
//+------------------------------------------------------------------+
//| Custom indicator deinitialization function                       |
//+------------------------------------------------------------------+
void OnDeinit(const int reason)
  {
   ind1.Delete();
   ind2.Delete();
   ChartRedraw();
  }
//+------------------------------------------------------------------+
As we can see in the Fig. 16, the circular indicator displays the value above the third threshold of 30, therefore, three sections are colored at the current maximum value, which in this case is set to 50.
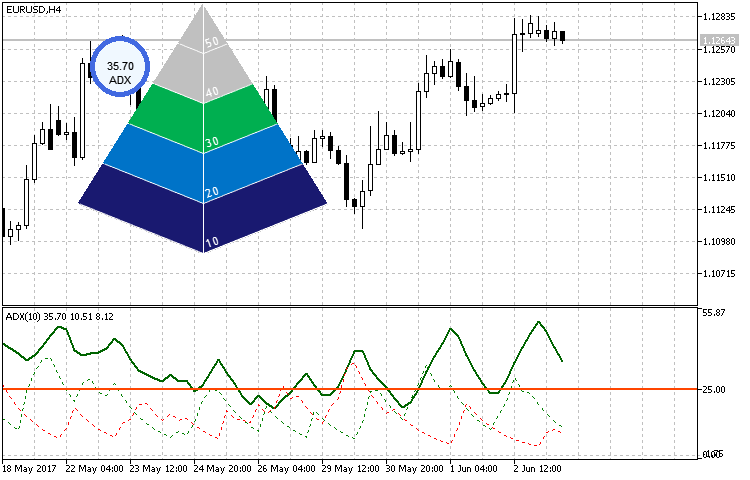
Fig. 16. Using a pyramid-shaped indicator
Conclusion
Implementation of the CCanvas-based classes proves that the library capabilities are quite extensive in terms of graphics. Types and ways of displaying this type of indicators are limited only by imagination. The creation and arrangement of such indicators in the form of a library of include classes does not require special knowledge or effort.
The attached archive contains all the files applied in the article, which are located in the appropriate folders. For correct operation, place the MQL5 folder to the terminal's root directory from the archive.
Archived programs used in the article:
| # | Name | Type | Description |
|---|---|---|---|
| 1 | CanvasBase.mqh | Library | Base custom graphics class |
| 2 | CustomGUI.mqh | Library | File of all the library classes include list |
| 3 | CircleArc.mqh | Library | Contains the CCircleArc indicator class |
| 4 | CircleSection.mqh | Library | Contains the CCircleSection indicator class |
| 5 | CircleSimple.mqh | Library | Contains the CCircleSimle indicator class |
| 6 | LineGraph.mqh | Library | Contains the CLineGraph linear graph class |
| 7 | LineRounded.mqh | Library | Contains the CLineRounded rounded linear indicator class |
| 8 | Hexagon.mqh | Library | Contains CHexagon hexagonal indicator class |
| 9 | Petal.mqh | Library | Contains the CPetal petal indicator class |
| 10 | Histogram.mqh | Library | Contains the CHistogram histogram indicator class |
| 11 | Pyramid.mqh | Library | Contains the CPyramid pyramid indicator class |
| 12 | CLineRounded.mq5 | Indicator | Sample implementation of the CLineRounded class |
| 13 | CHexagon.mq5 | Indicator | Sample implementation of the CHexagon class |
| 14 | CPetal.mq5 | Indicator | Sample implementation of the CPetal class |
| 15 | CHistogram.mq5 | Indicator | Sample implementation of the CHistogram class |
| 16 | CPyramid.mq5 | Indicator | Sample implementation of the CPyramid class |
Translated from Russian by MetaQuotes Ltd.
Original article: https://www.mql5.com/ru/articles/3298
Warning: All rights to these materials are reserved by MetaQuotes Ltd. Copying or reprinting of these materials in whole or in part is prohibited.
This article was written by a user of the site and reflects their personal views. MetaQuotes Ltd is not responsible for the accuracy of the information presented, nor for any consequences resulting from the use of the solutions, strategies or recommendations described.

 Creating Documentation Based on MQL5 Source Code
 Cross-Platform Expert Advisor: Time Filters
- Free trading apps
- Over 8,000 signals for copying
- Economic news for exploring financial markets
You agree to website policy and terms of use
I must have been the one updating the code and attachments. :)
Half a day and all night?
Half a day and all night?
Hello Sir.
Thank you for the explanation very interresting.
Can we do the same work for MT4 sir ?!
Best regards.
Achref Sayadi.
It looks interesting, I'll keep it to read it later, greetings.
i see nice to try,