
Developing custom indicators using CCanvas class

Contents
Introduction
Custom indicators form an integral part of modern MetaTrader 5 trading. They are used both in automated trading systems (as part of the algorithms) and in manual trading. By now, it has been possible to set a drawing style and apply 18 types of graphical plotting when developing an indicator. But the platform features broader graphical capabilities. The CCanvas custom graphics library allows developing custom non-standard indicators with infinite visualization capabilities. This article introduces readers to the library features and provides examples of its application. A separate library of custom indicators is developed as well.
Developing a base custom graphics class
To develop a base class, we need to write a set of methods creating the foundation of any custom graphics object and including a common set of properties. To do this, create the CanvasBase.mqh file in the CustomGUI folder of the <data folder>\MQL5\Include directory. This file will contain the CCanvasBase base class for all future types of custom graphics.
//+------------------------------------------------------------------+
//|                                                  CCanvasBase.mqh |
//|                                Copyright 2017, Alexander Fedosov |
//|                           https://www.mql5.com/en/users/alex2356 |
//+------------------------------------------------------------------+
#include <Canvas\Canvas.mqh>
//+------------------------------------------------------------------+
//| Base class for custom graphics development                       |
//+------------------------------------------------------------------+
class CCanvasBase
  {
private:
   //--- Canvas name
   string            m_canvas_name;
   //--- Canvas coordinates
   int               m_x;
   int               m_y;
   //--- Canvas size
   int               m_x_size;
   int               m_y_size;
protected:
   CCanvas           m_canvas;
   //--- Create the graphical resource for the object
   bool              CreateCanvas(void);
   //--- Delete the graphical resource
   bool              DeleteCanvas(void);
public:
                     CCanvasBase(void);
                    ~CCanvasBase(void);
   //--- Set and get coordinates
   void              X(const int x)                         { m_x=x;                      }
   void              Y(const int y)                         { m_y=y;                      }
   int               X(void)                                { return(m_x);                }
   int               Y(void)                                { return(m_y);                }
   //--- Set and get size
   void              XSize(const int x_size)                { m_x_size=x_size;            }
   void              YSize(const int y_size)                { m_y_size=y_size;            }
   int               XSize(void)                            { return(m_x_size);           }
   int               YSize(void)                            { return(m_y_size);           }
   //--- Set the indicator name when creating
   void              Name(const string canvas_name) { m_canvas_name=canvas_name;  }
  };
//+------------------------------------------------------------------+
//| Constructor                                                      |
//+------------------------------------------------------------------+
CCanvasBase::CCanvasBase(void) : m_x(0),
                                 m_y(0),
                                 m_x_size(200),
                                 m_y_size(200)
  {
  }
//+------------------------------------------------------------------+
//| Destructor                                                       |
//+------------------------------------------------------------------+
CCanvasBase::~CCanvasBase(void)
  {
  }
//+------------------------------------------------------------------+
//| Create the graphical resource for an object                      |
//+------------------------------------------------------------------+
bool CCanvasBase::CreateCanvas(void)
  {
   ObjectDelete(0,m_canvas_name);
   if(!m_canvas.CreateBitmapLabel(m_canvas_name,m_x,m_y,m_x_size,m_y_size,COLOR_FORMAT_ARGB_NORMALIZE))
      return(false);
   ObjectSetInteger(0,m_canvas_name,OBJPROP_CORNER,CORNER_LEFT_UPPER);
   ObjectSetInteger(0,m_canvas_name,OBJPROP_ANCHOR,ANCHOR_CENTER);
   ObjectSetInteger(0,m_canvas_name,OBJPROP_BACK,false);
   return(true);
  }
//+------------------------------------------------------------------+
//| Delete the graphical resource                                    |
//+------------------------------------------------------------------+
bool CCanvasBase::DeleteCanvas()
  {
   return(ObjectDelete(0,m_canvas_name)?true:false);
  }
//+------------------------------------------------------------------+
As we can see, the initial object coordinates, name and size are complemented with the graphical resource creation and deletion methods that form the foundation (canvas) the custom graphics elements are plotted on. Further on, CreateCanvas() and DeleteCanvas() methods are to be applied during the initial construction of any graphical object at all times. Therefore, the variables used in these methods should be initialized, like it is done in the constructor.
CCircleSimple class
Let's use the "simple-to-complex basis" in order to grasp the principles of developing custom graphics. First, we are going to develop a simple circular indicator featuring a frame, numerical value and description. The Fig. 1 shows the structure of the basic elements.
- Frame (border). An outlined edging.
- Background. The space the text elements are located in.
- Value. A text element displaying a numerical value.
- Description. Indicator description text (name, period and other distinctive information).
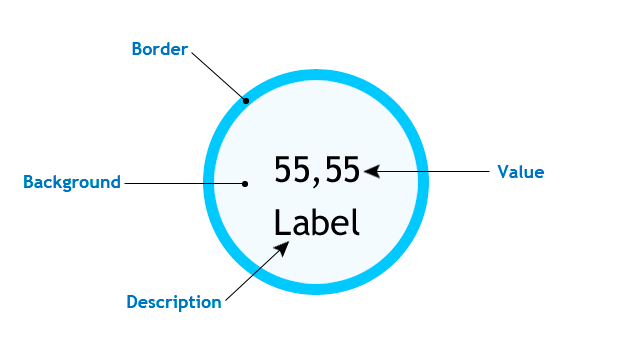
Fig. 1. Basic structure of the simple circular indicator
Let's create yet another folder and name it Indicator in the previously created CustomGUI one. The folder is to contain all classes of future indicators. Create the first one named CircleSimple.mqh. First, we need to include the previously created CanvaseBase.mqh file to the base class for all types of graphical objects and make the CCanvaseBase class basic for the current one, so that all methods of the class are available for the current CCircleSimple.
//+------------------------------------------------------------------+
//|                                                 CircleSimple.mqh |
//|                                Copyright 2017, Alexander Fedosov |
//|                           https://www.mql5.com/en/users/alex2356 |
//+------------------------------------------------------------------+
#include "..\CanvasBase.mqh"
//+------------------------------------------------------------------+
//| Circular indicator with numerical value and description          |
//+------------------------------------------------------------------+
class CCircleSimple : public CCanvasBase
In order not to enter graphical objects manually every time we need them in EA and indicator files, let's create CustomGUI.mqh file in the CustomGUI folder. The file is to contain all inclusions of classes from the Indicators folder. Thus, we need to include only this file to access all library classes. Now, let's include the current one:
//+------------------------------------------------------------------+
//|                                                    CustomGUI.mqh |
//|                                Copyright 2017, Alexander Fedosov |
//|                           https://www.mql5.com/en/users/alex2356 |
//+------------------------------------------------------------------+
#include "Indicators\CircleSimple.mqh"
When implementing the simple circular indicator class, it is also necessary to carefully consider the set of properties and methods providing the ability to set this seemingly simple graphical indicator pattern. The listing below contains the set:
//+------------------------------------------------------------------+
//| Circular indicator with numerical value and description          |
//+------------------------------------------------------------------+
class CCircleSimple : public CCanvasBase
  {
private:
   //--- Background color
   color             m_bg_color;
   //--- Frame color
   color             m_border_color;
   //--- Value text color
   color             m_font_color;
   //--- Label text color
   color             m_label_color;
   //--- Transparency
   uchar             m_transparency;
   //--- Frame width
   int               m_border;
   //--- Indicator size
   int               m_radius;
   //--- Value font size
   int               m_font_size;
   //--- Label font size
   int               m_label_font_size;
   //---
   int               m_digits;
   //--- Label
   string            m_label;
public:
                     CCircleSimple(void);
                    ~CCircleSimple(void);
   //--- Set and get background color
   color             Color(void)                      { return(m_bg_color);            }
   void              Color(const color clr)           { m_bg_color=clr;                }
   //--- Set and get size
   int               Radius(void)                     { return(m_radius);              }
   void              Radius(const int r)              { m_radius=r;                    }
   //--- Set and get value font size
   int               FontSize(void)                   { return(m_font_size);           }
   void              FontSize(const int fontsize)     { m_font_size=fontsize;          }
   //--- Set and get label font size
   int               LabelSize(void)                  { return(m_label_font_size);    }
   void              LabelSize(const int fontsize)    { m_label_font_size=fontsize;   }
   //--- Set and get value font color
   color             FontColor(void)                  { return(m_font_color);          }
   void              FontColor(const color fontcolor) { m_font_color=fontcolor;        }
   //--- Set and get label font color
   color             LabelColor(void)                 { return(m_label_color);         }
   void              LabelColor(const color fontcolor){ m_label_color=fontcolor;       }
   //--- Set frame color and width
   void              BorderColor(const color clr)     { m_border_color=clr;            }
   void              BorderSize(const int border)     { m_border=border;               }
   //--- Set and get transparency
   uchar             Alpha(void)                      { return(m_transparency);        }
   void              Alpha(const uchar alpha)         { m_transparency=alpha;          }
   //--- Set and get label value
   string            Label(void)                      { return(m_label);               }
   void              Label(const string label)        { m_label=label;                 }
   //--- Create the indicator
   void              Create(string name,int x,int y);
   //--- Remove the indicator
   void              Delete(string name);
   //--- Set and get the indicator value
   void              NewValue(int value);
   void              NewValue(double value);
  };
The purpose of the variables and methods they are used in can be seen from the description. Let's consider in details the methods implementing the plotting of the indicator in the form, in which it is presented in Fig. 1. The first method we are going to consider is CreateCanvas(). As we can see in the listing, it has only three arguments. I found them the most important. Providing additional arguments is redundant, since this complicates the method implementation. Therefore, all other properties are put into separate methods. Consequently, all variables are initialized in the class constructor:
//+------------------------------------------------------------------+
//| Constructor                                                      |
//+------------------------------------------------------------------+
CCircleSimple::CCircleSimple(void) : m_bg_color(clrAliceBlue),
                                     m_border_color(clrRoyalBlue),
                                     m_font_color(clrBlack),
                                     m_label_color(clrBlack),
                                     m_transparency(255),
                                     m_border(5),
                                     m_radius(40),
                                     m_font_size(17),
                                     m_label_font_size(20),
                                     m_digits(2),
                                     m_label("label")
  {
  }
This is convenient because when you create an indicator of that type, you just need to create an instance of its class and use the CreateCanvas () method only. Before creating, you can specify only the properties you want to change. When constructing complex graphical objects using the CCanvas library, keep in mind that methods implementing primitives are drawn sequentially and in layers. This has much in common with an actual canvas. First, artists usually draw a background, then they portray objects which in turn are followed by details, etc.
//+------------------------------------------------------------------+
//| Create the indicator                                             |
//+------------------------------------------------------------------+
void CCircleSimple::Create(string name,int x,int y)
  {
   int r=m_radius;
//--- Modify the indicator location relative to the radius
   x=(x<r)?r:x;
   y=(y<r)?r:y;
   Name(name);
   X(x);
   Y(y);
   XSize(2*r+1);
   YSize(2*r+1);
   if(!CreateCanvas())
      Print("Error. Can not create Canvas.");
   if(m_border>0)
      m_canvas.FillCircle(r,r,r,ColorToARGB(m_border_color,m_transparency));
   m_canvas.FillCircle(r,r,r-m_border,ColorToARGB(m_bg_color,m_transparency));
//---
   m_canvas.FontSizeSet(m_font_size);
   m_canvas.TextOut(r,r,"0",ColorToARGB(m_font_color,m_transparency),TA_CENTER|TA_VCENTER);
//---
   m_canvas.FontSizeSet(m_label_font_size);
   m_canvas.TextOut(r,r+m_label_font_size,m_label,ColorToARGB(m_label_color,m_transparency),TA_CENTER|TA_VCENTER);
   m_canvas.Update();
  }
We will not dwell on the method implementation details. Let's highlight some basics only:
- First, adjust the location of the graphical resource relative to the actual indicator size, so that it does not go beyond the main chart.
- Then, use the setting and work with the name, size and coordinate methods. The foundation is created from the CCanvasBase base class.
- When implementing the frame, we used the superimposing principle described above. In particular, we have created the two circles: the first one (filled) and the second one with its radius lesser than the first circle's one by the value of the frame width.
- Numerical value and description elements are created above these objects.
Next, let's consider the NewValue() method that implements the display of the indicator's numerical value updating in real time:
//+------------------------------------------------------------------+
//| Set and update the indicator value                               |
//+------------------------------------------------------------------+
void CCircleSimple::NewValue(int value)
  {
   int r=m_radius;
   m_canvas.FillCircle(r,r,r-m_border,ColorToARGB(m_bg_color,m_transparency));
//---
   m_canvas.FontSizeSet(m_font_size);
   m_canvas.TextOut(r,r,IntegerToString(value),ColorToARGB(m_font_color,m_transparency),TA_CENTER|TA_VCENTER);
//---
   m_canvas.FontSizeSet(m_label_font_size);
   m_canvas.TextOut(r,r+m_label_font_size,m_label,ColorToARGB(m_label_color,m_transparency),TA_CENTER|TA_VCENTER);
   m_canvas.Update();
  }
In order for the indicator's numerical value to update correctly, we need to re-draw the three objects (background and text elements) in the same order as when creating them. Therefore, the background is re-drawn in the NewValue() method followed by value and description text elements.
Now, it is time to check the implementation of the circular indicator in the MetaTrader 5 terminal. To do this, let's create an empty indicator, include the CustomGUI.mqh file in it and create two instances of the CCircleSimple class:
//+------------------------------------------------------------------+
//|                                              CustomIndicator.mq5 |
//|                                Copyright 2017, Alexander Fedosov |
//|                           https://www.mql5.com/en/users/alex2356 |
//+------------------------------------------------------------------+
#property copyright "Copyright 2017, Alexander Fedosov"
#property link      "https://www.mql5.com/en/users/alex2356"
#property version   "1.00"
#property indicator_plots 0
#property indicator_chart_window

#include <CustomGUI\CustomGUI.mqh>
//---
CCircleSimple ind1,ind2;
Then, in the indicator initialization, take the standard indicators having the values that are to be used in circular indicators:
//---
int InpInd_Handle,InpInd_Handle1;
double adx[],rsi[];
//+------------------------------------------------------------------+
//| Custom indicator initialization function                         |
//+------------------------------------------------------------------+
int OnInit()
  {

//---- get the indicator handle
   InpInd_Handle=iADX(Symbol(),PERIOD_CURRENT,10);
   InpInd_Handle1=iRSI(Symbol(),PERIOD_CURRENT,10,PRICE_CLOSE);
   if(InpInd_Handle==INVALID_HANDLE)
     {
      Print("Failed to get indicator handle");
      return(INIT_FAILED);
     }
   ArraySetAsSeries(adx,true);
   ArraySetAsSeries(rsi,true);
Let's define some properties of circular indicators for illustrative purposes and create them:
//---
   ind1.Radius(60);
   ind1.Label("ADX");
   ind1.Color(clrWhiteSmoke);
   ind1.LabelColor(clrBlueViolet);
   ind1.Create("adx",100,100);
//---
   ind2.Radius(55);
   ind2.BorderSize(8);
   ind2.FontSize(22);
   ind2.LabelColor(clrCrimson);
   ind2.BorderColor(clrFireBrick);
   ind2.Label("RSI");
   ind2.Create("rsi",250,100);
Now, we only need to enter the current numerical values of standard indicators into the created ones in the indicator's calculation part:
int OnCalculate(const int rates_total,
                const int prev_calculated,
                const datetime &time[],
                const double &open[],
                const double &high[],
                const double &low[],
                const double &close[],
                const long &tick_volume[],
                const long &volume[],
                const int &spread[])
  {
//---
   if(CopyBuffer(InpInd_Handle,0,0,2,adx)<=0 ||
      CopyBuffer(InpInd_Handle1,0,0,2,rsi)<=0
      )
      return(0);
   ind1.NewValue(adx[0]);
   ind2.NewValue(rsi[0]);
//--- return value of prev_calculated for next call
   return(rates_total);
  }
The only thing left to do is writing the methods for deleting graphical resources in the deinitialization, so that graphical objects are deleted correctly when the indicator is removed.
//+------------------------------------------------------------------+
//| Custom indicator deinitialization function                       |
//+------------------------------------------------------------------+
void OnDeinit(const int reason)
  {
   ind1.Delete();
   ind2.Delete();
   ChartRedraw();
  }
//+------------------------------------------------------------------+
The results are presented in Fig. 2. As we can see, the indicators differ significantly from each other in many parameters.
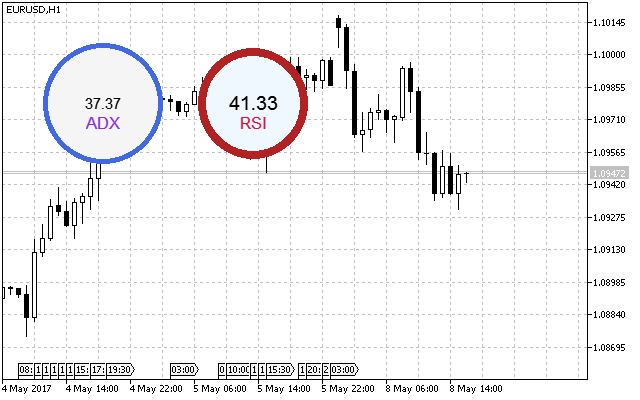
Fig. 2. Sample circular indicators
CCircleArc indicator class
We have considered a class providing the simplest form of implementing a circular indicator. Let's slightly complicate the task and create a class having an additional graphical display element besides the numerical one – an arc. The structure of the basic elements of the indicator with an arc indication is provided in Fig. 3.
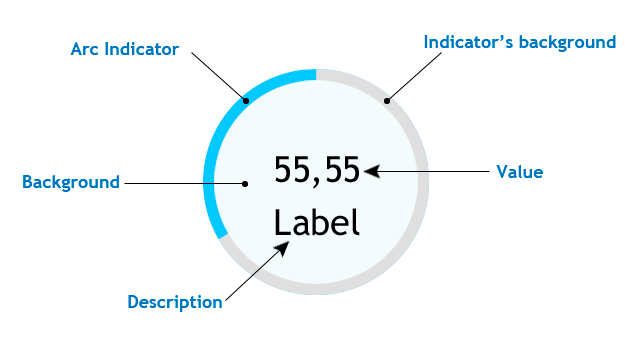
Fig. 3. Basic structure of the circular indicator with the arc indication
As we can see, this type features the Arc indicator element. To implement the arc indication, we can use the method that draws the filled ellipse sector and is called Pie(). Of all the overloads of this method, I decided to use the following:
void  Pie(
   int         x,       // X coordinate of the ellipse center
   int         y,       // Y coordinate of the ellipse center
   int         rx,      // ellipse radius X coordinate
   int         ry,      // ellipse radius Y coordinate
   int         fi3,     // ray angle from the ellipse center setting the first arc border
   int         fi4,     // ray angle from the ellipse center setting the second arc border
   const uint  clr,     // line color
   const uint  fill_clr // filling color
   );
fi3 sets the first arc border and is used as the beginning of the arc scale, while fi4 can dynamically change depending on the numerical value passed to our indicator. Create the CircleArc.mqh file in the Indicators folder and add the following string in the CustomGUI.mqh file:
#include "Indicators\CircleArc.mqh"
Thus, we add the future class to the overall list of inclusions of all indicators. Define the set of common properties and methods. They are not different from the previous class methods, however it is worth considering the ENUM_ORIENTATION enumeration. It has two values (VERTICAL and HORIZONTAL) and defines the location of the first arc border of the arc scale. If the value is vertical, the arc starts at 90 degrees and if it is horizontal — at zero. The indication is counted counter-clockwise.
//+------------------------------------------------------------------+
//|                                                    CircleArc.mqh |
//|                                Copyright 2017, Alexander Fedosov |
//|                           https://www.mql5.com/en/users/alex2356 |
//+------------------------------------------------------------------+
#include "..\CanvasBase.mqh"
//+------------------------------------------------------------------+
//| Circular indicator with numerical value and arc indication       |
//+------------------------------------------------------------------+
class CCircleArc : public CCanvasBase
  {
private:
   //--- Indicator background color
   color             m_bg_color;
   //--- Indicator arc color
   color             m_arc_color;
   //--- Indication area color
   color             m_area_color;
   //--- Indicator description color
   color             m_label_color;
   //--- Indicator value color
   color             m_value_color;
   //--- Indicator transparency
   uchar             m_transparency;
   //--- Indicator size
   int               m_radius;
   //--- Indicator scale width
   int               m_scale_width;
   //--- Description font size
   int               m_label_font_size;
   //--- Value font size
   int               m_value_font_size;
   //--- Indicator description
   string            m_label_value;
   //--- Indicator scale orientation type
   ENUM_ORIENTATION  m_orientation;
public:
                     CCircleArc(void);
                    ~CCircleArc(void);
   //--- Set and get the indicator background color
   color             BgColor(void)                                   { return(m_bg_color);            }
   void              BgColor(const color clr)                        { m_bg_color=clr;                }
   //--- Set and get the indicator arc color
   color             ArcColor(void)                                  { return(m_arc_color);           }
   void              ArcColor(const color clr)                       { m_arc_color=clr;               }
   //--- Set and get the indication area color
   color             AreaColor(void)                                 { return(m_area_color);          }
   void              AreaColor(const color clr)                      { m_area_color=clr;              }
   //--- Set and get the indicator description color
   color             LabelColor(void)                                { return(m_label_color);         }
   void              LabelColor(const color clr)                     { m_label_color=clr;             }
   //--- Set and get the indicator value color
   color             ValueColor(void)                                { return(m_value_color);         }
   void              ValueColor(const color clr)                     { m_value_color=clr;             }
   //--- Set and get the indicator transparency
   uchar             Alpha(void)                                     { return(m_transparency);        }
   void              Alpha(const uchar trn)                          { m_transparency=trn;            }
   //--- Set and get the indicator size
   int               Radius(void)                                    { return(m_radius);              }
   void              Radius(const int r)                             { m_radius=r;                    }
   //--- Set and get the indicator scale width
   int               Width(void)                                     { return(m_scale_width);         }
   void              Width(const int w)                              { m_scale_width=w;               }
   //--- Set and get the description font size
   int               LabelSize(void)                                 { return(m_label_font_size);     }
   void              LabelSize(const int sz)                         { m_label_font_size=sz;          }
   //--- Set and get the value font size
   int               ValueSize(void)                                 { return(m_value_font_size);     }
   void              ValueSize(const int sz)                         { m_value_font_size=sz;          }
   //--- Set and get the indicator description
   string            LabelValue(void)                                { return(m_label_value);         }
   void              LabelValue(const string str)                    { m_label_value=str;             }
   //--- Set and get the scale orientation type
   void              Orientation(const ENUM_ORIENTATION orietation)  { m_orientation=orietation;      }
   ENUM_ORIENTATION  Orientation(void)                               { return(m_orientation);         }
   //--- Create the indicator
   void              Create(string name,int x,int y);
   //--- Remove the indicator
   void              Delete(void);
   //--- Set and update the indicator value
   void              NewValue(double value,double maxvalue,int digits);
  };
Let's have a closer look at the Create() and NewValue() methods, since their implementation is not provided. Keep in mind that created objects are superimposed on each other in layers, so the sequence of creating them is as follows:
- Arc indicator background. As a filled circle.
- Arc indicator. As a filled ellipse sector.
- Text background. As a filled circle.
- Indicator numerical value and its description.
Implementation following the established sequence is displayed below:
//+------------------------------------------------------------------+
//| Create the indicator                                             |
//+------------------------------------------------------------------+
void CCircleArc::Create(string name,int x,int y)
  {
   int r=m_radius;
   double a,b;
//--- Set the initial indicator location
   a=(m_orientation==VERTICAL)?M_PI_2:0;
   b=(m_orientation==VERTICAL)?M_PI_2:0;
   b+=90*M_PI/180;
//--- Correct the indicator location relative to the radius
   x=(x<r)?r:x;
   y=(y<r)?r:y;
   Name(name);
   X(x);
   Y(y);
   XSize(2*r+1);
   YSize(2*r+1);
   if(!CreateCanvas())
      Print("Error. Can not create Canvas.");
//---
   m_canvas.FillCircle(r,r,r,ColorToARGB(m_bg_color,m_transparency));
   m_canvas.Pie(r,r,XSize()/2,YSize()/2,a,b,ColorToARGB(m_arc_color,m_transparency),ColorToARGB(m_arc_color,m_transparency));
   m_canvas.FillCircle(r,r,r-m_scale_width,ColorToARGB(m_area_color,m_transparency));
//---
   m_canvas.FontSizeSet(m_value_font_size);
   m_canvas.TextOut(r,r,"0",ColorToARGB(m_value_color,m_transparency),TA_CENTER|TA_VCENTER);
//---
   m_canvas.FontSizeSet(m_label_font_size);
   m_canvas.TextOut(r,r+m_label_font_size,m_label_value,ColorToARGB(m_label_color,m_transparency),TA_CENTER|TA_VCENTER);
   m_canvas.Update();
  }
While setting the initial values of the first and second arc borders (i.e., the indicator's start and its current value), we consider its initial orientation and the fact that corners for the Pie() method are set in radians. As an example, the default current value corresponding to the b variable is set to 90, then it is converted to radians, otherwise, the display is incorrect. The NewValue() method is implemented using the same principles:
//+------------------------------------------------------------------+
//| Set and update the indicator value                               |
//+------------------------------------------------------------------+
void CCircleArc::NewValue(double value,double maxvalue,int digits=2)
  {
   int r=m_radius;
   double a,b,result;
//--- Checks for out of range
   value=(value>maxvalue)?maxvalue:value;
   value=(value<0)?0:value;
//--- Set the initial indicator location
   a=(m_orientation==VERTICAL)?M_PI_2:0;
   b=(m_orientation==VERTICAL)?M_PI_2:0;
//---
   result=value*(360.0/maxvalue);
   b+=result*M_PI/180;
   if(b>=2*M_PI)
      b=2*M_PI-0.02;
//---
   m_canvas.FillCircle(r,r,r,ColorToARGB(m_bg_color,m_transparency));
   m_canvas.Pie(r,r,XSize()/2,YSize()/2,a,b,ColorToARGB(m_arc_color,m_transparency),ColorToARGB(m_arc_color,m_transparency));
   m_canvas.FillCircle(r,r,r-m_scale_width,ColorToARGB(m_area_color,m_transparency));
//---
   m_canvas.FontSizeSet(m_value_font_size);
   m_canvas.TextOut(r,r,DoubleToString(value,digits),ColorToARGB(m_value_color,m_transparency),TA_CENTER|TA_VCENTER);
//---
   m_canvas.FontSizeSet(m_label_font_size);
   m_canvas.TextOut(r,r+m_label_font_size,m_label_value,ColorToARGB(m_label_color,m_transparency),TA_CENTER|TA_VCENTER);
   m_canvas.Update();
  }
//+------------------------------------------------------------------+
After checking and setting the initial positions, the angle is re-calculated in radians of the second arc border. After that, all indicator elements are redrawn with new values. As an application example, we have developed a simple spread indicator, which changes the indication arc scale color when reaching the threshold value.
//+------------------------------------------------------------------+
//|                                                                  |
//|                                Copyright 2017, Alexander Fedosov |
//|                           https://www.mql5.com/en/users/alex2356 |
//+------------------------------------------------------------------+
#property copyright "Copyright 2017, Alexander Fedosov"
#property link      "https://www.mql5.com/en/users/alex2356"
#property version   "1.00"
#property indicator_plots 0
#property indicator_chart_window

#include <CustomGUI\CustomGUI.mqh>
//+------------------------------------------------------------------+
//|  Indicator inputs                                                |
//+------------------------------------------------------------------+
input double         maxspr=12;                 // Maximum value
input int            stepval=8;                 // Threshold value
input color          stepcolor=clrCrimson;      // Threshold value color
//---
CCircleArc arc;
double spr;
//+------------------------------------------------------------------+
//| Custom indicator initialization function                         |
//+------------------------------------------------------------------+
int OnInit()
  {
//---
   arc.Orientation(HORIZONTAL);
   arc.LabelValue("Spread");
   arc.Create("spread_ind",100,100);
//---
   return(INIT_SUCCEEDED);
  }
//+------------------------------------------------------------------+
//| Custom indicator iteration function                              |
//+------------------------------------------------------------------+
int OnCalculate(const int rates_total,
                const int prev_calculated,
                const datetime &time[],
                const double &open[],
                const double &high[],
                const double &low[],
                const double &close[],
                const long &tick_volume[],
                const long &volume[],
                const int &spread[])
  {
   spr=double(SymbolInfoInteger(Symbol(),SYMBOL_SPREAD));
   if(spr>=stepval)
      arc.ArcColor(stepcolor);
   else
      arc.ArcColor(clrForestGreen);
//---
   arc.NewValue(spr,maxspr,0);
//--- return value of prev_calculated for next call
   return(rates_total);
  }
//+------------------------------------------------------------------+
//| Custom indicator deinitialization function                       |
//+------------------------------------------------------------------+
void OnDeinit(const int reason)
  {
   arc.Delete();
   ChartRedraw();
  }
//+------------------------------------------------------------------+
As we can see from the listing, the implementation using the CCircleArc class is quite simple to create and configure. Keep in mind that the properties should be changed and configured only before the indicator is created (Create() method) or before using the NewValue() method. Since these are the methods, in which the indicator elements are re-drawn and changed properties are applied. Spread indicator is shown in Fig. 4.
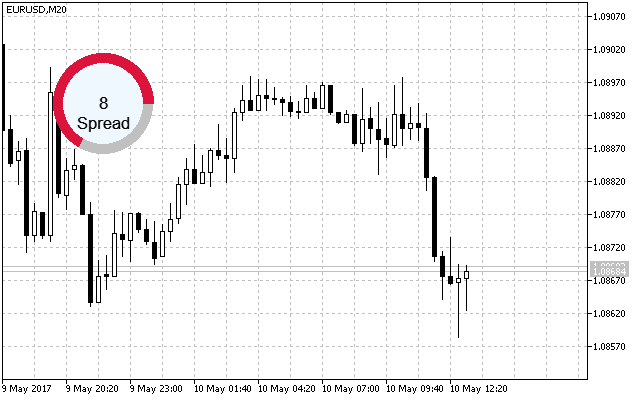
Fig. 4. Sample circular indicator with the arc indication
CCircleSection indicator class
Unlike a simple arc indication, the sectional one looks as if it has labels separating equal intervals. When creating a layout of the indicator of this type, I have decided to make ten sections and add a new element – the inner frame. The basic structure with the arc sectional indication is presented in Fig. 5.
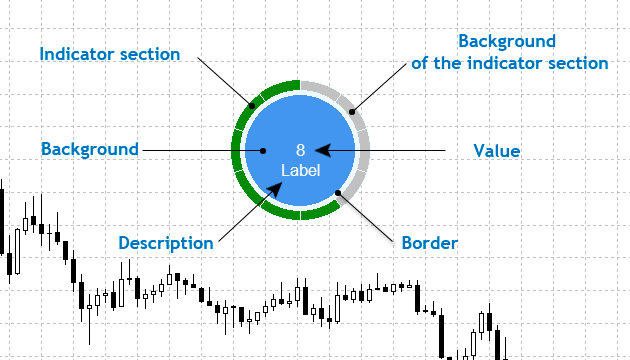
Fig. 5. Basic structure of the circular indicator with the arc sectional indication
Displaying the arc indication with sections is completely different from the previous class, which is marked with one-time use of the Pie() method of the CCanvas library. In this method, the location of the second ellipse sector arc is modified when the value changes. Here, this method is applied ten times, and the arc locations remain static. Simply put, the indicator features 10 filled ellipse sectors following each other in a circle. Certain sections changing their colors serve as a visual indication.
Create the CircleSection.mqh file in the Indicators folder and include it in the CustomUI.mqh file like all previous ones. Now, its list looks as follows:
//+------------------------------------------------------------------+
//|                                                    CustomGUI.mqh |
//|                                Copyright 2017, Alexander Fedosov |
//|                           https://www.mql5.com/en/users/alex2356 |
//+------------------------------------------------------------------+
#include "Indicators\CircleSimple.mqh"
#include "Indicators\CircleArc.mqh"
#include "Indicators\CircleSection.mqh"
Since the indicator classes are presented in the order of complicating their construction and functionality, I will nor provide their common properties and methods. Instead, let's focus our attention on the ones that add new functionality and have a different implementation. Therefore, in the current class, most methods are similar to the previous one with the following additions:
//+------------------------------------------------------------------+
//|                                                CircleRounded.mqh |
//|                                Copyright 2017, Alexander Fedosov |
//|                           https://www.mql5.com/en/users/alex2356 |
//+------------------------------------------------------------------+
#include "..\CanvasBase.mqh"
//+--------------------------------------------------------------------------+
//| Circular indicator with numerical value and circular sectional indication|
//+--------------------------------------------------------------------------+
class CCircleSection : public CCanvasBase
  {
private:
   //--- Color of the scale active/inactive division
   color             m_scale_color_on;
   color             m_scale_color_off;
public:
   //--- Set the color of the active/inactive scale division
   void              ScaleColorOn(const color clr)                   { m_scale_color_on=clr;          }
   void              ScaleColorOff(const color clr)                  { m_scale_color_off=clr;         }
   //--- Create the indicator
   void              Create(string name,int x,int y);
   //--- Set and update the indicator value
   void              NewValue(double value,double maxvalue,int digits);
  };
The Create() and NewValue() methods are left since their implementation here is different from the previous ones. As we can see from the listing below, correction of the location relative to the radius is followed by the block for creating ten sections using a cycle. The starting point is considered: horizontal – from zero degrees, vertical – from 90 degrees.
//+------------------------------------------------------------------+
//| Create the indicator                                             |
//+------------------------------------------------------------------+
void CCircleSection::Create(string name,int x,int y)
  {
   int r=m_radius;
   double a,b;
//--- Modify the indicator location relative to the radius
   x=(x<r)?r:x;
   y=(y<r)?r:y;
   Name(name);
   X(x);
   Y(y);
   XSize(2*r+1);
   YSize(2*r+1);
   if(!CreateCanvas())
      Print("Error. Can not create Canvas.");
//--- Indicator sections
   for(int i=0;i<10;i++)
     {
      if(m_orientation==HORIZONTAL)
        {
         a=36*i*M_PI/180;
         b=36*(i+1)*M_PI/180;
         if(a>2*M_PI)
            a-=2*M_PI;
         if(b>2*M_PI)
            b-=2*M_PI;
        }
      else
        {
         a=M_PI_2+36*i*M_PI/180;
         b=M_PI_2+36*(i+1)*M_PI/180;
         if(a>2*M_PI)
            a-=2*M_PI;
         if(b>2*M_PI)
            b-=2*M_PI;
        }
      m_canvas.Pie(r,r,XSize()/2,YSize()/2,a,b,ColorToARGB(m_bg_color,m_transparency),ColorToARGB(m_scale_color_off,m_transparency));
     }
//--- Frame and background
   m_canvas.FillCircle(r,r,XSize()/2-m_scale_width,ColorToARGB(m_border_color,m_transparency));
   m_canvas.FillCircle(r,r,XSize()/2-m_scale_width-m_border_size,ColorToARGB(m_area_color,m_transparency));
//--- Description
   m_canvas.FontSizeSet(m_label_font_size);
   m_canvas.TextOut(r,r+m_value_font_size,m_label_value,ColorToARGB(m_label_color,m_transparency),TA_CENTER|TA_VCENTER);
//--- Numerical value
   m_canvas.FontSizeSet(m_value_font_size);
   m_canvas.TextOut(r,r,"0",ColorToARGB(m_value_color,m_transparency),TA_CENTER|TA_VCENTER);
   m_canvas.Update();
  }
As we have already said, in addition to changing the numerical value, the visual indication is represented in the form of a change in the sections color. The change should be sequential and based on the current and highest specified value. For example, if the numerical value is 20 and the maximum one is 100, two sections will change the color. But if the maximum one is 200, only one section changes its color. Let us consider in more detail how this is done in the NewValue() method:
//+------------------------------------------------------------------+
//| Set and update the indicator value                               |
//+------------------------------------------------------------------+
void CCircleSection::NewValue(double value,double maxvalue=100,int digits=2)
  {
//---
   int r=m_radius;
   double a,b;
   color clr;
//---
   for(int i=0;i<10;i++)
     {
      if(m_orientation==HORIZONTAL)
        {
         a=36*i*M_PI/180;
         b=36*(i+1)*M_PI/180;
         if(a>2*M_PI)
            a-=2*M_PI;
         if(b>2*M_PI)
            b-=2*M_PI;
        }
      else
        {
         a=M_PI_2+36*i*M_PI/180;
         b=M_PI_2+36*(i+1)*M_PI/180;
         if(a>2*M_PI)
            a-=2*M_PI;
         if(b>2*M_PI)
            b-=2*M_PI;
        }
      clr=(maxvalue/10*(i+1)<=value)?m_scale_color_on:m_scale_color_off;
      m_canvas.Pie(r,r,XSize()/2,YSize()/2,a,b,ColorToARGB(m_bg_color,m_transparency),ColorToARGB(clr,m_transparency));
     }
//---
   m_canvas.FillCircle(r,r,XSize()/2-m_scale_width,ColorToARGB(m_border_color,m_transparency));
   m_canvas.FillCircle(r,r,XSize()/2-m_scale_width-m_border_size,ColorToARGB(m_area_color,m_transparency));
//---
   m_canvas.FontSizeSet(m_label_font_size);
   m_canvas.TextOut(r,r+m_value_font_size,m_label_value,ColorToARGB(m_label_color,m_transparency),TA_CENTER|TA_VCENTER);
//---
   m_canvas.FontSizeSet(m_value_font_size);
   m_canvas.TextOut(r,r,DoubleToString(value,digits),ColorToARGB(m_value_color,m_transparency),TA_CENTER|TA_VCENTER);
   m_canvas.Update();
  }
//+------------------------------------------------------------------+
As we can see in the listing above, the implementation looks quite simple. The current value is checked relative to the maximum one. If it exceeds or becomes equal to the maximum value divided by the number of sections and multiplied by the current cycle iteration, the section color is changed from non-active to active.
As an example of using the class, I have implemented the drawdown indicator that displays the ratio of the equity to the current account balance. Thus, we can visually manage the drawdown on the account instead of tracking the numbers in the platform. The listing of the implementation of such an indicator is presented below.
//+------------------------------------------------------------------+
//|                                              CustomIndicator.mq5 |
//|                                Copyright 2017, Alexander Fedosov |
//|                           https://www.mql5.com/en/users/alex2356 |
//+------------------------------------------------------------------+
#property copyright "Copyright 2017, Alexander Fedosov"
#property link      "https://www.mql5.com/en/users/alex2356"
#property version   "1.00"
#property indicator_plots 0
#property indicator_chart_window

#include <CustomGUI\CustomGUI.mqh>
//---
CCircleSection ind;
//+------------------------------------------------------------------+
//| Custom indicator initialization function                         |
//+------------------------------------------------------------------+
int OnInit()
  {
//---
   ind.Radius(70);
   ind.LabelValue("Drawdown");
   ind.Create("drawdown",150,150);
//---
   return(INIT_SUCCEEDED);
  }
//+------------------------------------------------------------------+
//| Custom indicator iteration function                              |
//+------------------------------------------------------------------+
int OnCalculate(const int rates_total,
                const int prev_calculated,
                const datetime &time[],
                const double &open[],
                const double &high[],
                const double &low[],
                const double &close[],
                const long &tick_volume[],
                const long &volume[],
                const int &spread[])
  {
//---
   ind.NewValue(AccountInfoDouble(ACCOUNT_EQUITY),AccountInfoDouble(ACCOUNT_BALANCE));
//--- return value of prev_calculated for next call
   return(rates_total);
  }
//+------------------------------------------------------------------+
//| Custom indicator deinitialization function                       |
//+------------------------------------------------------------------+
void OnDeinit(const int reason)
  {
   ind.Delete();
   ChartRedraw();
  }
//+------------------------------------------------------------------+
Do not forget to use the Delete() method in deinitialization to delete the indicator from the chart correctly.
CLineGraph linear graph class
To create a linear graph using custom graphics, you should first determine the elements of the graph itself, namely:
- Graph backdrop. It is to have two features: size (which also the size of the object itself) and color.
- Graph frame. Only color. The element consists of the two filled rectangles. The coordinates of the last one (which also serves as the graph background) are shifted by one providing the frame effect.
- Graph background. Only color.
- Graph axes. Only color. Implemented the same way as the graph frame by overlaying two rectangles, where the upper one shifts the coordinates by one.
- Axis scale. Only color. Set of lines implemented using the LineHorizontal() methods for Y axis and LineVertical() for Х axis.
- Axis value. Color and font size properties. Set of text objects using the TextOut() method.
- Grid. Only color. The LineAA() method is selected for implementing the grid, since it allows to set the line style.
- Graph. Only color. The element consists of line and filled circle — the FillCircle() method.
Only customizable properties are specified in the elements description. Fig. 6 displays the graph elements structure.
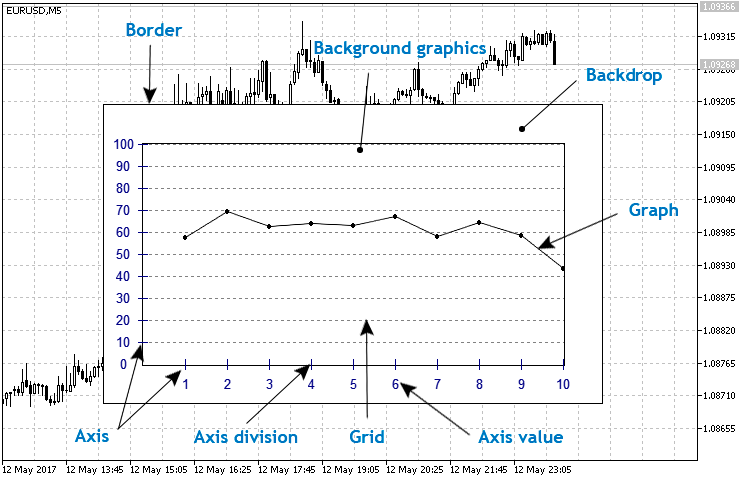
Fig. 6. Basic linear graph structure
First, create the LineGraph.mqh file in the Indicators folder and include it in the CustomGUI.mqh file:
//+------------------------------------------------------------------+
#include "Indicators\CircleSimple.mqh"
#include "Indicators\CircleArc.mqh"
#include "Indicators\CircleSection.mqh"
#include "Indicators\LineGraph.mqh"
//+------------------------------------------------------------------+
Then, create the CLineGraph class in the LineGraph.mqh file and make CCanvasBase the basic one for it, like the previous ones. Define all properties and methods described above in the basic structure of the linear graph.
//+------------------------------------------------------------------+
//|                                                    LineGraph.mqh |
//|                                Copyright 2017, Alexander Fedosov |
//|                           https://www.mql5.com/en/users/alex2356 |
//+------------------------------------------------------------------+
#include "..\CanvasBase.mqh"
//+------------------------------------------------------------------+
//| Linear graph                                                     |
//+------------------------------------------------------------------+
class CLineGraph : public CCanvasBase
  {
private:
   //--- Graph backdrop color
   color             m_bg_color;
   //--- Graph background color
   color             m_bg_graph_color;
   //--- Graph frame color
   color             m_border_color;
   //--- Graph axes values color
   color             m_axis_color;
   //--- Graph grid color
   color             m_grid_color;
   //--- Graph axes scale color
   color             m_scale_color;
   //--- Graph line color
   color             m_graph_color;
   //--- Graph size
   int               m_x_size;
   int               m_y_size;
   //--- Graph indent from the backdrop edge
   int               m_gap;
   //--- Value font size on graph axes
   int               m_font_size;
   //--- Array of Y axis values
   int               m_x[];
   //--- Minimum and maximum Y axis value
   double            m_y_min;
   double            m_y_max;
   //--- Number of Y axis scales
   int               m_num_grid;
   //--- Graph transparency
   uchar             m_transparency;
public:
                     CLineGraph(void);
                    ~CLineGraph(void);
   //--- Set and get the graph backdrop color
   color             BgColor(void)                                   { return(m_bg_color);                  }
   void              BgColor(const color clr)                        { m_bg_color=clr;                      }
   //--- Set and get the graph background color
   color             BgGraphColor(void)                              { return(m_bg_graph_color);            }
   void              BgGraphColor(const color clr)                   { m_bg_graph_color=clr;                }
   //--- Set and get the graph frame color
   color             BorderColor(void)                               { return(m_border_color);              }
   void              BorderColor(const color clr)                    { m_border_color=clr;                  }
   //--- Set and get the color of the graph axes values
   color             AxisColor(void)                                 { return(m_axis_color);                }
   void              AxisColor(const color clr)                      { m_axis_color=clr;                    }
   //--- Set and get the graph grid color
   color             GridColor(void)                                 { return(m_grid_color);                }
   void              GridColor(const color clr)                      { m_grid_color=clr;                    }
   //--- Set and get the graph axes scale color
   color             ScaleColor(void)                                { return(m_scale_color);               }
   void              ScaleColor(const color clr)                     { m_scale_color=clr;                   }
   //--- Set and get the graph line color
   color             GraphColor(void)                                { return(m_graph_color);               }
   void              GraphColor(const color clr)                     { m_graph_color=clr;                   }
   //--- Set and get the graph size
   int               XGraphSize(void)                                { return(m_x_size);                    }
   void              XGraphSize(const int x_size)                    { m_x_size=x_size;                     }
   int               YGraphSize(void)                                { return(m_y_size);                    }
   void              YGraphSize(const int y_size)                    { m_y_size=y_size;                     }
   //--- Set and get the value font size on the graph axes
   int               FontSize(void)                                  { return(m_font_size);                 }
   void              FontSize(const int fontzise)                    { m_font_size=fontzise;                }
   //--- Set and get the raph indent from the backdrop edge
   int               Gap(void)                                       { return(m_gap);                       }
   void              Gap(const int g)                                { m_gap=g;                             }
   //--- Set and get the minimum and maximum Y axis value
   double            YMin(void)                                      { return(m_y_min);                     }
   void              YMin(const double ymin)                         { m_y_min=ymin;                        }
   double            YMax(void)                                      { return(m_y_max);                     }
   void              YMax(const double ymax)                         { m_y_max=ymax;                        }
   //--- Set and get the number of Y axis scales
   int               NumGrid(void)                                   { return(m_num_grid);                  }
   void              NumGrid(const int num)                          { m_num_grid=num;                      }
   //--- Create the graph
   void              Create(string name,int x,int y);
   //--- Delete the graph
   void              Delete(void);
   //--- Set the inputs array
   void              SetArrayValue(double &data[]);
private:
   //---
   void              VerticalScale(double min,double max,int num_grid);
   void              HorizontalScale(int num_grid);
  };
Let's have a closer look at the implementation of the methods that are not specified in the above listing. The Create() method is used to create a graphical resource, which is then placed on a symbol chart. The two private methods for setting the vertical and horizontal scale are used here as well: either based on initialized settings in the class constructor or using the class methods before creation.
//+------------------------------------------------------------------+
//| Create the graph                                                 |
//+------------------------------------------------------------------+
void CLineGraph::Create(string name,int x,int y)
  {
//--- Modify the indicator location relative to
   x=(x<m_x_size/2)?m_x_size/2:x;
   y=(y<m_y_size/2)?m_y_size/2:y;
   Name(name);
   X(x);
   Y(y);
   XSize(m_x_size);
   YSize(m_y_size);
   if(!CreateCanvas())
      Print("Error. Can not create Canvas.");
//--- Create the graph frame and backdrop
   m_canvas.FillRectangle(0,0,XSize(),YSize(),ColorToARGB(m_border_color,m_transparency));
   m_canvas.FillRectangle(1,1,XSize()-2,YSize()-2,ColorToARGB(m_bg_color,m_transparency));
//--- Create axes and graph background
   m_canvas.FillRectangle(m_gap-1,m_gap-1,XSize()-m_gap+1,YSize()-m_gap+1,ColorToARGB(m_border_color,m_transparency));
   m_canvas.FillRectangle(m_gap,m_gap,XSize()-m_gap,YSize()-m_gap,ColorToARGB(m_bg_graph_color,m_transparency));
//--- Create axis scales and their values
   VerticalScale(m_y_min,m_y_max,m_num_grid);
   HorizontalScale(5);
   m_canvas.Update();
  }
In order to display a linear chart, it is reasonable to use a data array as a basis, since MetaTrader often applies arrays for copying values from indicator buffers. When implementing the SetArrayValue() graph display method, the data array is used as a basis (method arguments), where the values corresponding to the array size are set on the X axis and the array values — on the Y axis.
//+------------------------------------------------------------------+
//| Set the input array                                              |
//+------------------------------------------------------------------+
void CLineGraph::SetArrayValue(double &data[])
  {
   int y0,y1;
//---  Create the graph frame and backdrop
   m_canvas.FillRectangle(0,0,XSize(),YSize(),ColorToARGB(m_border_color,m_transparency));
   m_canvas.FillRectangle(1,1,XSize()-2,YSize()-2,ColorToARGB(m_bg_color,m_transparency));
//--- Create the axes and the graph background
   m_canvas.FillRectangle(m_gap-1,m_gap-1,XSize()-m_gap+1,YSize()-m_gap+1,ColorToARGB(m_border_color,m_transparency));
   m_canvas.FillRectangle(m_gap,m_gap,XSize()-m_gap,YSize()-m_gap,ColorToARGB(m_bg_graph_color,m_transparency));
//--- If the maximum data array value exceeds the upper Y border, the axis is scaled.
   if(data[ArrayMaximum(data)]>m_y_max)
      m_y_max=data[ArrayMaximum(data)];
//--- Create the axis scales and their values
   VerticalScale(m_y_min,m_y_max,m_num_grid);
   HorizontalScale(ArraySize(data));
//--- Create the graph by the data array
   for(int i=0;i<ArraySize(data)-1;i++)
     {
      y0=int((YSize()-2*m_gap)*(1-data[i]/m_y_max));
      y0=int((YSize()-m_gap)-(YSize()-2*m_gap)/m_y_max*data[i]);
      y0=(y0<m_gap)?m_gap:y0;
      y1=int((YSize()-m_gap)-(YSize()-2*m_gap)/m_y_max*data[i+1]);
      y1=(y1<m_gap)?m_gap:y1;
      m_canvas.LineAA(m_x[i+1],y0,m_x[i+2],y1,ColorToARGB(m_graph_color,m_transparency),STYLE_SOLID);
      m_canvas.FillCircle(m_x[i+1],y0,2,ColorToARGB(m_graph_color,m_transparency));
      m_canvas.FillCircle(m_x[i+2],y1,2,ColorToARGB(m_graph_color,m_transparency));
     }
   m_canvas.Update();
  }
As an example of the class application, I have developed a graph based on the selected oscillator values and compared with the original display. The standard RSI has been used for that purpose. The listing below shows implementing of construction based on the buffer values using the ClineGraph class.
//+------------------------------------------------------------------+
//|                                                            4.mq5 |
//|                                Copyright 2017, Alexander Fedosov |
//|                           https://www.mql5.com/en/users/alex2356 |
//+------------------------------------------------------------------+
#property copyright "Copyright 2017, Alexander Fedosov"
#property link      "https://www.mql5.com/en/users/alex2356"
#property version   "1.00"
#property indicator_plots 0
#property indicator_chart_window

#include <CustomGUI\CustomGUI.mqh>
//---
CLineGraph ind;
int InpInd_Handle;
double rsi[];
//+------------------------------------------------------------------+
//| Custom indicator initialization function                         |
//+------------------------------------------------------------------+
int OnInit()
  {
//---- get the indicator handle
   InpInd_Handle=iRSI(Symbol(),PERIOD_CURRENT,10,PRICE_CLOSE);
   if(InpInd_Handle==INVALID_HANDLE)
     {
      Print("Failed to get indicator handle");
      return(INIT_FAILED);
     }
//---
   ind.NumGrid(10);
   ind.YMax(100);
   ind.Create("rsi",350,250);

//---
   return(INIT_SUCCEEDED);
  }
//+------------------------------------------------------------------+
//| Custom indicator iteration function                              |
//+------------------------------------------------------------------+
int OnCalculate(const int rates_total,
                const int prev_calculated,
                const datetime &time[],
                const double &open[],
                const double &high[],
                const double &low[],
                const double &close[],
                const long &tick_volume[],
                const long &volume[],
                const int &spread[])
  {
//---
   if(CopyBuffer(InpInd_Handle,0,0,10,rsi)<=0)
      return(0);
   ind.SetArrayValue(rsi);
//--- return value of prev_calculated for next call
   return(rates_total);
  }
//+------------------------------------------------------------------+
//| Custom indicator deinitialization function                       |
//+------------------------------------------------------------------+
void OnDeinit(const int reason)
  {
   ind.Delete();
   ChartRedraw();
  }
//+------------------------------------------------------------------+
Now, set the original indicator with the same parameters and compare the obtained results in Fig. 7:
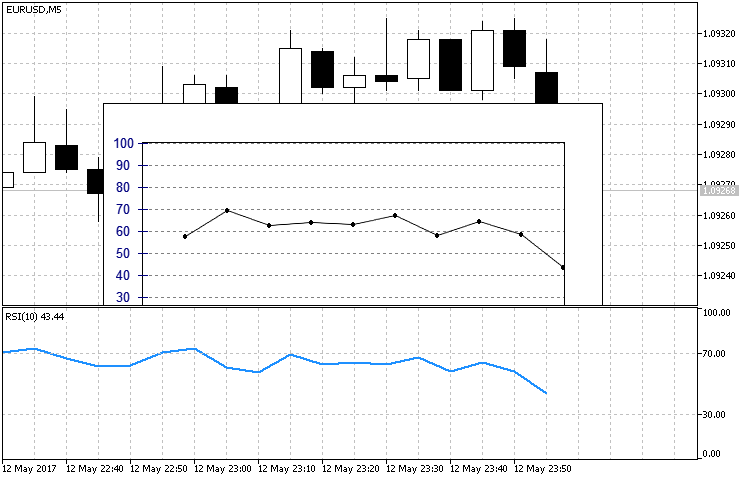
Fig. 7. Comparing the implementation of constructions using the CLineGraph class and original RSI
Note that the array the data is written to using the CopyBuffer method should have the original form. Unlike time series, no indexation change is required.
Conclusion
In this article, we have dealt with step-by-step creation of custom indicators of an arbitrary form with the help of the CСanvas custom graphics library. We have also analyzed examples of various complexity – from a simple circular indicator consisting of only four elements up to a circular one with sectional indication. Besides, we have considered the implementation of the already known indicator types in a new way. As we have seen, the options are not limited by a rigidly defined set of properties. The implementation examples have been structured as classes, i.e. they are a supplement or extension of the already complete CCanvas class.
The attached archive contains all the listed files, which are located in the appropriate folders. For a correct operation, you should save the MQL5 folder to the terminal's root directory.
Programs used in the article:
| # | Name | Type | Description |
|---|---|---|---|
| 1 | CanvasBase.mqh | Library | Base custom graphics class |
| 2 | CustomGUI.mqh | Library | File of all the library classes include list |
| 3 | CircleArc.mqh | Library | Contains the CCircleArc indicator class |
| 4 | CircleSection.mqh | Library | Contains the CCircleSection indicator class |
| 5 | CircleSimple.mqh | Library | Contains the CCircleSimle indicator class |
| 6 | LineGraph.mqh | Library | Contains the CLineGraph linear graph class |
| 7 | 1.mq5 | Indicator | Sample implementation of the CCirleSimple class |
| 8 | 2.mq5 | Indicator | Sample implementation of the CCirleArc class |
| 9 | 3.mq5 | Indicator | Sample implementation of the CCirleSection class |
| 10 | 4.mq5 | Indicator | Sample implementation of the CLineGraph class |
Translated from Russian by MetaQuotes Ltd.
Original article: https://www.mql5.com/ru/articles/3236
Warning: All rights to these materials are reserved by MetaQuotes Ltd. Copying or reprinting of these materials in whole or in part is prohibited.
This article was written by a user of the site and reflects their personal views. MetaQuotes Ltd is not responsible for the accuracy of the information presented, nor for any consequences resulting from the use of the solutions, strategies or recommendations described.

 Cross-Platform Expert Advisor: Time Filters
 Cross-Platform Expert Advisor: Money Management
 Custom indicators and infographics in CCanvas
- Free trading apps
- Over 8,000 signals for copying
- Economic news for exploring financial markets
You agree to website policy and terms of use
Yeah, that's right.
Then here:
Why so complicated in the indicator? In my opinion, it is necessary to clean up the canvas itself. I would add ChartRedraw() to the DeleteCanvas() method.
Yes, this way there will be less unnecessary lines. We make the canvas neat and send the redraw there.
That's not really the way to do it:
Why a ternary operator? - When you can just do it:
I did it this way:
But canvas has its own method of deleting CCanvas::Destroy().
Why do we need to add something else?
I have a problem with vertical scaling.
I want to make a tick chart on RTS, where the maximum on the Y axis is 97784.0 and the minimum is 97756.0.
I do this in the code:
I get this:
https://www.mql5.com/ru/charts/7227612/rts-9-17-m1-ao-otkritie-broker
The minimum is shown correctly, but then there is some whizzing.
Apparently, the CLineGraph::VerticalScale() method is not as fine-tuned as I think, or worse, as it should be.
...
Try this class >>> CGraphic
Visualise it! Graphics library in MQL5 as an analogue of plot from R
Testing CGraphic - questions and suggestions
Try this class >>> CGraphic
Visualise it! Graphics library in MQL5 as an analogue of plot from R
Testing CGraphic - questions and suggestions
Anatoly, thanks for the tip, I will use it. It's a shame that the idea turns out to be unfriendly code...