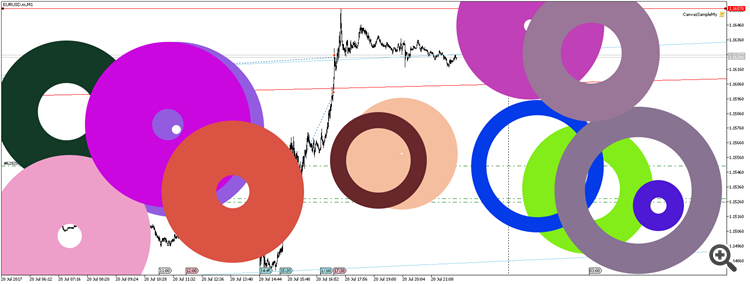
It's cool, but there's no anti-aliasing at all. Drawing with pixel squares is behind the times.
Here is an example that demonstrates that antialiasing exists in nature:
And the code?
And the code?
You're welcome:
#property copyright   "2009-2017, MetaQuotes Software Corp."
#property link        "https://www.mql5.com"
#property description "Demonstrating Canvas features"
#property script_show_inputs
//---
#include <Canvas\CanvasPro.mqh>
//+------------------------------------------------------------------+
//| inputs|
//+------------------------------------------------------------------+
input int pause = 20;   // delay in milliseconds between output to the screen
input bool top = false; // draw under the graph?
input ENUM_COLOR_FORMAT format=COLOR_FORMAT_ARGB_NORMALIZE; //Colour processing method
input int Ncirl =30;    // number of circles
input int MaxSizeCircle = 200; // maximum size of circles
//+------------------------------------------------------------------+
//| Script programme start function|
//+------------------------------------------------------------------+
int OnStart(void)
  {

   double r1[],r2[],k1[],k2[];
   int x[],y[];
   uint col[];
   int j=0;
   ArrayResize(r1,Ncirl);
   ArrayResize(r2,Ncirl);
   ArrayResize(k1,Ncirl);
   ArrayResize(k2,Ncirl);
   ArrayResize(x,Ncirl);
   ArrayResize(y,Ncirl);
   ArrayResize(col,Ncirl);

   ChartSetInteger(0,CHART_FOREGROUND,top);
   int Width =(ushort)ChartGetInteger(0,CHART_WIDTH_IN_PIXELS);  // get Window Width
   int Height=(ushort)ChartGetInteger(0,CHART_HEIGHT_IN_PIXELS); // get the window height
   uint ColorScreen=(color)ChartGetInteger(0,CHART_COLOR_BACKGROUND,0);// get window background colour

   CCanvasPro canvas;
   if(!canvas.CreateBitmapLabel("SampleCanvas",0,0,Width,Height,format))
     {
      Print("Error creating canvas: ",GetLastError());
      return(-1);
     }
   canvas.SetBack(false);
   canvas.Erase(ColorScreen);
   canvas.Update();
   srand(GetTickCount());
   for(int i=0;i<Ncirl;i++)
     {
      x[i]=rand()%Width;
      y[i]=rand()%Height;
      r1[i]=rand()%MaxSizeCircle;
      r2[i]=rand()%MaxSizeCircle;
      k1[i]=(double)(rand()%10)/1000;
      k2[i]=(double)(rand()%10)/1000;
      col[i]=XRGB(rand()%255,rand()%255,rand()%255);
     }
   while(!IsStopped())
     {
      canvas.Erase(ColorScreen);
      for(int i=0;i<Ncirl;i++) canvas.CircleSS(x[i],y[i],r1[i]*fabs(sin(j*k1[i])),r2[i]*fabs(sin(j*k2[i])),col[i]);
      Sleep(pause);
      canvas.Update();
      j++;
     }

   ObjectDelete(0,"SampleCanvas");
   canvas.Destroy();
   return(0);
  }
And the code?
The standard cCanvas already has several smoothing methods for all shapes, right?
Alas. Even the last circle function based on Wu's method contains bugs and gives a noticeable error in smoothing in diagonal places of the circle because of the primitiveness of this method, and is very suboptimal in terms of speed. Especially smoothed filled shapes simply do not exist.
And the code?
Well, then I can only join the question.
It is strange why you are asking me this question. I don't work in Metaquotes, though I dream of working there. If I worked in this company, then I would be able to work well on this question, as well as not only on the question of smoothing in CCanvas library, but also, for example, on full-fledged 3D functions in canvas.
But now I have only experiments made on my knees, which I am afraid to publish, because I know that I can do better, but it takes time.
It is strange why you are asking me this question. I don't work for Metaquotes, although I dream of working there. If I worked in this company, then I would be able to work well on this issue, as well as not only on the issue of anti-aliasing in CCanvas library, but also, for example, on full 3D functions in canvas.
But now only experiments, assembled on my knees, which I am afraid to publish, because I know that I can do better, but it takes time.
For the 10th time, the topic is marked unread, although there are no post edits or new posts.
Is someone messing around or is the forum keying up?
For the 10th time, the topic is marked unread, although there are no post edits or new posts.
Is someone messing around or is the forum keying up?
I have a suspicion that the authors (author?) is editing his post.
Another option: someone started to write a post and quit, now this post hangs in edit mode, and the forum every minute (5, 10 minutes?) notes that something is happening in the topic.
- Free trading apps
- Over 8,000 signals for copying
- Economic news for exploring financial markets
You agree to website policy and terms of use

New article Custom indicators and infographics in CCanvas has been published:
The article considers new types of indicators with more complex structural implementation. It also describes the development of pseudo-3D indicator types and dynamic infographics.
We have examined the classes and principles of constructing complex shapes using primitives. While describing the class for constructing histogram-type indicators, I have mentioned plotting pseudo-3D objects (Fig. 13) by means of color selection. However, the pyramid is not a flat figure. Therefore, we have to use its isometric projection in a given two-dimensional coordinate system. The basic structure does not contain too many elements (Fig.14), but the method of the pyramid projection and visualization is the main part of the class implementation.
Fig. 14. Basic structure of the CPyramid class
Author: Alexander Fedosov