From Evidence to Execution (Part 2): Turning MetaTrader 5 AI Strategy Logs into Robust Rule Based EA
 156
 0

Table of Contents
- Introduction
- From Analysis to Logic
- Phase 10: Establishing the entry logic
- Phase 11: Stop loss and take profit
- Phase 12: Stress-testing before implementation
- Getting Started
- Inputs: The evidence made configurable
- The state structures
- Entry evaluation: Two gates
- Timing as a weight
- Stop and target construction
- Position sizing
- Execution on the following bar
- Position management
- Per-bar orchestration
- Backtest
- Conclusion
- Appendix: The three prompts
Introduction
In Part 1 we argued that Expert Advisors drift away from the strategies that inspired them because developers start coding before they understand how their own rules behave. Instead of writing the EA first, we built a logger that watched the market and recorded what the strategy would have seen without ever placing a trade. We ran it on GBPUSD M15 during the Tokyo session from January 2025 through August 2026. It produced 419 fully measured breakout events. Each event had 61 columns: 39 known at breakout time and 22 available only in hindsight.
The nine analysis phases contradicted most of our assumptions. Volume confirmation did not separate winners from losers in this dataset. Breakout candle size, range size, ATR level, and time of day were similarly inert. Most signal came from two features: range location relative to prior-day structure on the breakout side, and breakout candle body cleanliness. The strongest separators—retest depth and whether the retest held—were post-entry by construction, so they are useful for management but not for selection. In this article we are turning that evidence into working code. We continue the same conversation with the MetaTrader 5 AI Assistant where Phase 9 left off, carry it through three more phases, and then write the Expert Advisor.
From Analysis to Logic
Phases 1 through 9 were descriptive. Every one of them ended with an instruction not to produce trading rules, because the point was to understand the strategy rather than to justify a conclusion we had already reached. The next three phases finally cross that line, but they cross it carefully: first the entry, then the exits, then a deliberate attempt to break what we just built.
Phase 10: Establishing the entry logic
Goal:
Propose a complete entry logic using only the features classified as safe for entry decisions, with thresholds, direction scope, and whether each condition is a hard gate or a preference weight.
Output:
| Condition | Threshold | Scope | Classification |
|---|---|---|---|
| Distance to prior-day structure, breakout side | ≤ +50 pts; core ≤ 0; exclusion > +400 | Both | Hard gate plus hard exclusion |
| Breakout candle body ratio | ≥ 0.79 | Both | Hard gate, flagged as relaxable |
| Breakout penetration depth (BrkDistATR) | ≥ 0.5 upgrades, ≤ 0.25 downgrades | Both | Preference weight only, never a gate |
The mechanics matter as much as the thresholds. The body ratio and the penetration depth are close-conditional, so no decision exists before the breakout bar closes; the structural distance is known earlier, as soon as the range is frozen. The order is therefore placed on the open of the following bar, with the breakout bar's close used as the reference price for everything downstream. This is not a stylistic choice—it is the direct consequence of the Phase 1 finding that breakout-candle metrics are still in flight if an EA fires intra-bar.
Equally important is what the proposal deliberately excluded and why: volume because Phase 5 refuted it, candle size because body ratio dominates it, range size because its effect is tail-only, hour and weekday because they are secondary orderers rather than separators, and the prior-structure distance pair because the audit could not verify what reference level they measure against. Each exclusion carries a reason from the data rather than an opinion.
The assistant also flagged its own most attractive result as a trap. The pocket where both strong features agree—distance ≤ 50 and body ≥ 0.79—contained six successes, zero failures and one unresolved event. It was recorded as a hypothesis for validation rather than promoted into the rule, which is exactly the discipline that prevents a beautiful backtest from becoming a live disappointment.
Phase 11: Stop loss and take profit
Goal:
Define stop and target logic consistent with the frozen entry, anchored on entry-time quantities, with at least two approaches each and every parameter traceable to a finding.
The numbers that govern the stop came straight from the earlier phases. Maximum adverse excursion has a median of 0.49 R, a mean of 0.82 R and a maximum of 5.55 R. Successful breakouts retest to roughly 0.30 R; failures dig to roughly 0.82 R. Ninety percent of all breakouts get retested and 76% of those retests hold.
That last statistic immediately rules out the most obvious design. A stop placed at the range boundary would convert the normal, healthy retest that happens to three breakouts in four into a guaranteed exit. The stop has to sit beyond the healthy retest cluster but before the failing one, and the assistant proposed a corridor of roughly 0.35 to 0.5 R on that reasoning, with an ATR-scaled variant as an alternative and a retest-aware two-stage stop as an optional third.
For targets it proposed a fixed R multiple anchored on the median favorable excursion of 0.65 R, combined with a time gate exploiting the fact that winners resolve in a median of 14 bars while failures die in 6. Trailing after a held retest was offered as a third option and deferred, because the joint retest table needed to size it does not exist.
The most valuable part of this phase was its list of assumptions that go beyond the data. If the logger stamps SUCCESS at "MFE ≥ 1 R", then setting a take profit at 1 R is tautological and tells us nothing. The conditional distributions—favorable and adverse excursion split by outcome and direction—were never computed, so any exact stop point inside the corridor is an interpolation between medians rather than a measured breakpoint. And the 5.55 R adverse tail is uninsurable at a 26% success rate; capping it is a risk-acceptance decision, not an empirical optimum. Naming those limits is what separates an evidence-led design from one that merely quotes numbers.
Phase 12: Stress-testing before implementation
Goal:
Attack the combined entry, stop and target logic with the known weaknesses of the dataset, and find every condition under which it would knowingly take a bad trade.
Output:
| Item | Verdict | Action taken |
|---|---|---|
| Entry structural gates | Consiste nt with the evidence | Keep unchanged |
| Stop at 0.35–0.5 R | Contradicts median MAE 0.49 and the 76% retest-hold rate | Widen the base; drop 0.35 entirely |
| Hard time gate at 8–10 bars | Contradicts 14-bar winner latency | Demote to a soft trail plus a session-end exit |
| Symmetric management across directions | Inconsistent with DOWN's deeper MAE and shorter MFE | Make management direction-conditioned |
| BrkDistATR confirmation, applied symmetrically | Direction-biased and possibly misleading | Suspend pending per-direction validation |
| Late breakout at 7–14 bars passing the gates | Known bad trade, currently admissible | Reintroduce timing as a soft preference |
The stop finding is the sharpest. A 0.35–0.5 R stop sits near the population median MAE, so roughly half of all events reach it, including many eventual winners. Such a stop does not protect against the 5.55 R tail in any meaningful sense; it simply exits early, and it turns the 76% retest-hold statistic against us by selling at the worst available price. No single static stop can satisfy both the 0.49 R median and the 5.55 R tail. The design must choose which risk to prioritize. The wide stop was chosen as the base, with the failure mode handled instead by a dead-man exit when price closes back inside the range—the behavioral signature of a FALSE event. The wide stop does not cover the tail either: at 0.60 R it caps the loss well short of 5.55 R. It buys room for the healthy retest, and the tail is accepted risk rather than insured risk.
The timing finding is the one that changed the entry. Nothing in the Phase 10 logic prevents a trade firing 7 to 14 bars after the range ends, and that zone showed 60% failures with the worst follow-through in the dataset. The structural gates and the timing axis are not correlated, so there is no reason to believe one rescues the other. Timing came back in—but as a size multiplier rather than a filter, which is what Phase 9's evidence actually supports.
Getting Started
Inputs: The evidence made configurable
//+------------------------------------------------------------------+
//|                               Automated Breakout From Logger.mq5 |
//|                                  Copyright 2025, MetaQuotes Ltd. |
//|                     https://www.mql5.com/en/users/johnhlomohang/ |
//+------------------------------------------------------------------+
#property copyright "Copyright 2025, MetaQuotes Ltd."
#property link      "https://www.mql5.com/en/users/johnhlomohang/"
#property version   "1.00"

#include <Trade\Trade.mqh>
#include <Trade\PositionInfo.mqh>

//+------------------------------------------------------------------+
//| Enumerations                                                     |
//+------------------------------------------------------------------+
enum ENUM_RANGE_MODE
  {
   RANGE_SESSION      = 0,  // Session breakout
   RANGE_CUSTOM_TIME  = 1   // Time-based breakout
  };

enum ENUM_LOG_SESSION
  {
   SESSION_SYDNEY     = 0,  // Sydney
   SESSION_TOKYO      = 1,  // Tokyo (Asian range)
   SESSION_LONDON     = 2,  // London
   SESSION_NEWYORK    = 3   // New York
  };

enum ENUM_SL_MODE
  {
   SL_WIDE            = 0,  // Wide boundary stop (evidence base case)
   SL_AGGRESSIVE      = 1   // Aggressive stop (documented alternative)
  };

enum ENUM_TIME_POLICY
  {
   TIME_OFF           = 0,  // Ignore breakout timing entirely
   TIME_WEIGHT        = 1,  // Timing scales position size only (soft)
   TIME_GATE          = 2   // Timing blocks the late zone (hard)
  };

//+------------------------------------------------------------------+
//| Inputs                                                           |
//+------------------------------------------------------------------+
input group "=== Range definition (must match the logger) ==="
input ENUM_TIMEFRAMES  InpTF              = PERIOD_M15;     // Working timeframe
input ENUM_RANGE_MODE  InpRangeMode       = RANGE_SESSION;  // Range mode
input ENUM_LOG_SESSION InpSession         = SESSION_TOKYO;  // Session
input string           InpTimeStart       = "02:00";        // Start HH:MM (time mode)
input string           InpTimeEnd         = "10:00";        // End HH:MM (time mode)
input int              InpServerOffsetHr  = 0;              // Hours to shift session presets
input int              InpMinRangeBars    = 8;              // Minimum bars for a valid range
input int              InpATRPeriod       = 14;             // ATR period

input group "=== Entry gates (Stage 10, unchanged by stress test) ==="
input double           InpDistPrevMaxPts  = 50.0;           // Gate: distance to prior-day level <= this
input double           InpDistPrevExclPts = 400.0;          // Hard exclusion: distance > this
input double           InpBodyRatioMin    = 0.80;           // Gate: breakout candle body ratio >=
input double           InpBufferATR       = 0.05;           // Breakout buffer beyond edge (x ATR)
input int              InpBreakWindowBar  = 48;             // Bars after range to hunt breakouts
input int              InpMaxTradesPerDay = 1;              // Max entries per range

input group "=== Experimental penetration filter (off; not a Phase 10 rule) ==="
input bool             InpUseDistATR      = false;          // Enable experimental filter (off in all reported tests)
input double           InpDistATRConfirm  = 0.50;           // Size upgrade x1.20 at or above (x ATR)
input double           InpDistATRVeto     = 0.25;           // HARD reject at or below (x ATR)

input group "=== Timing preference (Phase 9, soft by default) ==="
input ENUM_TIME_POLICY InpTimePolicy      = TIME_WEIGHT;    // How breakout timing is applied
input int              InpAnchorBarsFrom  = 3;              // Anchor zone start (bars after range)
input int              InpAnchorBarsTo    = 6;              // Anchor zone end
input double           InpMultImmediate   = 0.60;           // Size multiplier, <= 2 bars
input double           InpMultAnchor      = 1.00;           // Size multiplier, anchor zone
input double           InpMultContested   = 0.40;           // Size multiplier, 7-14 bars
input double           InpMultLate        = 0.60;           // Size multiplier, 15+ bars
The input list is unusual for a breakout EA in what it does not contain. There is no volume filter, no minimum candle size, no minimum or maximum range width, no ATR regime filter and no day-of-week switch. Those absences are not oversights; each one is a finding from Part 1 made executable. An EA that offers a volume filter invites the user to turn it on, and every hour spent tuning a parameter the data has already declared inert is an hour spent drifting away from the strategy.
The suspended confirmation deserves its own group precisely because it is switched off. Phase 12 found that penetration depth fires more readily on DOWN breakouts, which are the direction that fails two and a half times as often, making the confirmation least informative exactly where it is most needed. Rather than deleting it we left it in place, disabled, so it can be validated per direction later without any code being rewritten. A suspended feature that is documented as suspended is more honest than one quietly removed. Its group name and comments say plainly what it is: an experimental filter whose veto rejects trades outright. That is not the preference weight Phase 10 described, and the filter is off in every result reported in this article.
input group "=== Stop loss ==="
input ENUM_SL_MODE     InpSLMode          = SL_WIDE;        // Stop loss mode
input double           InpSL_R_Up         = 0.60;           // UP stop, in R below the boundary
input double           InpSL_R_Down       = 1.50;           // DOWN stop, in R above the boundary
input double           InpSL_R_Aggressive = 0.50;           // Aggressive mode stop, in R
input double           InpSLFloorATR      = 0.50;           // Minimum stop distance (x ATR)
input double           InpSLSpreadMult    = 3.0;            // Minimum stop distance (x spread)

input group "=== Take profit and exits ==="
input double           InpTP_R_Up         = 0.85;           // UP target, in R from breakout price
input double           InpTP_R_Down       = 0.30;           // DOWN target, in R from breakout price
input double           InpDeadManR        = 0.25;           // Dead-man: close back inside by this R
input int              InpTrailStartBars  = 16;             // Start trailing after this many bars
input double           InpTrailATR        = 1.50;           // Trail distance (x ATR)
input int              InpMaxBarsInTrade  = 32;             // Hard exit after this many bars
input string           InpSessionEndExit  = "21:45";        // Hard session-end close HH:MM

input group "=== Risk and execution ==="
input double           InpRiskPercent     = 0.50;           // Risk per trade (% of balance)
input double           InpDownRiskMult    = 0.60;           // DOWN size multiplier (risk asymmetry)
input double           InpFixedLot        = 0.0;            // Fixed lot (0 = use risk %)
input bool             InpSkipBelowMinLot = false;          // Skip if risk lot < broker minimum (false = use minimum and log)
input int              InpSlippage        = 20;             // Deviation in points
input long             InpMagic           = 20260924;       // Magic number
input bool             InpVerbose         = true;           // Print decisions to the journal
The stop and target parameters are separated by direction because Phase 8 measured two different animals. UP breakouts drift: favorable excursion runs to a median of 0.78 R, adverse excursion stays at 0.46 R, and retests hold 89% of the time. DOWN breakouts fight: favorable excursion reaches only 0.54 R, adverse excursion runs to 0.70 R, and barely half the retests hold. A single symmetric configuration would have to compromise between the two and would serve neither. The values shown reflect that asymmetry directly—the UP side takes a tighter stop against a larger target, while the DOWN side needs room to breathe against a target it can realistically reach.
The body gate is implemented at 0.80 rather than the 0.79 quoted in Phase 10; Phase 7 showed the two thresholds perform identically, so the change is cosmetic, but it is a change. And the specific pair-0.60 and 0.85 for UP, and 1.50 and 0.30 for DOWN—are management choices informed by the asymmetry, not levels the dataset measured. The DOWN pair in particular needs a high strike rate to pay for itself, and the 0.60 risk multiplier reduces the size of that bet without changing its sign.
The floors are the one place where the numbers do not come from the dataset. A stop must clear the spread and the broker's minimum stop distance regardless of what the research says, so the ATR floor and spread multiple are engineering constraints. Marking them as such in the comments keeps the distinction visible to anyone reading the code later, including ourselves.
The state structures
//+------------------------------------------------------------------+
//| Structures                                                       |
//+------------------------------------------------------------------+
struct RangeInfo
  {
   bool     valid;
   datetime startTime;
   datetime endTime;
   double   high;
   double   low;
   double   size;
   int      bars;
   double   atr;
   double   prevDayHigh;
   double   prevDayLow;
   int      barsSinceEnd;
   int      trades;
   bool     brokeUp;
   bool     brokeDown;
  };

struct PendingEntry
  {
   bool     active;
   int      dir;          // +1 up, -1 down
   double   brkPrice;     // close of the breakout bar (research anchor)
   double   boundary;     // range edge that was broken
   double   rUnit;        // range width in price
   double   atr;
   double   sl;
   double   tp;
   double   sizeMult;
   int      barsAfterRange;
  };

struct TradeState
  {
   bool     active;
   int      dir;
   double   boundary;
   double   rUnit;
   double   atr;
   double   brkPrice;
   int      barsInTrade;
   datetime openBar;
  };
The structures carry the decision across time. 'PendingEntry' exists because the decision and the execution happen on different bars: everything is computed when the breakout bar closes, then held until the next bar opens. Storing the fully formed stop and target rather than re-computing them at execution time guarantees that the trade we place is the trade we evaluated, even if the market gaps overnight or volatility shifts between the two bars.
'TradeState' keeps the research context alive for the duration of the position. The boundary, the range width and the ATR all belong to a range that will be overwritten when the next session begins, but the dead-man exit and the trail both need them. Copying the values into the trade state rather than reading the live globals is the same discipline that made the logger's frozen range copy necessary in Part 1, applied to a live position instead of a logged event.
Entry evaluation
//+------------------------------------------------------------------+
//| Entry evaluation — every gate traces to a Part 1 finding         |
//+------------------------------------------------------------------+
bool EvaluateEntry(const int dir, const MqlRates &b, PendingEntry &out)
  {
   ZeroMemory(out);

   double boundary = (dir > 0) ? g_range.high : g_range.low;

   //--- Gate 1: location versus prior-day structure, measured at the range edge.
   //--- Positive = headroom still exists before the prior-day level.
   double distPrevPts = (dir > 0)
                        ? Pts(g_range.prevDayHigh - g_range.high)
                        : Pts(g_range.low - g_range.prevDayLow);

   if(distPrevPts > InpDistPrevExclPts)
     {
      g_rejExcl++;
      if(InpVerbose)
         PrintFormat("Reject %s at %s: distance %.0f pts exceeds exclusion zone",
                     (dir > 0 ? "UP" : "DOWN"), TS(b.time), distPrevPts);
      return false;
     }

   if(distPrevPts > InpDistPrevMaxPts)
     {
      g_rejDist++;
      if(InpVerbose)
         PrintFormat("Reject %s at %s: distance %.0f pts outside entry zone (<= %.0f)",
                     (dir > 0 ? "UP" : "DOWN"), TS(b.time), distPrevPts, InpDistPrevMaxPts);
      return false;
     }

   //--- Gate 2: breakout candle decisiveness. Body, not size.
   double candle = b.high - b.low;
   if(candle <= 0.0)
      return false;
   double bodyRatio = MathAbs(b.close - b.open) / candle;

   if(bodyRatio < InpBodyRatioMin)
     {
      g_rejBody++;
      if(InpVerbose)
         PrintFormat("Reject %s at %s: body ratio %.2f below %.2f",
                     (dir > 0 ? "UP" : "DOWN"), TS(b.time), bodyRatio, InpBodyRatioMin);
      return false;
     }

   //--- Experimental hard filter: penetration depth. Off in every reported test.
   //    The veto is a hard reject, not the Phase 10 preference weight.
   double brkDist    = (dir > 0) ? (b.close - g_range.high) : (g_range.low - b.close);
   double brkDistATR = brkDist / g_range.atr;

   if(InpUseDistATR && brkDistATR <= InpDistATRVeto)
     {
      g_rejConfirm++;
      if(InpVerbose)
         PrintFormat("Reject %s at %s: penetration %.2f ATR at or below veto level",
                     (dir > 0 ? "UP" : "DOWN"), TS(b.time), brkDistATR);
      return false;
     }
One detail here deserves to be stated plainly, because it is the kind of thing that quietly invalidates a study. The Phase 10 proposal described the location gate as measuring from the breakout price, but the feature actually recorded in the dataset—and therefore the feature that produced the 54.5% success and 9.1% failure figures—is measured from the range edge. Those are different numbers, and the breakout price is always further past the level than the edge is. The code implements the range-edge version, because implementing the other one would mean testing a rule the evidence never evaluated.
The sign convention follows the logger. A positive distance means the range still has headroom before reaching the prior-day level on the breakout side; a negative distance means the range has already taken that level out. Winners clustered at a median of −39 points and failures at +330, so the gate admits ranges that sit at or past prior structure and rejects those floating in empty interior structure. The two things about it are worth stating. The +400 exclusion cannot change a decision-anything above +50 is already rejected—and exits only so the journal can separate "outside the zone" from "nowhere near structure". And the gate has no lower bound: a range that has taken the prior-day level out by any distance is admitted, a case the dataset never examined on its own.
The second gate is deliberately measuring decisiveness rather than magnitude. Phase 6 found candle size, in both raw points and ATR units, to be worthless as a separator, while body ratio widened the gap at every quartile. Counting the rejections separately in 'g_rejDist,'' 'g_rejExcl,' and 'g_rejBody' costs almost nothing and means the end-of-run summary can tell us which gate is doing the filtering—information that matters if the EA ever stops trading entirely. One qualification on the suspended confirmation. With InpUseDistATR switched on, the 0.25 ATR veto rejects the trade outright. That makes it a hard gate, not the preference weight Phase 10 recommended; only the 0.50 ATR upgrade behaves as a weight. We kept it as an experimental switch, and it is off in every backtest in this article, so it has no effect on the results shown. Separately, the 0.05 ATR buffer in the breakout test is itself a minimum penetration requirement, but it is the same tolerance the logger used when recording the data rather than a new filter.
Timing as a weight
//+------------------------------------------------------------------+
//| Timing preference — Phase 9 evidence as a size multiplier        |
//+------------------------------------------------------------------+
double TimingMultiplier(const int barsAfter, bool &blocked)
  {
   blocked = false;
   if(InpTimePolicy == TIME_OFF)
      return 1.0;

   bool contested = (barsAfter >= 7 && barsAfter <= 14);

   if(InpTimePolicy == TIME_GATE && contested)
     {
      blocked = true;
      return 0.0;
     }

   if(barsAfter <= 2)
      return InpMultImmediate;
   if(barsAfter >= InpAnchorBarsFrom && barsAfter <= InpAnchorBarsTo)
      return InpMultAnchor;
   if(contested)
      return InpMultContested;
   return InpMultLate;
  }
Phase 9 concluded that time deserves preference grading rather than hard filters, and this function is what that conclusion looks like in code. The contested 7-to-14 bar zone, with its 60% failure rate, gets 40% of normal size; the 3-to-6 bar anchor gets full size; the edges get 60%. A trade in a bad time window still happens, but it risks less, which is a genuinely different behavior from blocking it and is the one the evidence supports.
The three-way policy enum exists because a single sample of roughly twelve events per bucket is not strong enough to settle the question. 'TIME_OFF' gives the baseline, 'TIME_WEIGHT' applies the preference, and 'TIME_GATE' tests the hard block. Building all three in costs a dozen lines and means the question can be answered later with data rather than argued about now.
   //--- Timing preference
   bool blocked = false;
   double timeMult = TimingMultiplier(g_range.barsSinceEnd, blocked);
   if(blocked)
     {
      g_rejTime++;
      if(InpVerbose)
         PrintFormat("Reject %s at %s: contested timing zone (%d bars after range)",
                     (dir > 0 ? "UP" : "DOWN"), TS(b.time), g_range.barsSinceEnd);
      return false;
     }

   //--- Size multipliers: timing preference, direction risk asymmetry,
   //    and the optional confirmation as an upgrade rather than a gate.
   double sizeMult = timeMult;
   if(dir < 0)
      sizeMult *= InpDownRiskMult;
   if(InpUseDistATR && brkDistATR >= InpDistATRConfirm)
      sizeMult *= 1.20;
The multiplier is applied inside 'EvaluateEntry', between the entry gates and the stop construction. The blocked flag only matters under TIME_GATE; with the default TIME_WEIGHT it is never set, so every trade that passes the gates is sized rather than refused. The DOWN multiplier and the optional confirmation upgrade then scale the timing value, so the number 'CalcLot' receives already carries all three adjustments.
Stop and target construction
   //--- Stop loss: anchored on the boundary, wide enough to survive a holding retest.
   double slR = (InpSLMode == SL_AGGRESSIVE)
                ? InpSL_R_Aggressive
                : ((dir > 0) ? InpSL_R_Up : InpSL_R_Down);

   double slDist = slR * g_range.size;

   //--- Floors: volatility floor and spread floor. Execution safety, not evidence.
   double spreadPrice = (double)SymbolInfoInteger(_Symbol, SYMBOL_SPREAD) * _Point;
   double floorATR    = InpSLFloorATR * g_range.atr;
   double floorSpread = InpSLSpreadMult * spreadPrice;
   double stopsLevel  = (double)SymbolInfoInteger(_Symbol, SYMBOL_TRADE_STOPS_LEVEL) * _Point;

   slDist = MathMax(slDist, floorATR);
   slDist = MathMax(slDist, floorSpread);
   slDist = MathMax(slDist, stopsLevel * 1.5);

   //--- Take profit: anchored on the breakout price, direction-specific R multiple.
   double tpR    = (dir > 0) ? InpTP_R_Up : InpTP_R_Down;
   double tpDist = tpR * g_range.size;
   tpDist = MathMax(tpDist, stopsLevel * 1.5);

   out.active         = true;
   out.dir            = dir;
   out.brkPrice       = b.close;
   out.boundary       = boundary;
   out.rUnit          = g_range.size;
   out.atr            = g_range.atr;
   out.sizeMult       = sizeMult;
   out.barsAfterRange = g_range.barsSinceEnd;
   out.sl             = (dir > 0) ? (boundary - slDist) : (boundary + slDist);
   out.tp             = (dir > 0) ? (b.close + tpDist)  : (b.close - tpDist);

   if(InpVerbose)
      PrintFormat("Accept %s at %s | dist %.0f pts | body %.2f | pen %.2f ATR | %d bars after | size x%.2f",
                  (dir > 0 ? "UP" : "DOWN"), TS(b.time),
                  distPrevPts, bodyRatio, brkDistATR, g_range.barsSinceEnd, sizeMult);

   return true;
  }
The two levels are anchored on different references, and the difference is not arbitrary. The stop hangs from the boundary, because everything the data says about adverse movement—the 0.30 R healthy retest, the 0.82 R failing retest—is measured relative to the broken level. Anchoring the stop there means a breakout that closes barely past the line automatically gets a tighter effective leash than one that closes a full ATR beyond it, which is correct: the second trade has already used up some of its room.
The target hangs from the breakout price, because favorable excursion in the dataset was measured from exactly that point. Anchoring the target on the boundary instead would shift every target by the penetration distance and quietly break the correspondence with the MFE distribution that justified the R multiple in the first place. Both levels are expressed in R—the range width—because that is the unit the logger normalized everything to. R always means range width in this article, never risk: a stop of 1.50 R is one and half range widths away, not one and half units of risk.
Position sizing
//+------------------------------------------------------------------+
//| Position sizing                                                  |
//+------------------------------------------------------------------+
double CalcLot(const double slDistance, const double sizeMult)
  {
   double minLot  = SymbolInfoDouble(_Symbol, SYMBOL_VOLUME_MIN);
   double maxLot  = SymbolInfoDouble(_Symbol, SYMBOL_VOLUME_MAX);
   double lotStep = SymbolInfoDouble(_Symbol, SYMBOL_VOLUME_STEP);

   if(InpFixedLot > 0.0)
      return MathMin(MathMax(InpFixedLot, minLot), maxLot);

   double tickValue = SymbolInfoDouble(_Symbol, SYMBOL_TRADE_TICK_VALUE);
   double tickSize  = SymbolInfoDouble(_Symbol, SYMBOL_TRADE_TICK_SIZE);
   if(tickValue <= 0.0 || tickSize <= 0.0 || slDistance <= 0.0)
      return minLot;

   double riskMoney  = AccountInfoDouble(ACCOUNT_BALANCE) * (InpRiskPercent / 100.0) * sizeMult;
   double lossPerLot = (slDistance / tickSize) * tickValue;
   if(lossPerLot <= 0.0)
      return minLot;

   double rawLot = riskMoney / lossPerLot;
   double lot    = MathFloor(rawLot / lotStep) * lotStep;

   //--- Broker minimum: on wide ranges or small multipliers the risk-based
   //    lot can fall below it, and the minimum then risks more than planned.
   if(lot < minLot)
     {
      double plannedPct = InpRiskPercent * sizeMult;
      double actualPct  = 100.0 * minLot * lossPerLot / AccountInfoDouble(ACCOUNT_BALANCE);
      if(InpSkipBelowMinLot)
        {
         g_minLotSkipped++;
         if(InpVerbose)
            PrintFormat("Skip: risk lot %.4f below minimum %.2f (min lot would risk %.2f%% vs %.2f%% planned)",
                        rawLot, minLot, actualPct, plannedPct);
         return 0.0;
        }
      g_minLotRaised++;
      if(InpVerbose)
         PrintFormat("Min lot used: risk lot %.4f raised to %.2f | actual risk %.2f%% vs %.2f%% planned",
                     rawLot, minLot, actualPct, plannedPct);
      lot = minLot;
     }
   return MathMin(lot, maxLot);
  }
Sizing is where three separate pieces of evidence converge into one number. The 'sizeMult' argument arrives already carrying the timing preference from Phase 9, the DOWN risk multiplier from Phase 8, and the optional confirmation upgrade from Phase 10. Rather than having each of those conditions reach into the lot calculation independently, they are composed into a single multiplier upstream in 'EvaluateEntry', which keeps this function doing one job and makes the composition auditable in the journal line that prints the final multiplier.
Computing the lot from the actual stop distance rather than a fixed pip value matters more here than in a typical EA, because our stop is a proportion of the range and the range varies from 97 to 1,192 points across the dataset. A fixed-distance assumption would mean risking twelve times more on a wide-range day than on a narrow one. Deriving the loss per lot from 'SYMBOL_TRADE_TICK_VALUE' and 'SYMBOL_TRADE_TICK_SIZE' keeps the risk constant in currency terms regardless of which kind of session we are trading.
The broker's minimum lot is the one place where that guarantee can fail. On a wide range, or when the timing and DOWN multipliers stack to a small size, the risk-based lot can fall below the minimum. Raising it to the minimum then risks more than the planned percentage. 'InpSkipBelowMinLot' decides what happens. Left at false, the default used in every reported test, the EA trades the minimum lot and writes the actual and planned risk to the journal. Set to true, it skips the trade instead. Either way the end-of-run summary counts how often it happened, so the excess risk is never silent.
Execution on the following bar
//+------------------------------------------------------------------+
//| Order execution — placed on the bar AFTER the breakout closes    |
//+------------------------------------------------------------------+
void ExecutePending()
  {
   if(!g_pending.active)
      return;

   double ask = SymbolInfoDouble(_Symbol, SYMBOL_ASK);
   double bid = SymbolInfoDouble(_Symbol, SYMBOL_BID);
   double price = (g_pending.dir > 0) ? ask : bid;

   //--- Sanity: the market must not already be at or beyond the stop.
   bool invalid = (g_pending.dir > 0) ? (price <= g_pending.sl) : (price >= g_pending.sl);
   if(invalid)
     {
      if(InpVerbose)
         Print("Pending entry abandoned: price already beyond the planned stop.");
      g_pending.active = false;
      return;
     }

   //--- Sanity: the target must still lie ahead of the market, beyond the
   //    broker's minimum stop distance. Otherwise the signal counts as missed.
   double stopsLevel = (double)SymbolInfoInteger(_Symbol, SYMBOL_TRADE_STOPS_LEVEL) * _Point;
   bool tpInvalid = (g_pending.dir > 0) ? (g_pending.tp <= price + stopsLevel)
                                        : (g_pending.tp >= price - stopsLevel);
   if(tpInvalid)
     {
      g_rejTP++;
      if(InpVerbose)
         Print("Pending entry abandoned: price already at or through the planned target.");
      g_pending.active = false;
      return;
     }

   double slDistance = MathAbs(price - g_pending.sl);
   double lot = CalcLot(slDistance, g_pending.sizeMult);
   if(lot <= 0.0)
     {
      g_pending.active = false;
      return;
     }

   bool ok = (g_pending.dir > 0)
             ? g_trade.Buy(lot, _Symbol, 0.0, g_pending.sl, g_pending.tp, "RB-Evidence")
             : g_trade.Sell(lot, _Symbol, 0.0, g_pending.sl, g_pending.tp, "RB-Evidence");

   if(ok)
     {
      g_entries++;
      g_range.trades++;

      ZeroMemory(g_state);
      g_state.active      = true;
      g_state.dir         = g_pending.dir;
      g_state.boundary    = g_pending.boundary;
      g_state.rUnit       = g_pending.rUnit;
      g_state.atr         = g_pending.atr;
      g_state.brkPrice    = g_pending.brkPrice;
      g_state.barsInTrade = 0;
      g_state.openBar     = iTime(_Symbol, InpTF, 0);

      if(InpVerbose)
         PrintFormat("ENTRY %s %.2f lots at %s | SL %s | TP %s",
                     (g_pending.dir > 0 ? "BUY" : "SELL"), lot,
                     DoubleToString(price, _Digits),
                     DoubleToString(g_pending.sl, _Digits),
                     DoubleToString(g_pending.tp, _Digits));
     }
   else
      PrintFormat("Order failed: retcode %d (%s)", g_trade.ResultRetcode(),
                  g_trade.ResultRetcodeDescription());

   g_pending.active = false;
  }
Placing the order one bar after the decision is the honest implementation of a bar-close trigger, and it introduces a risk that has to be handled explicitly. Between the breakout close and the next open, price may move so far that the planned stop becomes invalid. Entering anyway would produce a trade with a negative expected outcome before it starts, so the sanity check abandons the entry instead. This is a small piece of code that exists purely because we chose to be accurate about when information becomes available rather than convenient.
The target gets the same treatment. A gap at the open can carry price to the target, or so close to it that the broker would refuse the order under its minimum stop distance. Opening anyway would either fail or create a trade with almost no reward left. So the EA treats the signal as missed and drops it, exactly as it does for the stop. It does not recalculate the target or open without one, because either would be a trade the research never described. The summary line counts these cases as 'target already reached'.
Note also that the stop distance used for sizing is recomputed from the actual execution price, while the stop level itself stays exactly where the research put it. The trade is placed at whatever price the market offers, but the risk is measured against the real distance to the real stop, so a slightly unfavorable open reduces the position size rather than silently increasing the risk. One consequence follows. The target stays where the research put it while the fill can be better or worse than the breakout close, so the realized reward-to-risk drifts slightly from the planned one every trade.
Position management
//+------------------------------------------------------------------+
//| Position management                                              |
//+------------------------------------------------------------------+
void CloseOurPosition(const string reason)
  {
   if(!SelectOurPosition())
     {
      g_state.active = false;   // nothing of ours is open
      return;
     }

   ulong  ticket = g_pos.Ticket();
   double profit = g_pos.Profit() + g_pos.Swap() + g_pos.Commission();

   //--- Close the exact ticket, not the symbol: on a hedging account the
   //    symbol form could hit another position. Keep the state active and
   //    retry on the next bar if the close does not go through.
   if(g_trade.PositionClose(ticket, InpSlippage))
     {
      if(profit >= 0.0)
         g_wins++;
      else
         g_losses++;

      if(InpVerbose)
         PrintFormat("EXIT (%s) | ticket %I64u | result %.2f", reason, ticket, profit);

      g_state.active = false;
     }
   else
     {
      g_closeFails++;
      PrintFormat("Close failed (%s) | ticket %I64u | retcode %d (%s) - will retry next bar",
               reason, ticket, g_trade.ResultRetcode(), g_trade.ResultRetcodeDescription());
     }
  }

void ManagePosition(const MqlRates &b)
  {
   if(!SelectOurPosition())
     {
      //--- position closed by SL or TP since the last bar
      if(g_state.active)
        {
         g_state.active = false;
         g_exitBroker++;      // SL or TP; the two are not distinguished here
        }
      return;
     }

   if(!g_state.active)
      return;

   g_state.barsInTrade++;
   int k = g_state.barsInTrade;

   //--- 1. Dead-man exit: the FALSE signature is a close back inside the range.
   double insideLevel = (g_state.dir > 0)
                        ? g_state.boundary - InpDeadManR * g_state.rUnit
                        : g_state.boundary + InpDeadManR * g_state.rUnit;

   bool backInside = (g_state.dir > 0) ? (b.close < insideLevel) : (b.close > insideLevel);
   if(backInside)
     {
      g_exitDeadMan++;
      CloseOurPosition("dead-man: closed back inside range");
      return;
     }

   //--- 2. Session-end close. The live equivalent of the dataset's censoring.
   int mod = MinuteOfDay(b.time);
   if(g_exitMin >= 0 && mod >= g_exitMin)
     {
      g_exitSession++;
      CloseOurPosition("session end");
      return;
     }

   //--- 3. Hard bar limit.
   if(k >= InpMaxBarsInTrade)
     {
      g_exitTime++;
      CloseOurPosition("max bars in trade");
      return;
     }

   //--- 4. Trail only after winner latency has elapsed (Phase 3: winners need ~14 bars).
   if(k >= InpTrailStartBars)
     {
      double trailDist = InpTrailATR * g_state.atr;
      double curSL     = g_pos.StopLoss();
      double curTP     = g_pos.TakeProfit();
      double newSL     = (g_state.dir > 0) ? (b.close - trailDist) : (b.close + trailDist);

      bool improve = (g_state.dir > 0) ? (newSL > curSL) : (newSL < curSL);

      //--- never trail past the current market, and respect the broker stop distance
      double stopsLevel = (double)SymbolInfoInteger(_Symbol, SYMBOL_TRADE_STOPS_LEVEL) * _Point;
      double bid = SymbolInfoDouble(_Symbol, SYMBOL_BID);
      double ask = SymbolInfoDouble(_Symbol, SYMBOL_ASK);
      bool   safe = (g_state.dir > 0) ? (newSL < bid - stopsLevel) : (newSL > ask + stopsLevel);

      if(improve && safe)
        {
         if(g_trade.PositionModify(g_pos.Ticket(), NormalizeDouble(newSL, _Digits), curTP))
            if(InpVerbose)
               PrintFormat("Trail | bar %d | SL -> %s", k, DoubleToString(newSL, _Digits));
        }
     }
  }
The order of these four checks is the design. The dead-man exit runs first because closing back inside the range is the defining behavior of a FALSE event, and Phase 12 assigned it the job that the tight stop was originally meant to do. The wide stop exists to survive a healthy retest rather than to insure the tail, so this is what handles the original failure: the position closes on evidence of the failure pattern rather than on a price level that half of all events reach anyway. The 0.25 R depth is a chosen level, not a measured breakpoint.
The session-end exit is the closest live analogue of something that only existed as a data artifact. The two are not equivalent: censoring ends an observation, while a forced close realizes a profit or a loss. In the logger, events that ran past the tracking horizon were marked truncated and labelled NEUTRAL—right-censored observations. A live position has no such label; it simply stays open. Closing at a fixed time is the only way to reproduce that boundary, and it is worth flagging that the dataset cannot validate the specific time chosen. It is an assumption, and the code comment says so.
The trail starting at bar 16 is a direct correction from Phase 12. The original proposal had an exit rule firing at 8 to 10 bars, which would have culled precisely the slow winners that the 14-bar median describes. Waiting until winner latency has elapsed before tightening anything means the trail protects mature profits instead of truncating developing ones. The trail also checks the broker's stop level and refuses to move the stop past the current market, which is the kind of defensive detail that turns a working idea into a working EA.
The close and trail act on the position's ticket from 'SelectOurPosition', not on the symbol, so on a hedging account they cannot touch another position that happens to share it. And a close is only treated as done when the server confirms it. If 'PositionClose' fails, the trade state stays active, the failure is logged with its retcode, and the exit is retried on the next bar rather than being silently abandoned.
Per-bar orchestration
//+------------------------------------------------------------------+
//| Per-bar logic                                                    |
//+------------------------------------------------------------------+
void ProcessBar(const MqlRates &b, const int shift)
  {
   //--- 1. Manage what is already open, using the bar that just closed.
   ManagePosition(b);

   //--- 2. Fire any entry decided on the previous bar's close.
   if(g_pending.active && !HasPosition())
      ExecutePending();
   else
      g_pending.active = false;

   //--- 3. Window edge detection.
   int  mod   = MinuteOfDay(b.time);
   bool inWin = InWindow(mod);

   if(inWin && !g_prevInWin)
     {
      StartRange(b);
      g_prevInWin = true;
      return;
     }

   if(inWin && g_prevInWin)
     {
      UpdateRange(b);
      g_prevInWin = true;
      return;
     }

   if(!inWin && g_prevInWin)
      FreezeRange(shift);

   g_prevInWin = false;

   if(!g_range.valid)
      return;

   g_range.barsSinceEnd++;

   //--- 4. Hunt for a breakout worth taking.
   if(g_range.barsSinceEnd > InpBreakWindowBar)
      return;
   if(g_range.trades >= InpMaxTradesPerDay)
      return;
   if(HasPosition() || g_pending.active)
      return;

   double buffer  = InpBufferATR * g_range.atr;
   double upLevel = g_range.high + buffer;
   double dnLevel = g_range.low  - buffer;

   int dir = 0;
   if(!g_range.brokeUp && b.close > upLevel)
      dir = 1;
   else if(!g_range.brokeDown && b.close < dnLevel)
      dir = -1;

   if(dir == 0)
      return;

   if(dir > 0)
      g_range.brokeUp = true;
   else
      g_range.brokeDown = true;

   PendingEntry pe;
   if(EvaluateEntry(dir, b, pe))
      g_pending = pe;
  }
Management runs before execution, and execution runs before the search for a new breakout. That sequence prevents the EA from opening a second position on the same bar it closes the first, and it guarantees that a pending entry is either fired or discarded before anything new can overwrite it. The else branch that clears the pending flag is doing quiet but important work: if a position is somehow already open when the pending entry comes due, the entry is dropped rather than queued, because a trade that fires a bar late is no longer the trade the evidence described.
Everything runs on closed bars only. The window edge detection, the range building and the breakout search are all identical in structure to the logger from Part 1, which is deliberate. If the EA built its ranges differently from the instrument that produced the evidence, none of the thresholds would mean anything. The strongest guarantee that this Expert Advisor is trading the strategy we studied is that the code which defines the range is the same code we studied it with.
One consequence of that symmetry needs stating plainly. 'ProcessBar' marks a direction as broken the moment a bar closes beyond the edge, before 'EvaluateEntry' runs. If the filters reject that breakout, the direction stays used up for the rest of the range, and a later close beyond the same edge is ignored. This is deliberate. The logger recorded only the first breakout in each direction per range, so every threshold in this article was measured on first breakouts. Second and third attempts were never studied, and re-arming the direction after a rejection would let the EA trade events the evidence says nothing about. The opposite direction stays available, so a rejected UP breakout does not block a later DOWN one, within the limit of one trade per range.
Backtest
Part 1's evidence was gathered on GBPUSD Tokyo sessions from January 2025 through August 2026. To keep the period the rules came from apart from the period that tests them, the GBPUSD backtest is reported as two separate runs that do not overlap. A third run on EURUSD checks whether the rules transfer to an instrument the research never used.
Test conditions
Every run used the same environment and the EA's default inputs, so any difference between runs comes from the data rather than the setup.
| Settings | Value |
|---|---|
| Broker | JustMarkets-Demo (Just Global Markets Ltd.) |
| Account | Demo, hedging, USD |
| Leverage | 1:100 |
| Symbols and timeframe | GBPUSD and EURUSD, M15 |
| Modelling | "Every tick based on real ticks" selected for every run; the quality actually achieved differs by run (see the next table) |
| Execution delay | Zero latency, ideal execution |
| Spread | Broker's variable spread, as recorded in the tick history |
| Commission | Spread-only account |
| Initial deposit | $10,000 |
| Position sizing | 0.50% risk per trade (InpRiskPercent), DOWN trades × 0.60 |
| EA inputs | Defaults as listed in the Inputs section |
| Session window | Tokyo range, 02:00–10:00 broker server time (InpServerOffsetHr = 0) |
The Tokyo range is built from the 02:00 to 10:00 window on the broker's server clock, and the session-end exit at 21:45 uses the same clock. 'InpServerOffsetHr' shifts both the start and the end by whole hours, so InpServerOffsetHr = 1 would make the window 03:00–11:00. It was left at 0 for every run here.
The modelling mode was the same for every run, but the data behind it was not. The tester reports the history quality it achieved, and that number matters more than the mode selected:
| Run | Period | History quality and tick source |
|---|---|---|
| GBPUSD in-sample | 2025.01.01–2026.08.31 | 99% — real ticks from the broker |
| GBPUSD out-of-sample | 2022.01.01–2024.12.31 | 0% — ticks generated from M1 bars; the server holds no real ticks for these years |
| EURUSD | 2019.01.01–2026.10.16 | 22% — a mix of real ticks where the broker holds them and ticks generated from M1 bars, mostly generated over the early years |
So only the in-sample run was modelled on real ticks. The out-of-sample run used ticks the tester generated from one-minute bars, and its results should be read that way.
In-sample and out-of-sample
The in-sample run covers 1 January 2025 to 31 August 2026, the exact window the rules were derived from. The out-of-sample run covers 1 January 2022 to 31 December 2024. Those three years come before the research period, and none of their data was used to set any threshold.
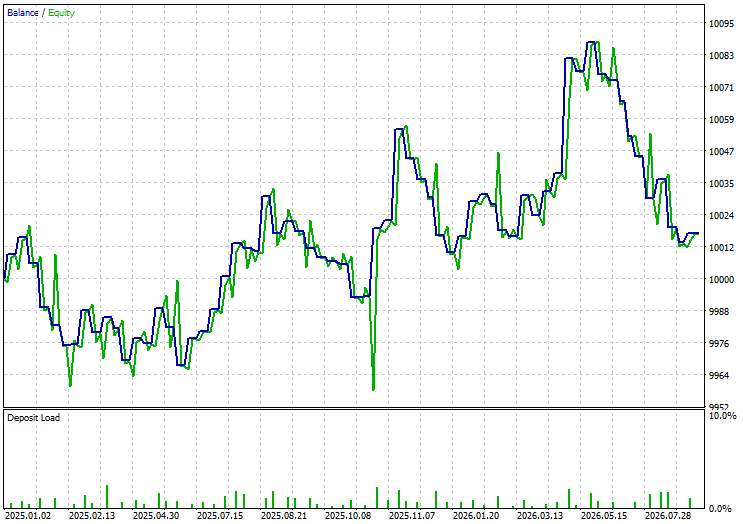
GBPUSD, equity curve, in-sample (Jan 2025 to Aug 2026):
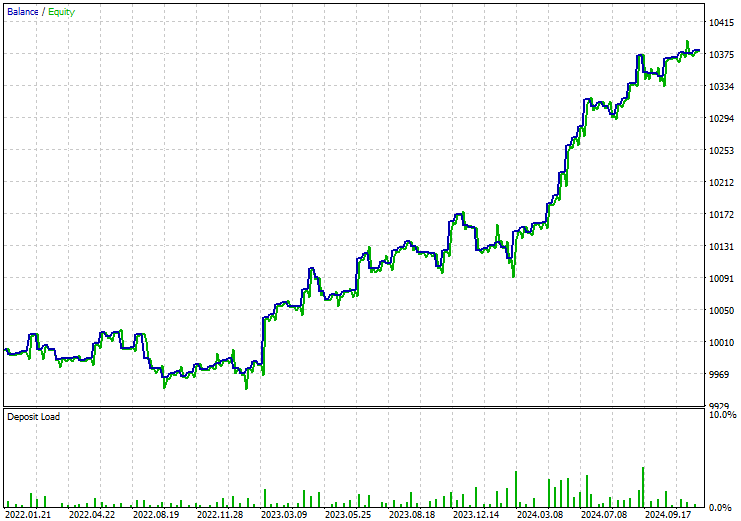
GBPUSD, equity curve, out-of-sample (Jan 2022 to Dec 2024):
Please refer to the table below for backtest summary of the two runs side by side:
| Metric | In-sample 2025.01–2026.08 | Out-of-sample 2022.01–2024.12 |
|---|---|---|
| Total trades | 65 | 107 |
| Net profit | +$16.70 (+0.17%) | +$378.88 (+3.79%) |
| Expected payoff | +$0.26 | +$3.54 |
| Maximum drawdown | 0.76% | 0.82% |
| Profit factor | 1.06 | 1.99 |
| Avg win / avg loss | 1.40 | 1.19 |
The in-sample run breaks even. A profit factor of 1.06 over 65 trades is not an edge. This is less strange than it looks. The rules were derived from how breakout events resolved, not from the P&L of trading them, so the in-sample period was never fitted for profit. It also means the event-level separation found in Part 1 does not by itself turn into money once stops, targets, spread and position management are applied.
The out-of-sample run is profitable in simulation, with a profit factor of 1.99 and a drawdown under one percent. It is also the weakest-modelled run in the article, and two cautions limit what it can show. First, its ticks were generated from M1 bars. Intrabar order matters for this EA: the DOWN target is only 0.30 R away, and a stop and target touched inside the same minute are resolved by the tester's assumptions, not by real prices. Generated ticks may flatter the result, and we have not confirmed it on real ticks or in a forward test. Second, the profit is not spread evenly across the years. The out-of-sample profit is therefore preliminary and depends on the modelling mode; it is not evidence of an edge on its own.
Year by year
The table splits all three runs by calendar year. Drawdown is the largest peak-to-trough fall in equity within that year, and expectancy is the average result per trade.
| Run | Year | Trades | Net profit | Profit factor | Max drawdown | Expectancy |
|---|---|---|---|---|---|---|
| GBPUSD out-of-sample | 2022 | 30 | −$24.32 | 0.82 | 0.74% | −$0.81 |
| GBPUSD out-of-sample | 2023 | 41 | +$196.03 | 2.61 | 0.72% | +$4.78 |
| GBPUSD out-of-sample | 2024 | 36 | +$207.17 | 2.66 | 0.82% | +$5.75 |
| GBPUSD in-sample | 2025 | 39 | +$36.70 | 1.24 | 0.75% | +$0.94 |
| GBPUSD in-sample | 2026 (Jan–Aug) | 26 | −$20.00 | 0.85 | 0.76% | −$0.77 |
| EURUSD | 2019 | 18 | −$26.20 | 0.70 | 0.80% | −$1.46 |
| EURUSD | 2020 | 31 | +$3.44 | 1.03 | 0.47% | +$0.11 |
| EURUSD | 2021 | 42 | −$178.06 | 0.45 | 2.05% | −$4.24 |
| EURUSD | 2022 | 29 | −$35.71 | 0.73 | 0.70% | −$1.23 |
| EURUSD | 2023 | 44 | +$25.99 | 1.16 | 0.65% | +$0.59 |
| EURUSD | 2024 | 34 | +$55.65 | 1.42 | 0.63% | +$1.64 |
| EURUSD | 2025 | 37 | −$86.14 | 0.60 | 1.62% | −$2.33 |
| EURUSD | 2026 (Jan–Oct) | 26 | +$7.19 | 1.07 | 0.62% | +$0.28 |
On GBPUSD, two years carry the whole record: 2023 and 2024 made $403 between them, while the other three years net to −$7.62. The rules do not produce a steady edge. They produce one that depends on the market regime, and 2023 to 2024 suited them better than the period they were measured in. EURUSD shows the same pattern at a lower level: 2023 and 2024 are its two best years, and 2021 and 2025 its worst.
Statistical uncertainty
Around a hundred trades is a small sample, so each result was resampled. The bootstrap draws 10,000 new trade sets, with replacement, from each run's own trade results. It gives a 95% interval for the expectancy per trade and the profit factor. The Monte Carlo test shuffles the order of the same trades 10,000 times and records the closed-trade drawdown each time. Both use Python's random module with seed 42, and each run gets its own fresh generator, so the results do not depend on the order the files are processed. The trade lists used here (trades_GBPUSD_IS.csv, trades_GBPUSD_OOS.csv, trades_EURUSD.csv) and the script that produces this table (rb_resampling.py) are attached, so every figure below can be reproduced exactly.
| Statistics | GBPUSD in-sample | GBPUSD out-of-sample | EURUSD |
|---|---|---|---|
| Trades | 65 | 107 | 261 |
| Expectancy per trade, 95% CI | −$2.46 to +$3.23 | +$0.78 to +$6.34 | −$2.23 to +$0.49 |
| Profit factor, 95% CI | 0.55 to 1.94 | 1.17 to 3.41 | 0.60 to 1.12 |
| Resamples with expectancy ≤ 0 | 43% | 0.6% | 90% |
| Monte Carlo drawdown, median | $85 (0.9%) | $68 (0.7%) | $319 (3.2%) |
| Monte Carlo drawdown, 95th percentile | $131 (1.3%) | $110 (1.1%) | $418 (4.2%) |
The in-sample interval comfortably includes zero. The out-of-sample interval does not, but that only describes the simulated trades. It cannot correct for how those trades were modelled, so it inherits the generated-tick caution above. It should also be read as preliminary for two further reasons: the year-to-year swings shown above, and the bootstrap's assumption that trades are independent when they clearly cluster by regime. The Monte Carlo drawdowns stay close to the observed ones, so the reported drawdown is not a lucky ordering of trades.
EURUSD: transfer to an unused instrument
EURUSD never entered the research, so the whole run is unseen for that instrument. It covers 1 January 2019 to 16 October 2026.
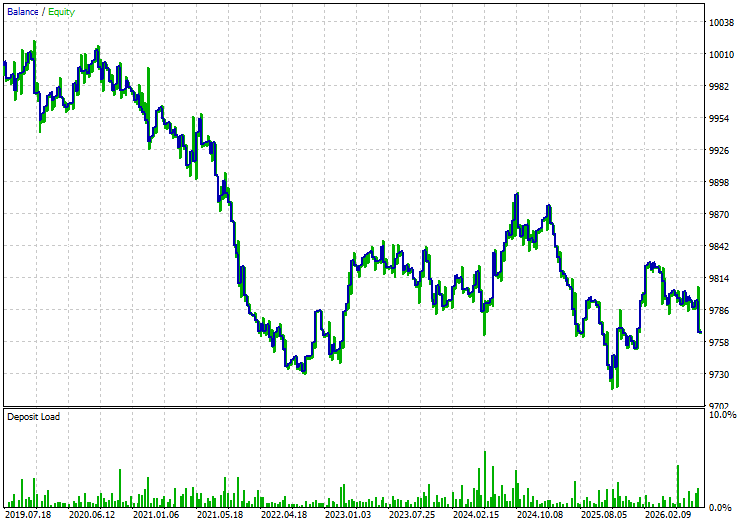
EURUSD, equity curve (Jan 2019 to Oct 2026):
| Metric | EURUSD 2019.01–2026.10 |
|---|---|
| Total trades | 261 |
| Net profit | −$233.84 (−2.34%) |
| Profit factor | 0.82 |
| Avg win / avg loss | 0.81 |
| Max equity drawdown | 3.04% |
On EURUSD the same rules lose slowly. Losing trades are larger than winners, and 90% of bootstrap resamples have a negative expectancy. Nothing about the EA was changed between the runs, only the instrument, so the difference is the market and not the code. Its best years, 2023 and 2024, are the same two years that carried GBPUSD, which supports the regime reading above. The Part 1 evidence was collected on GBPUSD, and the honest expectation was always that its specific thresholds, the ±50-point structural zone, the 0.80 body ratio, the direction-specific stops, describe GBPUSD's Tokyo behavior and need not describe EURUSD's. The EURUSD run is what it looks like when a strategy is applied outside the conditions it was measured under.
What the backtest shows
The stop, target and dead-man levels were left at their defaults. These results demonstrate that one configuration. They do not show that 0.60, 0.85, 1.50, 0.30 and 0.25 R are the best values. Their sensitivity was not tested, so the result should be read as one configuration rather than a tuned optimum.
Taken together, the runs support a narrow claim. On GBPUSD the rules were profitable in a simulation of three years they never saw. That simulation ran on ticks generated from M1 bars, it has not been confirmed on real ticks or in a forward test, and two strong years did most of the work. The rules broke even on the real-tick period they came from and did not transfer to EURUSD. That is weak, preliminary evidence of a regime-dependent edge, and it depends on the modelling mode. It is not proof of a robust one. The numbers are not universal constants, they are properties of one market in one session, and transplanting them elsewhere means running the whole evidence pipeline again on that market rather than reusing GBPUSD's answers.
Conclusion
Across two articles we worked deliberately in reverse. We first built an instrument to measure the strategy without trading it, then analyzed the results, and only then wrote the code. Most EA rules are directly traceable to the evidence; where they are not, the exceptions are explicitly named. The execution floors, the dead-man depth and the direction-specific stop and target pairs are engineering or management choices rather than measurements.
The phases that mattered most were the ones that told us we were wrong. Phase 5 refuted volume confirmation, which most of us would have coded without a second thought. Phase 7 exposed ATR as a regime artifact that a half-sample check destroyed. Phase 12 overturned the stop design that Phase 11 had just proposed, catching a corridor that would have exited half of all trades at the worst possible price. None of those corrections would have happened if we had opened MetaEditor first. That is the real argument of this series: strategy drift is not a discipline problem, it is an information problem, and the cure is to gather the information before the code exists to be drifted.
What transfers is the method, not the numbers. The logger here is specific to Range Breakout and the findings are specific to GBPUSD's Tokyo session, but the structure suits any strategy. Define the components, instrument them, record the outcome, separate what is knowable at entry from what is only knowable in hindsight, interrogate the evidence in phases, then stress-test your own proposal before writing a line of trading logic. The honest next step for this particular system is out-of-sample testing on real-tick data and a forward test, because one profitable unseen period, simulated on generated ticks, is the beginning of validation rather than the end of it. If you build one of these for your own strategy, the most useful thing you will find is probably the feature you were certain mattered and the data says does not.
Appendix: The three prompts
10. Define the entry logic. Using only the features classified as safe for entry decisions, propose a complete entry logic for the Range Breakout strategy. Base it strictly on the evidence from our analysis: the primary filter is breakout-side distance to prior-day structure, the secondary filter is candle body ratio, and the optional confirmation is breakout penetration depth. For each condition, state the threshold, the direction it applies (UP, DOWN, or both), and whether it is a hard gate or a preference weight. Explain what the entry trigger is, what bar the trade is placed on, and what price is used as the entry reference. Do not introduce any feature that was not in the dataset or was classified as post-entry. Do not optimize yet.
11. Define stop loss and take profit. Now define the stop loss and take profit logic that is consistent with the entry above and grounded in the dataset findings. For stop loss, consider: the range boundary as a reference, ATR as a sizing unit, and the MAE distribution by outcome group. For take profit, consider: the MFE distribution by outcome group, the R-basis used in the logger (range width), and the time-to-resolution difference between winners and failures. Propose at least two stop loss approaches and two take profit approaches, explain the trade-off of each, and state which pairing is best supported by the data. Flag any assumption that goes beyond what the data can confirm. Do not finalize the EA parameter values yet.
12. Stress-test the logic before coding. Before we write any MQL5 code, stress-test the proposed entry, stop loss, and take profit logic against the known weaknesses in our dataset. Specifically: how does the entry logic behave on DOWN breakouts, which showed twice the adverse excursion and half the retest-hold rate of UP breakouts? Does the stop loss survive the MAE tail events we observed? Does the take profit account for the fact that winners take a median of 14 bars while failures die in 6? Are there any conditions under which the combined logic would produce a trade that is inconsistent with the evidence, for example entering on a late breakout in the 7–14 bar zone that passes the structural filter? Identify any gaps or contradictions, and propose how to handle them. This is the final check before implementation.
| File name | File description |
|---|---|
| Automated Breakout From Logger.mq5 | The complete Range Breakout Expert Advisor, built from the Part 1 evidence. Every input and backtest in the article comes from this file. |
| trades_GBPUSD_IS.csv | Closed-trade list from the GBPUSD in-sample run (2025.01–2026.08): close time, profit and running balance per trade. |
| trades_GBPUSD_OOS.csv | Closed-trade list from the GBPUSD out-of-sample run (2022–2024), same three columns. |
| trades_EURUSD.csv | Closed-trade list from the EURUSD run (2019–2026), same three columns. |
| rb_resampling.py | Python script that reproduces the bootstrap confidence intervals and Monte Carlo drawdowns from the three trade lists, using seed 42. |
Warning: All rights to these materials are reserved by MetaQuotes Ltd. Copying or reprinting of these materials in whole or in part is prohibited.
This article was written by a user of the site and reflects their personal views. MetaQuotes Ltd is not responsible for the accuracy of the information presented, nor for any consequences resulting from the use of the solutions, strategies or recommendations described.