

Efficient Volatility Estimation with Garman–Klass: From Theory to a Percentile-Based Trading Tool in MQL5
 111
 0

Introduction
Volatility is the single most fundamental quantity in trading — it determines position sizing, stop placement, option pricing, and regime classification. Yet the most common volatility measure used in retail trading, close-to-close volatility, uses only one of the four prices each bar records. This is not literally “three-quarters of the information,” since the open, high, and low of a single bar are not four independent observations — the high and low are constrained by the same bar's own price path, and the open is often close to the previous bar's close — but the high and low do carry genuine intrabar information about how far price actually traveled, information close-to-close volatility discards entirely.
This waste has a measurable cost. When volatility is underestimated, positions are oversized for the actual risk. When it is overestimated, opportunities are left on the table. And when a volatility regime shift happens — from quiet consolidation to explosive breakout — a sluggish estimator detects it bars or even sessions too late.
In practice, building a better volatility tool for live trading presents three challenges:
- use OHLC efficiently,
- convert values into regime signals,
- manage state correctly in MQL5 indicator buffers.
First, the estimator must use all available OHLC information efficiently, not just closing prices. Second, raw volatility values must be translated into actionable regime signals — a number that says "volatility is 0.23" is difficult to act on without context about whether that is historically high or low. Third, any regime-detection mechanism that carries state from bar to bar (like a squeeze flag) must handle the recursive bookkeeping correctly in MQL5's indicator buffer system, or the state silently corrupts itself on every new bar.
This article works through all three. We begin with the Garman–Klass (1980) variance estimator, verify its efficiency gain in Python, build a percentile-based squeeze-expansion detection system around it, implement the full indicator in MQL5, and connect it to an Expert Advisor that trades volatility breakouts.
What the Tool Shows You
Before diving into formulas, here is what the finished indicator actually displays and how to read it.
The indicator draws in a separate subwindow below the price chart and shows two lines and two types of arrows. The solid blue line is the annualized Garman–Klass volatility, computed over a rolling window (default 20 bars). When this line rises, the market is becoming more volatile. When it falls, volatility is contracting. Unlike a simple ATR, this line uses all four OHLC prices on every bar, so it responds faster and more accurately to actual price dispersion.
The dashed orange line is a simple moving average of the GK volatility (default 50 bars). It serves as a longer-term visual reference and, in the EA, as a volatility-contraction exit filter; it does not itself drive the squeeze or expansion signals, which are generated from the percentile rank of the GK value rather than from the GK line's position relative to this moving average. When the blue line is well below the orange line, volatility is visually suppressed relative to recent history. When it moves back above the orange line, the chart shows volatility increasing, though the entry signal itself depends on the percentile calculation described next, not on this crossover.
The green upward arrows mark bullish expansion signals. These appear when volatility has been in a squeeze (its percentile rank fell below 30) and then its percentile rank rises above 60, while the closing price is above a directional SMA — suggesting the expansion is happening in an uptrend.
The red downward arrows mark bearish expansion signals. The same squeeze-then-expansion logic applies, but the closing price is below the directional SMA, suggesting a downtrend breakout.
In practical terms, a trader watches for the blue line to compress and flatten (the squeeze phase), then waits for the percentile rank to cross above the expansion threshold, shown by an arrow appearing. The arrow's color tells the direction. This is a pure breakout system — it does not attempt to trade during quiet periods. It sits and waits for the market to compress, then acts when the compression releases.

Figure 1. GKVolatility indicator displayed in a separate subwindow below the price chart.
Discovering the Core Concept
The Problem with Close-to-Close Volatility
The volatility measure used in most technical analysis is the root-mean-square of log returns about a zero mean — not, strictly, a sample standard deviation, since it does not subtract the sample mean return and divides by n rather than n−1:
σ_CC = sqrt( (1/n) × Σ [ln(C_i / C_{i-1})]² ) This uses only the closing price from each bar. The open, high, and low — which contain direct information about intrabar price dispersion — are discarded entirely. From a statistical standpoint, this is wasteful. If the market swings wildly during a session but happens to close near the previous close, close-to-close volatility records almost nothing.
The Garman–Klass Estimator
In 1980, Mark Garman and Michael Klass published "On the Estimation of Security Price Volatilities from Historical Data" in the Journal of Business. They derived a minimum-variance unbiased estimator of the per-bar return variance that uses all four OHLC prices. Because the square-root transform is nonlinear, converting this variance estimator into a volatility figure by taking its square root does not preserve unbiasedness in the strict sense. Their per-bar variance component is:
σ²_GK = 0.5 × ln(H/L)² – (2×ln(2) – 1) × ln(C/O)²
The first term, 0.5 × ln(H/L)², captures the full intrabar range — the high-low spread is an indicator of the extent of price movement observed during the bar, though the true intrabar path may have covered more distance than the high-low range alone captures. The second term, (2×ln(2) – 1) × ln(C/O)², is a correction based on the open-to-close return. The coefficient (2×ln(2) – 1) — approximately 0.3863 — arises from the theoretical properties of Brownian motion and is what makes the estimator minimum-variance under the assumption of zero drift.
Garman-Klass is not the only OHLC-based estimator — Parkinson's (1980) high-low estimator, Rogers-Satchell, and Yang-Zhang are alternatives with different assumptions (Rogers-Satchell tolerates non-zero drift, Yang-Zhang additionally models the overnight gap explicitly); GK is used here because of its simplicity and because Parkinson (1980) and the GK derivation share the same theoretical foundation, but the choice between them depends on what a given instrument's price behavior actually looks like.
To get a rolling volatility estimate over n bars, we average the per-bar components and take the square root:
σ_GK = sqrt( (1/n) × Σ σ²_GK,i × A )
where A is an annualization factor (252 for daily bars, since there are approximately 252 trading days per year).
Theoretical Efficiency
Garman and Klass proved that their estimator achieves a theoretical efficiency of approximately 7.4 times that of the close-to-close estimator. "Efficiency" here means the ratio of variances — a 7.4× efficiency means that for the same number of bars, the GK estimator's error variance is 7.4 times smaller. Equivalently, you would need 7.4 times as many bars with a close-to-close estimator to achieve the same precision as the GK estimator.
This is a theoretical upper bound that assumes continuous Brownian motion with zero drift, no price jumps, and no microstructure noise. Real markets violate all three conditions to some degree — prices move in discrete ticks, jumps occur around news events, and bid-ask bounce introduces noise at short horizons — so, in practice, with finite samples and real market microstructure, the observed efficiency gain is lower than the theoretical bound, though still substantial.
The Zero-Drift Assumption
The key assumption underlying the GK estimator is that the price process has zero drift within each bar. In other words, it assumes the expected return over one bar is zero. When this assumption is violated — as it is during strong trends or across overnight gaps — the estimator can produce biased results.
Overnight gaps are particularly problematic. The GK formula only ever uses prices from within a single bar — the open, high, low, and close of that bar — so the gap between the previous bar's close and the current bar's open never enters the calculation at all. GK simply ignores any gap that is not reflected inside the current bar's own high-low range; it does not fold the gap into the open-to-close term or handle it in any other way. For instruments with large overnight gaps (like individual equities), this means the estimator can systematically understate true volatility, since a real source of price movement is invisible to it. This is a genuine limitation that should be kept in mind.
For instruments that trade nearly continuously (major forex pairs, for example), overnight gaps are typically small and the zero-drift assumption is a reasonable approximation within a single bar.
Testing the Hypothesis in Python
Before writing any MQL5 code, we verified the GK estimator's properties using synthetic data in Python. This verification had two phases, and the first phase produced a genuinely misleading result that is worth disclosing.
Phase 1: Efficiency Verification
We generated 10,000 bars of synthetic geometric Brownian motion with known volatility (σ = 0.20 annualized). We simulated the full intrabar path at fine resolution to record each bar's high and low. We then computed close-to-close and GK volatility over a 20-bar rolling window. The GK estimator's mean squared error was approximately 2.47 times smaller than the close-to-close estimator's in one illustrative run — a meaningful improvement, though below the theoretical 7.4× bound due to finite-sample effects and the specific simulation parameters. Because the comparison uses overlapping rolling windows, successive MSE observations are not statistically independent, so this figure should be read as a directional confirmation of the efficiency gain rather than a precise, independent-sample estimate of its size.Phase 1 Failure: Naive Regime Detection
In the same phase, we attempted to use a simple GK-above-MA crossover as a volatility regime detector — classifying bars where GK exceeded its own moving average as "high volatility" and bars below as "low volatility." This failed completely, with approximately 50% of expansion signals appearing in both genuinely low-volatility and high-volatility regimes.
The reason is straightforward: within any stable volatility regime, the GK value oscillates around its own moving average roughly equally. A crossover tells you that volatility is above its recent average, but not whether that average itself is historically high or low. The crossover signal is regime-relative, not regime-absolute.
Phase 2: Percentile-Based Detection
The fix was to replace the crossover with a percentile rank. Instead of asking "is GK above its MA?", we ask "where does the current GK value sit within the distribution of the last 100 bars?" A percentile rank below 30 means current volatility is in the bottom 30% of recent history — a genuine squeeze, regardless of what the MA happens to be doing. A percentile rank above 60 means volatility has expanded into the upper portion of recent history.
We then tested a squeeze-expansion breakout strategy: enter a trade when volatility transitions from below the 30th percentile to above the 60th percentile, using a simple moving average of price for direction. Over 15 independent trials on synthetic trending data (geometric Brownian motion with a small positive drift), this produced a 59.4% win rate. Win rate alone does not establish a trading edge — it says nothing about payoff ratio, expectancy, drawdown, or the effect of spread, commission, and slippage, none of which were modeled in this synthetic test. What the result does confirm is narrower: the regime-detection mechanism identified volatility expansions that were, on this synthetic trending series, more often followed by a favorable move than an unfavorable one. The real-symbol backtests in the Testing section below are what should be judged on trading-performance grounds, not this synthetic check.
This two-phase process is worth noting. The Phase 1 failure could easily have been missed with limited testing. The naive crossover approach looks reasonable on the surface, and a developer who only tested on a single favorable dataset might never notice the problem. The percentile approach is more robust because it measures a value's relative position within its own recent history — the last InpPercentileLookback bars — rather than reacting to a single-bar crossover; this is a relative, locally-windowed measure, not an absolute characterization of the market regime.Volatility Estimation Efficiency: Garman–Klass vs Close-to-Close
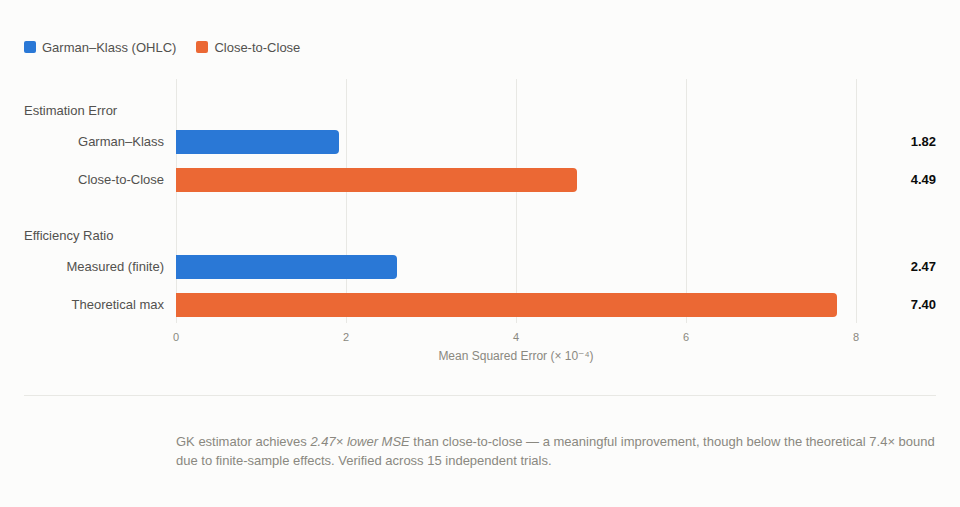
Figure 2. Mean squared error comparison: Garman–Klass vs close-to-close volatility estimation on synthetic GBM data (10,000 bars, σ = 0.20).
Adapting for Live Markets
Translating the Python prototype into a live MQL5 indicator introduces several implementation concerns that do not exist in a batch-processing script.
Series Indexing
MQL5 indicator buffers use ArraySetAsSeries(true) by convention, meaning index 0 is the most recent bar and higher indices go further into the past. Every rolling-window calculation must iterate from index i through i + period - 1 (toward older bars), not from i - period + 1 through i as you might in a Python array indexed from left to right.
Recursive Squeeze State
The squeeze detection carries state from bar to bar. Once the percentile drops below the squeeze threshold, the squeeze flag is set to 1.0 and stays there until either (a) the percentile rises above the expansion threshold (triggering a signal and resetting the flag) or (b) the percentile rises above the squeeze threshold but stays below the expansion threshold (the flag carries forward unchanged).
This state is recursive — each bar depends on the previous bar's state.
In this implementation, the state is stored in an INDICATOR CALCULATIONS buffer managed by SetIndexBuffer(). This approach is reliable and simple. A manually managed dynamic array can also work, but only if resizing and reindexing on each prev calculated reset are implemented correctly and kept in sync with the terminal's buffer lifecycle. The INDICATOR_CALCULATIONS buffer approach was chosen here because the terminal manages its size and lifetime automatically, which removes an entire class of synchronization bugs like the one that motivated this design choice in the first place.Incremental Calculation
On each new bar, MQL5 calls OnCalculate() with prev_calculated reflecting how many bars were already computed. A well-written indicator recalculates only the new bars (the difference between rates_total and prev_calculated ), not the entire history. But the recursive squeeze state means we must be careful: on an incremental update, the squeeze state for new bars depends on the already-calculated state at the boundary. This works correctly as long as the buffer is managed by the terminal (via SetIndexBuffer() and not manually resized).
EA Baseline on Attach
When an Expert Advisor is attached to a chart, it receives the current state of the indicator — which might show an active squeeze, or a fresh expansion signal, or anything in between. If the EA immediately acts on this state, it opens a trade based on whatever happened to be true at the moment of attachment, not on a genuine signal transition.
The correct approach is to avoid treating whatever state already exists at attachment time as a trade signal, and to act only on a genuine, subsequent signal change. The EA implements this as a first-bar skip rather than a stored-and-compared state: it ignores its very first new-bar event after attachment and begins acting on signals from the second one onward.
Requirements and Setup
To compile and use the indicator and Expert Advisor, you need MetaTrader 5 (build 2500 or later) with the MetaEditor IDE. Both files should be placed in the correct directories:
The indicator file GKVolatility.mq5 goes into MQL5/Indicators/. The Expert Advisor file GKVolatilityEA.mq5 goes into MQL5/Experts/. The EA depends on the standard Trade/Trade.mqh include file, which ships with every MetaTrader 5 installation.
Compile the indicator first, since the EA uses iCustom("GKVolatility",...) to load it. If the indicator is not compiled, the EA's OnInit() will fail with an INVALID_HANDLE error.
After compiling both files, attach the indicator to a chart to verify it draws correctly, then attach the EA to the same chart (or a different chart with the same symbol and timeframe) to enable automated trading.
The Indicator: Complete Implementation
The indicator is stored in GKVolatility.mq5. The code is shown below in the order it appears in the file. Each block is followed by a short explanation of what it does.
File Header and Properties
The properties block declares the indicator as a separate subwindow with six indicator buffers, of which four are plotted: the GK volatility line, the GK moving average line, the buy arrows, and the sell arrows.
//+------------------------------------------------------------------+
//| GKVolatility.mq5                                                 |
//| Copyright 2026, Ali Kazim                                        |
//| https://www.mql5.com                                             |
//+------------------------------------------------------------------+
#property copyright "Copyright 2026, Ali Kazim"
#property link      "https://www.mql5.com"
#property version   "1.00"
#property description "Garman-Klass Volatility Estimator Indicator"
#property description "Uses OHLC data for efficient volatility estimation"
#property description "with squeeze-expansion signal detection."
#property indicator_separate_window
#property indicator_buffers 6
#property indicator_plots   4

//--- plot GK Volatility line
#property indicator_label1  "GK Volatility"
#property indicator_type1   DRAW_LINE
#property indicator_color1  clrDodgerBlue
#property indicator_style1  STYLE_SOLID
#property indicator_width1  2

//--- plot GK Moving Average line
#property indicator_label2  "GK MA"
#property indicator_type2   DRAW_LINE
#property indicator_color2  clrOrangeRed
#property indicator_style2  STYLE_DASH
#property indicator_width2  1

//--- plot Buy signal arrows
#property indicator_label3  "Buy Signal"
#property indicator_type3   DRAW_ARROW
#property indicator_color3  clrLime
#property indicator_width3  2

//--- plot Sell signal arrows
#property indicator_label4  "Sell Signal"
#property indicator_type4   DRAW_ARROW
#property indicator_color4  clrRed
#property indicator_width4  2
The #property directives set the subwindow mode, the number of buffers and plots, and the style of each plotted line or arrow. Buffers 0 to 3 are drawn on the chart, while buffers 4 and 5 are used only for internal calculation.
Input Parameters and Global Buffers
Seven input parameters control the indicator's behavior. The GK period (default 20) sets the rolling window for variance averaging. The MA period (default 50) smooths the GK line. The percentile lookback (default 100) sets how many past bars are used for the percentile rank. The squeeze and expansion levels (30 and 60) define the percentile thresholds. The direction period (default 20) sets the SMA used to choose trade direction. The annualization factor (default 252) scales the variance to annual terms. It changes only the displayed volatility level, not the signals, because the percentile ranks, the GK-to-MA comparison, and the direction filter are all unaffected by a constant scale factor.
input int    InpGKPeriod           = 20;    // GK Volatility Period
input int    InpMAPeriod           = 50;    // GK Moving Average Period
input int    InpPercentileLookback = 100;   // Percentile Lookback Period
input double InpSqueezeLevel       = 30.0;  // Squeeze Threshold (percentile)
input double InpExpansionLevel     = 60.0;  // Expansion Threshold (percentile)
input int    InpDirectionPeriod    = 20;    // Direction Filter SMA Period
input int    InpAnnualizeFactor    = 252;   // Annualization Factor (252 for daily)

//--- indicator buffers
double GKBuffer[];
double GKMABuffer[];
double BuyBuffer[];
double SellBuffer[];
double PercentileBuffer[];
double SqueezeBuffer[];

//--- module-level constant
const double LN2_COEFF = 2.0 * MathLog(2.0) - 1.0;
The six arrays are the indicator buffers. The first four (GK, GK MA, buy, sell) are plotted. PercentileBuffer and SqueezeBuffer hold internal state that is needed for the calculation but never drawn; they are bound with INDICATOR_CALCULATIONS in OnInit. LN2_COEFF is precomputed once: it equals 2×ln(2) − 1 ≈ 0.3863 and is used in every per-bar GK variance calculation.
OnInit — Initialization
OnInit() validates the input parameters, binds the six buffers, sets the arrow codes and empty values for the signal plots, switches every buffer to series order (index 0 = newest bar), and sets the subwindow short name. It returns INIT_PARAMETERS_INCORRECT for invalid inputs, INIT_FAILED if a buffer cannot be bound, and INIT_SUCCEEDED otherwise.
//+------------------------------------------------------------------+
//| Custom indicator initialization function                         |
//+------------------------------------------------------------------+
int OnInit()
  {
//--- validate input parameters
   if(InpGKPeriod < 2)
     {
      Print("Error: GK Period must be at least 2. Current value: ", InpGKPeriod);
      return(INIT_PARAMETERS_INCORRECT);
     }
   if(InpMAPeriod < 2)
     {
      Print("Error: MA Period must be at least 2. Current value: ", InpMAPeriod);
      return(INIT_PARAMETERS_INCORRECT);
     }
   if(InpPercentileLookback < 10)
     {
      Print("Error: Percentile Lookback must be at least 10. Current value: ",
            InpPercentileLookback);
      return(INIT_PARAMETERS_INCORRECT);
     }
   if(InpSqueezeLevel <= 0.0 || InpSqueezeLevel >= 100.0)
     {
      Print("Error: Squeeze Level must be between 0 and 100. Current value: ",
            InpSqueezeLevel);
      return(INIT_PARAMETERS_INCORRECT);
     }
   if(InpExpansionLevel <= InpSqueezeLevel || InpExpansionLevel >= 100.0)
     {
      Print("Error: Expansion Level must be greater than Squeeze Level and below 100. ",
            "Squeeze: ", InpSqueezeLevel, ", Expansion: ", InpExpansionLevel);
      return(INIT_PARAMETERS_INCORRECT);
     }
   if(InpDirectionPeriod < 2)
     {
      Print("Error: Direction Period must be at least 2. Current value: ",
            InpDirectionPeriod);
      return(INIT_PARAMETERS_INCORRECT);
     }
   if(InpAnnualizeFactor < 1)
     {
      Print("Error: Annualization Factor must be at least 1. Current value: ",
            InpAnnualizeFactor);
      return(INIT_PARAMETERS_INCORRECT);
     }

//--- bind indicator buffers
   if(!SetIndexBuffer(0, GKBuffer, INDICATOR_DATA))
     {
      Print("Error: SetIndexBuffer failed for GKBuffer. Error: ", GetLastError());
      return(INIT_FAILED);
     }
   if(!SetIndexBuffer(1, GKMABuffer, INDICATOR_DATA))
     {
      Print("Error: SetIndexBuffer failed for GKMABuffer. Error: ", GetLastError());
      return(INIT_FAILED);
     }
   if(!SetIndexBuffer(2, BuyBuffer, INDICATOR_DATA))
     {
      Print("Error: SetIndexBuffer failed for BuyBuffer. Error: ", GetLastError());
      return(INIT_FAILED);
     }
   if(!SetIndexBuffer(3, SellBuffer, INDICATOR_DATA))
     {
      Print("Error: SetIndexBuffer failed for SellBuffer. Error: ", GetLastError());
      return(INIT_FAILED);
     }
   if(!SetIndexBuffer(4, PercentileBuffer, INDICATOR_CALCULATIONS))
     {
      Print("Error: SetIndexBuffer failed for PercentileBuffer. Error: ", GetLastError());
      return(INIT_FAILED);
     }
   if(!SetIndexBuffer(5, SqueezeBuffer, INDICATOR_CALCULATIONS))
     {
      Print("Error: SetIndexBuffer failed for SqueezeBuffer. Error: ", GetLastError());
      return(INIT_FAILED);
     }

//--- set arrow codes for signal buffers
   PlotIndexSetInteger(2, PLOT_ARROW, 233);  // up arrow
   PlotIndexSetInteger(3, PLOT_ARROW, 234);  // down arrow

//--- set empty value for arrow buffers so they draw only on signals
   PlotIndexSetDouble(2, PLOT_EMPTY_VALUE, EMPTY_VALUE);
   PlotIndexSetDouble(3, PLOT_EMPTY_VALUE, EMPTY_VALUE);

//--- set series direction for all buffers
   ArraySetAsSeries(GKBuffer, true);
   ArraySetAsSeries(GKMABuffer, true);
   ArraySetAsSeries(BuyBuffer, true);
   ArraySetAsSeries(SellBuffer, true);
   ArraySetAsSeries(PercentileBuffer, true);
   ArraySetAsSeries(SqueezeBuffer, true);

//--- configure the indicator subwindow label
   IndicatorSetString(INDICATOR_SHORTNAME,
                      "GK Volatility(" + IntegerToString(InpGKPeriod) + "," +
                      IntegerToString(InpMAPeriod) + ")");

   return(INIT_SUCCEEDED);
  }
The validation block runs first, so an invalid combination (for example, an expansion level not above the squeeze level) stops the indicator before any buffer is touched. Binding the buffers with INDICATOR_CALCULATIONS tells the terminal that PercentileBuffer and SqueezeBuffer are internal and need not be exposed to the chart. ArraySetAsSeries(…, true) makes index 0 the newest bar, which the rest of the code assumes.
CalcGKVariance — Per-Bar Variance Component
CalcGKVariance() receives the open, high, low and close of one bar and returns the per-bar Garman–Klass variance term. It returns 0.0 when any price is not positive or when the low is above the high. This means an invalid bar contributes zero variance to the rolling window instead of stopping the calculation. The function returns a plain double, not a success flag, so the caller cannot distinguish an invalid bar from a genuinely quiet one.
//+------------------------------------------------------------------+
//| Calculate per-bar Garman-Klass variance component                |
//+------------------------------------------------------------------+
double CalcGKVariance(const double open_price,
                      const double high_price,
                      const double low_price,
                      const double close_price)
  {
//--- guard against invalid price data
   if(high_price <= 0.0 || low_price <= 0.0 ||
      open_price <= 0.0 || close_price <= 0.0)
      return(0.0);
   if(low_price > high_price)
      return(0.0);

//--- compute the two components of the GK formula
   double hl = MathLog(high_price / low_price);
   double co = MathLog(close_price / open_price);

//--- GK per-bar variance: 0.5 * ln(H/L)^2 - (2*ln(2) - 1) * ln(C/O)^2
   return(0.5 * hl * hl - LN2_COEFF * co * co);
  }
The two logarithms are the high-low range and the close-open move in log terms. The first term 0.5 × ln(H/L)² measures the intrabar range, and the second term subtracts the part of that range explained by the close-open move. LN2_COEFF is the constant from the global declarations.
CalcRollingGK — Rolling Window Volatility
CalcRollingGK() receives the start index, the window length, the four price arrays, the total bar count, and a reference to the result. It averages the per-bar variance over the window, multiplies by the annualization factor, and takes the square root. It returns false and sets the result to EMPTY_VALUE when the window extends beyond the available history.
//+------------------------------------------------------------------+
//| Calculate rolling GK volatility for a given bar index            |
//+------------------------------------------------------------------+
bool CalcRollingGK(const int idx,
                   const int period,
                   const double &open_arr[],
                   const double &high_arr[],
                   const double &low_arr[],
                   const double &close_arr[],
                   const int rates_total,
                   double &result)
  {
//--- ensure enough bars are available for the lookback window
   if(idx + period > rates_total)
     {
      result = EMPTY_VALUE;
      return(false);
     }

//--- accumulate per-bar GK variance over the rolling window
   double sum = 0.0;
   for(int j = 0; j < period; j++)
     {
      int bar = idx + j;
      sum += CalcGKVariance(open_arr[bar], high_arr[bar],
                            low_arr[bar], close_arr[bar]);
     }

//--- average and annualize, guard against negative variance
   double avgVar = sum / period;
   result = MathSqrt(MathMax(avgVar, 0.0) * InpAnnualizeFactor);
   return(true);
  }
The MathMax() call prevents a negative average variance, which can occur on some windows, from producing an error in MathSqrt(). Because the average is clamped to zero, a window with negative average variance is reported as zero volatility rather than as an error.
CalcGKMA — Moving Average of GK Volatility
CalcGKMA() averages the valid GK values in a window of period bars starting at idx. It skips EMPTY_VALUE entries and requires at least half of the window to be valid. It returns false and sets the result to EMPTY_VALUE when that requirement is not met.
//+------------------------------------------------------------------+
//| Calculate simple moving average of the GK buffer                 |
//+------------------------------------------------------------------+
bool CalcGKMA(const int idx,
              const int period,
              const int rates_total,
              double &result)
  {
//--- ensure enough calculated GK values exist
   if(idx + period > rates_total)
     {
      result = EMPTY_VALUE;
      return(false);
     }

//--- sum GK values over the MA window
   double sum = 0.0;
   int    count = 0;
   for(int j = 0; j < period; j++)
     {
      if(GKBuffer[idx + j] != EMPTY_VALUE)
        {
         sum += GKBuffer[idx + j];
         count++;
        }
     }

//--- require at least half the window to have valid values
   if(count < period / 2)
     {
      result = EMPTY_VALUE;
      return(false);
     }

   result = sum / count;
   return(true);
  }
Skipping EMPTY_VALUE entries keeps the MA usable at the start of the history, where the first GK values have not yet been calculated. The half-window requirement prevents the MA from being driven by only a few values.
CalcPercentile — Percentile Rank
CalcPercentile() receives the bar index, the lookback length, and the total bar count, and returns the share of past GK values that are below the current GK value, scaled to 0–100. It returns false when the lookback is not available, when the current GK value is invalid, or when fewer than 10 valid past values exist.
//+------------------------------------------------------------------+
//| Calculate percentile rank of current GK within lookback window   |
//+------------------------------------------------------------------+
bool CalcPercentile(const int idx,
                    const int lookback,
                    const int rates_total,
                    double &result)
  {
//--- ensure enough history exists for the lookback
   if(idx + lookback >= rates_total)
     {
      result = EMPTY_VALUE;
      return(false);
     }
   if(GKBuffer[idx] == EMPTY_VALUE)
     {
      result = EMPTY_VALUE;
      return(false);
     }

//--- count how many past GK values fall below the current value
   double currentVal = GKBuffer[idx];
   int    countBelow = 0;
   int    total = 0;

   for(int j = 1; j <= lookback; j++)
     {
      if(GKBuffer[idx + j] != EMPTY_VALUE)
        {
         total++;
         if(GKBuffer[idx + j] < currentVal)
            countBelow++;
        }
     }

//--- need a meaningful sample to compute percentile
   if(total < 10)
     {
      result = EMPTY_VALUE;
      return(false);
     }

   result = (double)countBelow / (double)total * 100.0;
   return(true);
  }
The loop compares the current GK value with the lookback window that precedes it, which is why j starts at 1 and excludes the current bar. The result is a rank, so it is unaffected by the absolute scale of GK. The minimum sample of 10 values prevents an unstable rank from being used early in the history.
CalcDirectionSMA — Price Direction Filter
CalcDirectionSMA() returns the simple average of the closing prices over period bars starting at idx. It returns false when the window extends beyond the available history. The OnCalculate() loop uses it to decide whether a squeeze-expansion signal is bullish or bearish.
//+------------------------------------------------------------------+
//| Calculate direction-filter SMA from close prices                 |
//+------------------------------------------------------------------+
bool CalcDirectionSMA(const int idx,
                      const int period,
                      const double &close_arr[],
                      const int rates_total,
                      double &result)
  {
//--- ensure enough bars exist
   if(idx + period > rates_total)
     {
      result = 0.0;
      return(false);
     }

//--- simple average of closing prices over the direction period
   double sum = 0.0;
   for(int j = 0; j < period; j++)
      sum += close_arr[idx + j];

   result = sum / period;
   return(true);
  }
The direction filter is a plain price average, so it does not depend on the volatility calculation. A signal is classified as bullish when the bar's close is above this average and as bearish otherwise.
OnCalculate — The Main Calculation Loop
OnCalculate() receives the total bar count, the number of bars calculated on the previous call, and the price arrays. It returns rates_total, which tells the terminal that all bars have been processed. The function works in four phases: GK volatility, GK moving average, percentile rank, and squeeze state with signals. On the first full calculation (prev_calculated ≤ 1) every buffer is initialized. On later calls only the new bars are recalculated, while the squeeze state carries forward from the previous bar.
//+------------------------------------------------------------------+
//| Custom indicator iteration function                              |
//+------------------------------------------------------------------+
int OnCalculate(const int rates_total,
                const int prev_calculated,
                const datetime &time[],
                const double &open[],
                const double &high[],
                const double &low[],
                const double &close[],
                const long &tick_volume[],
                const long &volume[],
                const int &spread[])
  {
//--- set series direction for price arrays
   ArraySetAsSeries(open, true);
   ArraySetAsSeries(high, true);
   ArraySetAsSeries(low, true);
   ArraySetAsSeries(close, true);

//--- determine the minimum number of bars needed for all calculations
   int minBars = InpGKPeriod + InpMAPeriod + InpPercentileLookback;
   if(rates_total < minBars + 1)
      return(0);

//--- determine the calculation range
   int limit;
   if(prev_calculated <= 1)
     {
      //--- full recalculation: initialize all buffers
      if(ArrayInitialize(GKBuffer, EMPTY_VALUE) == -1)
         Print("Warning: ArrayInitialize failed for GKBuffer. Error: ", GetLastError());
      if(ArrayInitialize(GKMABuffer, EMPTY_VALUE) == -1)
         Print("Warning: ArrayInitialize failed for GKMABuffer. Error: ", GetLastError());
      if(ArrayInitialize(BuyBuffer, EMPTY_VALUE) == -1)
         Print("Warning: ArrayInitialize failed for BuyBuffer. Error: ", GetLastError());
      if(ArrayInitialize(SellBuffer, EMPTY_VALUE) == -1)
         Print("Warning: ArrayInitialize failed for SellBuffer. Error: ", GetLastError());
      if(ArrayInitialize(PercentileBuffer, EMPTY_VALUE) == -1)
         Print("Warning: ArrayInitialize failed for PercentileBuffer. Error: ", GetLastError());
      if(ArrayInitialize(SqueezeBuffer, 0.0) == -1)
         Print("Warning: ArrayInitialize failed for SqueezeBuffer. Error: ", GetLastError());

      limit = rates_total - InpGKPeriod - 1;
     }
   else
     {
      //--- incremental update: recalculate only new bars
      limit = rates_total - prev_calculated;
      //--- clear arrow buffers for new bars only
      for(int i = 0; i <= limit; i++)
        {
         BuyBuffer[i]  = EMPTY_VALUE;
         SellBuffer[i] = EMPTY_VALUE;
        }
     }

//--- PHASE 1: Calculate rolling GK volatility for each bar
   for(int i = limit; i >= 0; i--)
     {
      double gkVal;
      if(!CalcRollingGK(i, InpGKPeriod, open, high, low, close, rates_total, gkVal))
         GKBuffer[i] = EMPTY_VALUE;
      else
         GKBuffer[i] = gkVal;
     }

//--- PHASE 2: Calculate GK moving average
   int maLimit = limit;
//--- on full recalc, MA starts only where enough GK values exist
   if(prev_calculated <= 1)
      maLimit = rates_total - InpGKPeriod - InpMAPeriod - 1;
   if(maLimit < 0)
      maLimit = 0;

   for(int i = maLimit; i >= 0; i--)
     {
      double maVal;
      if(!CalcGKMA(i, InpMAPeriod, rates_total, maVal))
         GKMABuffer[i] = EMPTY_VALUE;
      else
         GKMABuffer[i] = maVal;
     }

//--- PHASE 3: Calculate percentile rank
   int pctLimit = limit;
   if(prev_calculated <= 1)
      pctLimit = rates_total - InpGKPeriod - InpPercentileLookback - 1;
   if(pctLimit < 0)
      pctLimit = 0;

   for(int i = pctLimit; i >= 0; i--)
     {
      double pctVal;
      if(!CalcPercentile(i, InpPercentileLookback, rates_total, pctVal))
         PercentileBuffer[i] = EMPTY_VALUE;
      else
         PercentileBuffer[i] = pctVal;
     }

//--- PHASE 4: Update squeeze state and generate signals
//--- squeeze state is recursive — depends on the previous bar's state
   int sqLimit = pctLimit;

   for(int i = sqLimit; i >= 0; i--)
     {
      //--- skip bars where percentile is not yet available
      if(PercentileBuffer[i] == EMPTY_VALUE)
        {
         SqueezeBuffer[i] = 0.0;
         continue;
        }

      //--- retrieve the previous bar's squeeze state
      //--- with series arrays, previous bar in time is index i+1
      double prevSqueeze = 0.0;
      if(i + 1 < rates_total)
         prevSqueeze = SqueezeBuffer[i + 1];

      //--- check if currently in squeeze territory
      if(PercentileBuffer[i] < InpSqueezeLevel)
        {
         //--- enter or remain in squeeze state
         SqueezeBuffer[i] = 1.0;
        }
      else if(prevSqueeze == 1.0 && PercentileBuffer[i] > InpExpansionLevel)
        {
         //--- expansion from squeeze detected — generate trade signal
         SqueezeBuffer[i] = 0.0;

         //--- determine trade direction using the SMA filter
         double smaVal;
         if(CalcDirectionSMA(i, InpDirectionPeriod, close, rates_total, smaVal))
           {
            if(close[i] > smaVal)
               BuyBuffer[i] = GKBuffer[i];   // bullish expansion
            else
               SellBuffer[i] = GKBuffer[i];  // bearish expansion
           }
        }
      else
        {
         //--- carry forward the previous squeeze state unchanged
         SqueezeBuffer[i] = prevSqueeze;
        }
     }

   return(rates_total);
  }
Phases 1 to 3 are stateless: each bar's value depends only on the price data and the buffers computed for earlier bars in the same pass. Phase 4 is recursive, because SqueezeBuffer[i] depends on SqueezeBuffer[i + 1]. For that reason the squeeze state is never cleared on ordinary new-bar updates. A signal is written only on the bar where the percentile rises above the expansion level after a squeeze. The arrow is drawn at the GK value on that bar, and its direction comes from the position of the close relative to the direction SMA.
The Expert Advisor: From Signals to Trades
The Expert Advisor is stored in GKVolatilityEA.mq5. It does not contain any volatility math. It reads the indicator's buffers through iCustom() and CopyBuffer(), and turns the buy and sell signals and the volatility contraction state into orders.
File Header and Input Parameters
The EA declares nine inputs. The first seven are passed unchanged to the indicator, so the default values must match the indicator's defaults. The lot size and magic number belong to the EA only. The magic number identifies positions opened by this EA so it never closes positions opened by another EA or by hand.
//+------------------------------------------------------------------+
//| GKVolatilityEA.mq5                                               |
//| Copyright 2026, Ali Kazim                                        |
//| https://www.mql5.com                                             |
//+------------------------------------------------------------------+
#property copyright "Copyright 2026, Ali Kazim"
#property link      "https://www.mql5.com"
#property version   "1.00"
#property description "Expert Advisor based on Garman-Klass Volatility"
#property description "squeeze-expansion breakout signals."

#include <Trade\Trade.mqh>

//--- input parameters matching the indicator defaults
input int    InpGKPeriod           = 20;    // GK Volatility Period
input int    InpMAPeriod           = 50;    // GK Moving Average Period
input int    InpPercentileLookback = 100;   // Percentile Lookback Period
input double InpSqueezeLevel       = 30.0;  // Squeeze Threshold (percentile)
input double InpExpansionLevel     = 60.0;  // Expansion Threshold (percentile)
input int    InpDirectionPeriod    = 20;    // Direction Filter SMA Period
input int    InpAnnualizeFactor    = 252;   // Annualization Factor
input double InpLotSize            = 0.10;  // Trade Lot Size
input int    InpMagicNumber        = 202601; // Magic Number

//--- global variables
int       g_indicatorHandle = INVALID_HANDLE;
CTrade    g_trade;
datetime  g_lastBarTime     = 0;
bool      g_baselineRecorded = false;
OnInit — EA Initialization
OnInit() creates the indicator handle with iCustom(), passing the seven indicator parameters in the same order as the indicator's own inputs. It returns INIT_FAILED if the handle cannot be created, and it configures the trade object with the magic number. It also resets the baseline flag so that each initialization starts from a clean state.
//+------------------------------------------------------------------+
//| Expert initialization function                                   |
//+------------------------------------------------------------------+
int OnInit()
  {
//--- create indicator handle via iCustom
   g_indicatorHandle = iCustom(_Symbol, PERIOD_CURRENT, "GKVolatility",
                               InpGKPeriod, InpMAPeriod, InpPercentileLookback,
                               InpSqueezeLevel, InpExpansionLevel,
                               InpDirectionPeriod, InpAnnualizeFactor);
   if(g_indicatorHandle == INVALID_HANDLE)
     {
      Print("Error: iCustom failed to create GKVolatility handle. Error: ",
            GetLastError());
      return(INIT_FAILED);
     }

//--- configure the trade object with the magic number
   g_trade.SetExpertMagicNumber(InpMagicNumber);

//--- reset state for fresh initialization
   g_lastBarTime      = 0;
   g_baselineRecorded = false;

   Print("GKVolatilityEA initialized. Magic: ", InpMagicNumber,
         ", Lot: ", InpLotSize);
   return(INIT_SUCCEEDED);
  }
The input order in the iCustom() call must match the indicator's input order exactly. iCustom() binds values by position, so a mismatch would silently pass the wrong value to the wrong input. The call does not wait for the indicator to finish its first calculation. Early CopyBuffer() calls can therefore return fewer values, and OnTick() handles that case by returning without acting.
OnDeinit — Cleanup
OnDeinit() releases the indicator handle so that the terminal can free its resources when the EA is removed or the chart is closed. If IndicatorRelease() fails, the error is printed and the handle is still reset to INVALID_HANDLE.
//+------------------------------------------------------------------+
//| Expert deinitialization function                                 |
//+------------------------------------------------------------------+
void OnDeinit(const int reason)
  {
//--- release the indicator handle to free resources
   if(g_indicatorHandle != INVALID_HANDLE)
     {
      if(!IndicatorRelease(g_indicatorHandle))
         Print("Warning: IndicatorRelease failed. Error: ", GetLastError());
      g_indicatorHandle = INVALID_HANDLE;
     }
  }
IsNewBar — New Bar Detection
IsNewBar() returns true once per bar. It reads the open time of the current bar with iTime() and compares it with the time stored on the previous call. If iTime() returns 0, the function prints the error and returns false. OnTick() uses this check so that trading logic runs once per bar, not once per tick.
//+------------------------------------------------------------------+
//| Check if a new bar has formed using iTime                        |
//+------------------------------------------------------------------+
bool IsNewBar()
  {
//--- retrieve the open time of the current bar
   datetime currentBarTime = iTime(_Symbol, PERIOD_CURRENT, 0);
   if(currentBarTime == 0)
     {
      Print("Warning: iTime returned 0. Error: ", GetLastError());
      return(false);
     }

//--- compare with the stored last bar time
   if(currentBarTime == g_lastBarTime)
      return(false);

//--- new bar detected — update the stored time
   g_lastBarTime = currentBarTime;
   return(true);
  }
CountPositions — Position Counting
CountPositions() receives a position type (buy or sell) and returns how many open positions of that type belong to this EA on the current symbol. It filters by magic number and symbol, so positions from other EAs or other charts are ignored.
//+------------------------------------------------------------------+
//| Count open positions matching this EA's magic number             |
//+------------------------------------------------------------------+
int CountPositions(ENUM_POSITION_TYPE posType)
  {
   int count = 0;
   for(int i = PositionsTotal() - 1; i >= 0; i--)
     {
      ulong ticket = PositionGetTicket(i);
      if(ticket == 0)
         continue;
      if(PositionGetInteger(POSITION_MAGIC) != InpMagicNumber)
         continue;
      if(PositionGetString(POSITION_SYMBOL) != _Symbol)
         continue;
      if((ENUM_POSITION_TYPE)PositionGetInteger(POSITION_TYPE) == posType)
         count++;
     }
   return(count);
  }
ClosePositions — Position Closing
ClosePositions() receives a position type and closes every open position of that type that belongs to this EA on the current symbol. If a close request fails, the error is printed with the ticket number and the loop continues with the remaining positions. The loop runs backwards so that closing a position does not shift the indexes still to be processed.
//+------------------------------------------------------------------+
//| Close all positions of a given type for this EA                  |
//+------------------------------------------------------------------+
void ClosePositions(ENUM_POSITION_TYPE posType)
  {
   for(int i = PositionsTotal() - 1; i >= 0; i--)
     {
      ulong ticket = PositionGetTicket(i);
      if(ticket == 0)
         continue;
      if(PositionGetInteger(POSITION_MAGIC) != InpMagicNumber)
         continue;
      if(PositionGetString(POSITION_SYMBOL) != _Symbol)
         continue;
      if((ENUM_POSITION_TYPE)PositionGetInteger(POSITION_TYPE) == posType)
        {
         if(!g_trade.PositionClose(ticket))
            Print("Error: PositionClose failed for ticket ", ticket,
                  ". Error: ", GetLastError());
        }
     }
  }
OpenBuy and OpenSell — Order Execution
OpenBuy() and OpenSell() each open one market position of size InpLotSize at the current ask or bid. Each function checks that the price from SymbolInfoDouble() is greater than zero before sending the order, because a zero price would be an invalid order. Both return true when the order is accepted and false otherwise. Neither sets a stop-loss or take-profit, so the only exits are the volatility contraction condition in IsVolContracting() and an opposite signal in OnTick().
//+------------------------------------------------------------------+
//| Open a buy position at the current market price                  |
//+------------------------------------------------------------------+
bool OpenBuy()
  {
//--- retrieve the current ask price
   double ask = SymbolInfoDouble(_Symbol, SYMBOL_ASK);
   if(ask <= 0.0)
     {
      Print("Error: SymbolInfoDouble(ASK) returned invalid price: ", ask,
            ". Error: ", GetLastError());
      return(false);
     }

//--- send the buy order
   if(!g_trade.Buy(InpLotSize, _Symbol, ask, 0.0, 0.0,
                   "GK Vol Expansion Buy"))
     {
      Print("Error: Buy order failed. Error: ", GetLastError());
      return(false);
     }

   Print("Buy opened at ", ask, ", Lot: ", InpLotSize);
   return(true);
  }

//+------------------------------------------------------------------+
//| Open a sell position at the current market price                 |
//+------------------------------------------------------------------+
bool OpenSell()
  {
//--- retrieve the current bid price
   double bid = SymbolInfoDouble(_Symbol, SYMBOL_BID);
   if(bid <= 0.0)
     {
      Print("Error: SymbolInfoDouble(BID) returned invalid price: ", bid,
            ". Error: ", GetLastError());
      return(false);
     }

//--- send the sell order
   if(!g_trade.Sell(InpLotSize, _Symbol, bid, 0.0, 0.0,
                    "GK Vol Expansion Sell"))
     {
      Print("Error: Sell order failed. Error: ", GetLastError());
      return(false);
     }

   Print("Sell opened at ", bid, ", Lot: ", InpLotSize);
   return(true);
  }
IsVolContracting — Volatility Exit Condition
IsVolContracting() reads the current GK value (buffer 0) and its moving average (buffer 1) at bar index 1, the most recently closed bar. It returns true when GK is below its MA, which the EA treats as volatility contraction. It returns false if either CopyBuffer() call fails or if either value is EMPTY_VALUE.
//+------------------------------------------------------------------+
//| Check for volatility contraction exit condition                  |
//+------------------------------------------------------------------+
bool IsVolContracting()
  {
//--- read GK volatility and its MA from indicator buffers 0 and 1
   double gkVal[1], gkMA[1];

   if(CopyBuffer(g_indicatorHandle, 0, 1, 1, gkVal) != 1)
     {
      Print("Warning: CopyBuffer failed for GK value. Error: ", GetLastError());
      return(false);
     }
   if(CopyBuffer(g_indicatorHandle, 1, 1, 1, gkMA) != 1)
     {
      Print("Warning: CopyBuffer failed for GK MA. Error: ", GetLastError());
      return(false);
     }

//--- contraction occurs when current GK drops below its moving average
   if(gkVal[0] != EMPTY_VALUE && gkMA[0] != EMPTY_VALUE)
     {
      if(gkVal[0] < gkMA[0])
         return(true);
     }

   return(false);
  }
The contraction check reads the same closed bar as the signal check in OnTick(), so both decisions use one consistent bar. GK below its MA is a condition the EA can meet on the bar right after entry. In that case the position is closed on the next new bar, unless a new opposite signal appears first. This behavior follows from the code as written, and it is discussed in the limitations.
OnTick — The Main Trading Loop
OnTick() runs on every tick but acts only once per new bar. On the first new bar after attachment it records a baseline and returns, so the EA never trades on a signal that already existed when it was attached. On later bars it reads the buy and sell buffers at index 1, closes opposite positions, opens a new position if none of that direction exists, and otherwise applies the contraction exit.
//+------------------------------------------------------------------+
//| Expert tick function                                             |
//+------------------------------------------------------------------+
void OnTick()
  {
//--- only process on new bar formation
   if(!IsNewBar())
      return;

//--- skip the very first bar after attachment to establish a baseline
//--- this prevents opening a trade based on whatever state exists at attach time
   if(!g_baselineRecorded)
     {
      g_baselineRecorded = true;
      Print("Baseline recorded. EA will act on the next genuine signal.");
      return;
     }

//--- read the buy and sell signal buffers at bar index 1 (most recently closed bar)
   double buySignal[1], sellSignal[1];

   if(CopyBuffer(g_indicatorHandle, 2, 1, 1, buySignal) != 1)
     {
      Print("Warning: CopyBuffer failed for buy signal. Error: ", GetLastError());
      return;
     }
   if(CopyBuffer(g_indicatorHandle, 3, 1, 1, sellSignal) != 1)
     {
      Print("Warning: CopyBuffer failed for sell signal. Error: ", GetLastError());
      return;
     }

//--- check for volatility contraction — close any open position
   bool contracting = IsVolContracting();

//--- count existing positions
   int buyCount  = CountPositions(POSITION_TYPE_BUY);
   int sellCount = CountPositions(POSITION_TYPE_SELL);

//--- process buy signal: close sells and open buy if none exists
   if(buySignal[0] != EMPTY_VALUE)
     {
      if(sellCount > 0)
         ClosePositions(POSITION_TYPE_SELL);
      if(buyCount == 0)
         OpenBuy();
     }
//--- process sell signal: close buys and open sell if none exists
   else if(sellSignal[0] != EMPTY_VALUE)
     {
      if(buyCount > 0)
         ClosePositions(POSITION_TYPE_BUY);
      if(sellCount == 0)
         OpenSell();
     }
//--- no new signal: check volatility contraction exit
   else if(contracting)
     {
      if(buyCount > 0)
        {
         Print("Volatility contraction — closing buy positions.");
         ClosePositions(POSITION_TYPE_BUY);
        }
      if(sellCount > 0)
        {
         Print("Volatility contraction — closing sell positions.");
         ClosePositions(POSITION_TYPE_SELL);
        }
     }
  }
The signal check comes before the contraction check, so a new signal always takes priority over the exit. The EA reads the signal at index 1 on the bar that has just closed, which is the same bar on which the indicator draws the arrow. Because the baseline bar is skipped, the first trading decision is taken on the second new bar after attachment.
Putting It to the Test
The EA was backtested on four symbols (XAU/USD, EUR/USD, AUD/USD and USD/JPY) on the H1 timeframe, over one year from 11 September 2025 to 11 September 2026. Every test used the default parameters (GK Period 20, MA Period 50, Percentile Lookback 100, Squeeze Level 30, Expansion Level 60, Direction Period 20), the indicator and EA code shown in this article, and MetaTrader 5's "Every tick based on real ticks" simulation mode.
Each test started with an initial deposit of $5,000 and a lot size of 0.10. The tests were run with an Exness MT5 trial account. Commission was $0.10 per trade. The average spread for each symbol is shown in the table below.

Figure 3. Strategy Tester results — XAU/USD H1

Figure 4. Strategy Tester results — EUR/USD H1

Figure 5. Strategy Tester results — AUD/USD H1

Figure 6. Strategy Tester results — USD/JPY H1
| Symbol | Total Trades | Net Profit ($) | Profit Factor | Balance Drawdown (%) | Equity Drawdown (%) | Avg. Spread (points) | Commission ($/trade) |
|---|---|---|---|---|---|---|---|
| XAU/USD | 300 | 39,395.50 | 1.24 | 54.52 | 79.08 | 25 | 0.10 |
| EUR/USD | 526 | 11,359.80 | 1.15 | 68.96 | 75.95 | 12 | 0.10 |
| AUD/USD | 387 | 3,891.50 | 1.12 | 43.45 | 45.35 | 15 | 0.10 |
| USD/JPY | 386 | 9,758.85 | 1.35 | 31.71 | 39.71 | 15 | 0.10 |
Table 1. Strategy Tester results by symbol, H1, 11 September 2025 to 11 September 2026, initial deposit $5,000.
All four symbols show positive net profit over the test period, with profit factors between 1.12 and 1.35. The drawdowns are large. Equity drawdown ranges from 39.71% (USD/JPY) to 79.08% (XAU/USD), and the EA has no stop-loss. These results describe one year of one configuration on four symbols. They do not show how the strategy would behave in other periods or on other instruments.
What This Tool Cannot Do
The Garman–Klass estimator and the squeeze-expansion system built on top of it have several genuine limitations that should be understood before use.
The zero-drift assumption means the GK estimator is biased in the presence of strong intrabar trends. On instruments with large overnight gaps (individual equities traded on exchanges with a closing bell), the estimator understates true volatility, because the gap between the previous close and the current open never enters the OHLC-based calculation. For 24-hour or near-24-hour instruments like major forex pairs, this bias is typically small.
The percentile-based regime detection is backward-looking by definition. It tells you where current volatility sits relative to the last 100 bars, not where it will go next. A squeeze can persist for much longer than expected, and an expansion signal does not guarantee a tradeable move.
The EA uses no stop-loss. This is a simplification of the example and not a recommendation. All exits are driven by the volatility contraction condition (GK below its MA) or by an opposite signal, so the EA can hold a losing position through a long adverse move. The tested drawdowns reflect this: equity drawdown reached 79.08% on XAU/USD and 75.95% on EUR/USD. Such drawdowns would not be acceptable in live trading without additional risk controls.
The contraction exit can close a position on the bar after entry, because GK can fall below its MA immediately after a breakout. This makes the exit sensitive to single-bar noise. No confirmation filter was added to the code, and its effect on the results was not measured.
CalcGKVariance() returns zero for an invalid bar instead of reporting an error. A bar with bad price data therefore lowers the rolling average silently. This behavior was not tested on data with gaps or feed errors.
The default parameters (20-bar GK period, 50-bar MA, 100-bar percentile lookback, 30/60 squeeze and expansion levels) are starting values, not tuned or universal settings. The results above use these defaults without optimization. No sensitivity analysis of these parameters was run.
The results come from one one-year window per symbol. No out-of-sample test, walk-forward analysis, or Monte Carlo analysis was performed, so the results do not show how the strategy behaves in periods outside the test window. No baseline comparison was performed against other volatility estimators (close-to-close, ATR, Parkinson, Rogers–Satchell, Yang–Zhang), simple breakout rules, or buy-and-hold. The results therefore do not show whether the percentile-based Garman–Klass logic adds anything over these simpler alternatives.
The Python synthetic results in the verification section are illustrative. The 2.47× MSE figure and the 59.4% win rate come from runs whose random seed and sub-bar simulation resolution were not recorded, so they cannot be reproduced exactly from this article.
Conclusion
This article implemented the Garman–Klass volatility estimator as an MQL5 custom indicator, building a percentile-based squeeze-expansion detection system on top of it and connecting it to an Expert Advisor through the standard iCustom() interface.
The GK estimator uses all four OHLC prices on each bar, achieving a lower estimation error than close-to-close volatility in our finite-sample Python tests, with the illustrative figure of about 2.47× noted above (against a theoretical maximum of 7.4×), under the overlapping-window caveat noted earlier. The percentile-based regime detection avoids the naive crossover trap — demonstrated and disclosed during the Python verification phase — by measuring a value's relative position within its own recent lookback window rather than reacting to a single-bar crossover.
The indicator manages its recursive squeeze state through a proper INDICATOR_CALCULATIONS buffer, the EA delays acting for one bar after attachment rather than trading on whatever state is already present, and the MQL5 API calls that can fail — buffer binding, plot configuration, price and volume retrieval, indicator handle creation, order submission — are checked and reported on failure. This level of error handling is good practice for code intended to run unattended on live capital, though it is one reasonable standard among others rather than the only correct one.
The squeeze-expansion breakout approach is one specific application of the GK estimator. The estimator itself can be used in place of close-to-close volatility for position sizing or regime-classification systems that share its zero-drift, gap-free, no-jump assumptions. It is not a drop-in replacement for close-to-close volatility in every context — option pricing models, in particular, depend on assumptions about jumps, overnight risk, and microstructure noise that GK does not account for, and substituting it there would require separately validating those assumptions hold.
References
- Garman, M. B., & Klass, M. J. (1980). On the Estimation of Security Price Volatilities from Historical Data. Journal of Business, 53(1), 67–78.
- Parkinson, M. (1980). The Extreme Value Method for Estimating the Variance of the Rate of Return. Journal of Business, 53(1), 61–65.
Warning: All rights to these materials are reserved by MetaQuotes Ltd. Copying or reprinting of these materials in whole or in part is prohibited.
This article was written by a user of the site and reflects their personal views. MetaQuotes Ltd is not responsible for the accuracy of the information presented, nor for any consequences resulting from the use of the solutions, strategies or recommendations described.


