

Price Action Analysis Toolkit Development (Part 87): Searching Chart History with Recorded Double-Bottom Samples
 202
202
 0
0

Contents
- Introduction
- Understanding the reference search
- MQL5 implementation
- Installing and testing
- Conclusion
Introduction
The previous stages of this project concentrated on formations already selected by the trader. The recorder preserved their candles, the validator tested their structure, and the panel displayed each interpretation before the complete library was processed. The toolkit could explain a stored example, but the library was not yet being used to locate other formations in chart history.
The next step is to make those reviewed samples part of historical detection. A structural validator can find pairs that satisfy separation, depth, low-to-low difference, and symmetry. Reference matching adds another useful condition: the candle path between the selected lows should resemble examples already accepted in the library.
The validator checks the lows, neckline and mandatory geometry. The scanner then compares each surviving pair with the eligible library profiles and retains it when the mean similarity score reaches the threshold. A retained result has passed the geometric and reference-similarity checks. Its separate CANDIDATE, CONFIRMED or FAILED status describes the outcome observed within the evaluation window. It does not mean that a breakout occurred or that a trade would have been profitable.
By the end of this article, the Expert Advisor can scan completed bars from the attached chart. It lists retained results and displays a selected result using the existing chart renderer. It also writes REFERENCE_MATCHES.csv, which contains the scan totals, settings, closest reference ID, and structural measurements for every retained result.
Understanding the reference search
In this project, reference search means scanning completed chart history for low pairs that pass the geometric rules and resemble eligible samples from the pattern library. A stored sample is not treated as an exact price sequence or a chart image. The price movement between its first and second lows is converted into a normalized numerical profile, allowing comparison with formations that contain different bar counts or occur at different price levels.
Every retained result must answer two questions. First, does the historical pair satisfy the structural double-bottom rules? Second, does its mean similarity score against the nearest reference profiles reach the threshold? The result reaches the panel only when it passes both checks.
The complete workflow
The reference search begins with samples recorded by the trader and ends with a list of related formations from the attached chart. The complete operation follows seven steps:
- Record a collection of manually selected double-bottom examples.
- Validate the stored collection and build reference profiles from CANDIDATE and CONFIRMED samples.
- Press SCAN REFERENCE MATCHES to load completed bars from the attached chart.
- Find structurally eligible pairs, classify their outcomes and apply recorded-interval exclusion when enabled.
- Build normalized close and low profiles for the remaining historical pairs.
- Compare the profiles and apply the mean-score threshold.
- Keep one result per second low, then display and export the retained collection.
The trader performs the first and third steps. The Expert Advisor handles validation, structural search, reference comparison, result filtering and output.
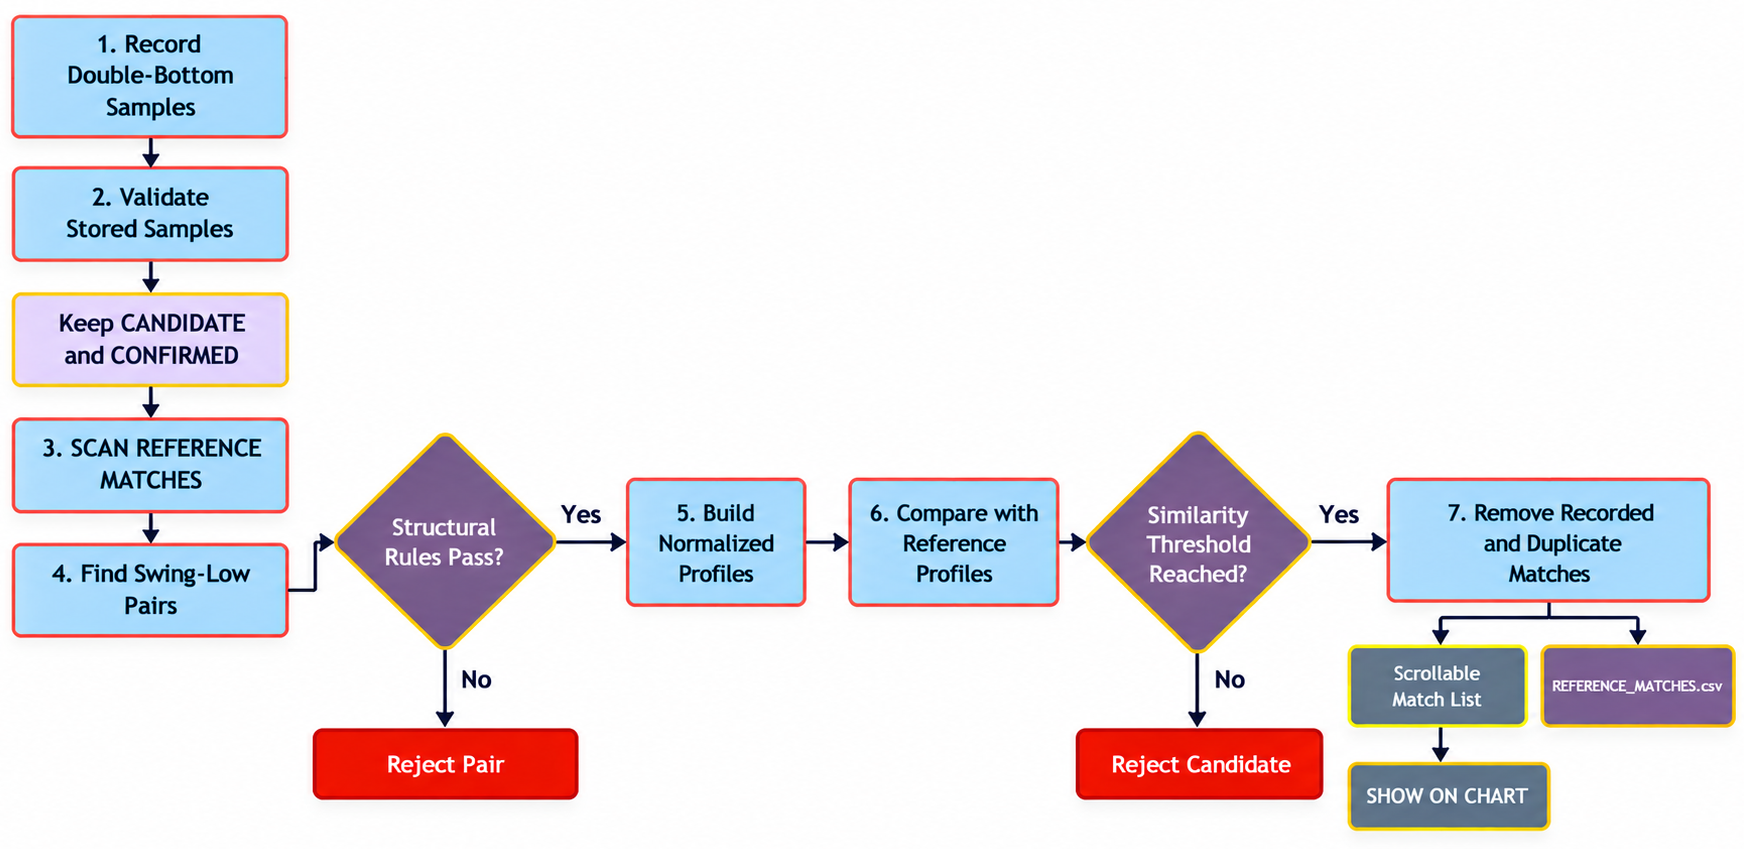
Figure 1. Logical stages of the reference-guided search, from stored samples and chart history to panel and CSV output.
Step 1: Prepare the reference library
The search uses samples manually recorded in the pattern library. Consistent selection boundaries make the examples easier to compare. About ten samples provide a manageable demonstration collection, but this number does not establish adequate coverage. Repeated examples of one shape can dominate the reference set, while patterns the trader did not record may be poorly represented. The scanner retrieves similarities to this chosen collection; it does not learn a universal definition of a double bottom.
Step 2: Validate the reference collection
Before chart history is loaded, the scanner calls ValidateDoubleBottom() for every stored sample. CANDIDATE and CONFIRMED samples supply positive reference profiles. INVALID and FAILED samples remain stored but do not contribute to comparison. Failed examples are not used as a negative class, so the method does not learn to distinguish successful outcomes from similar failures.
Reference preparation uses all eligible samples in the library. It does not filter them by the scanned symbol or timeframe. A mixed library therefore compares shapes across those contexts without establishing that they are equally meaningful. For a focused demonstration, the library can be restricted to one instrument and timeframe before the run.
The default minimum is three usable references, controlled by Input_MinReferenceSamples. If seven of ten stored samples qualify, the panel reports Refs 7/10. The CSV records the total, used and skipped counts. The neighbor count is separate: when fewer eligible profiles exist than Input_ReferenceNeighbors requests, comparison uses all available profiles.
Step 3: Load the chart history
Pressing SCAN REFERENCE MATCHES starts the historical operation on the symbol and timeframe of the attached chart. The default request is 2,000 completed bars. The candle that is still forming is excluded.
The copied rates are placed in chronological order and converted into one temporary SPatternSample. Candle geometry and normalized OHLC fields are calculated with the same helpers used by the recorder. This history sample remains in memory and is not added to the permanent library.
Step 4: Find structurally valid pairs
The scanner finds all swing lows in the copied history. It then evaluates ordered pairs whose distance satisfies the minimum and maximum separation settings. For each pair, the validator locates the highest high between the lows and uses it as the neckline.
Low-to-low difference, depth, and symmetry are checked next. A pair that fails any mandatory condition is discarded at this point. A surviving pair receives its structural score and is counted as a structural candidate.
The first decisive close after the second low determines the outcome. A close above the neckline plus the breakout buffer produces CONFIRMED. A close below the lower low minus the failure tolerance produces FAILED. Without either event, the result remains CANDIDATE. Both tolerances are expressed relative to pattern depth. Evaluation stops at the configured follow-up limit or the last copied bar, whichever comes first; recent pairs may therefore have fewer follow-up bars.
This is a retrospective search. Swing lows require bars to their right, and outcome classification uses subsequent closes. A result attached to the second-low time was not necessarily available at that time. The historical labels are not a simulation of signals issued bar by bar.
The minimum-depth rule measures pattern depth as a percentage of the sample's first close. For historical pairs, that denominator is the first close of the copied history; for a stored reference, it is the first close of that sample. Changing the scan window can therefore affect structural eligibility as well as the bars examined.
Step 5: Convert the shape to a common profile
A structural candidate and a stored reference may contain different numbers of candles between their lows. By default, the scanner resamples both intervals to 32 positions, controlled by Input_ReferenceProfilePoints. Position zero represents the first low, and position 31 represents the second. Linear interpolation supplies values that fall between existing candles.
With the default setting, each profile contains 64 values:
profile[0 ... 31] = closing-price path
profile[32 ... 63] = candle-low path
The prices are then scaled with the accepted pair's average low and pattern depth:
average low = neckline price - pattern depth
profile value = (price - average low) / pattern depth
This coordinate system places the average low at zero and the neckline at one. Scaling by pattern depth allows numerical comparison across price levels, but it does not account for differences in volatility, trading sessions, spreads or instrument type. Each component is clipped to [-1, 2], limiting the influence of extreme values while also concealing how far an outlier exceeded those bounds.
The similarity profile contains only closes and lows between the two selected lows. It omits opens, the high-price path, explicit body and wick measurements, and the surrounding price action. Highs still determine the structural neckline. Resampling each interval to 32 positions aligns relative progress through the formation, but removes absolute duration from the profile and can make different internal timing look similar.
The profile is temporary. It does not replace the raw candles or the percentage-normalized OHLC fields stored in SAMPLE_<ID>.csv.
Step 6: Compare the candidate with the references
The scanner calculates the root mean square error between the candidate profile and every usable reference:
RMSE = square root(sum((candidate[i] - reference[i])^2) / dimensions)
similarity score = 100 / (1 + RMSE)
Identical profiles receive a score of 100. Since every component lies between -1 and 2, RMSE cannot exceed 3 and the score cannot fall below 25. This is an uncalibrated similarity scale, not a probability, an accuracy measure or a percentage match. A displayed decimal is a rounded numerical result, not a statement of statistical confidence.
With the default settings, the scanner averages the three highest individual scores. That mean must reach Input_MinReferenceSimilarityScore, whose default is 75. The cutoff is an initial comparison setting rather than an empirically established boundary between useful formations and noise. This article does not perform a threshold-sensitivity analysis.
Repeated or near-identical references can occupy several of the nearest positions and raise their influence on the mean. Conversely, a rare shape with only one close reference may be rejected because the other nearest profiles are less similar. No reference deduplication, class balancing or negative-example learning is performed.
The closest individual reference and its score are also retained. The structural score and reference similarity remain separate: the former summarizes the rule-based measurements, while the latter measures resemblance between profiles. Neither is a probability of confirmation or expected profit.
Step 7: Clean and present the results
When recorded-interval exclusion is enabled, a pair is skipped if both low times fall inside one stored sample with the same symbol and timeframe. This check uses the stored collection, including samples that did not qualify as references. Partial overlaps and nearby variants can remain, so this exclusion does not create an independent test set.
Several first lows may pair with the same second low. The scanner keeps the pair with the higher mean reference score; an exact tie retains the pair encountered first. Overlapping formations with different second lows remain separate results. DUPLICATES_SKIPPED counts these same-second-low competitions, not all overlapping intervals.
Results are sorted from earliest to latest second-low time. If their number exceeds Input_MaxScanDetections, the earliest results are retained and TRUNCATED is set. Status totals describe that retained collection. The panel initially displays up to five rows from the end of the retained list. SCROLL UP or SCROLL DOWN moves the visible window by one record.
Selecting a row loads the retained scan result for review. SHOW ON CHART draws its lows, neckline and boundary, plus the decisive candle for CONFIRMED or FAILED results. A CANDIDATE has no decisive candle. REFERENCE_MATCHES.csv records the settings, totals and one detailed row per retained result.
A historical result is not added automatically to CPatternLibrary. Its M# identifier belongs to the current scan report, while BEST_REFERENCE_ID points to a persistent SAMPLE_<ID>.csv file. This distinction prevents an unreviewed detection from becoming a new reference just because it passed the similarity threshold.
Both identifiers remain in the detailed result row for later checking.
SHOW ON CHART does not modify stored samples. It reconstructs the retained result from the copied history. If a detected formation deserves a permanent place in the library, it can be reviewed on the chart and recorded through the normal rectangle workflow. The next scan will then treat it according to the same validation and reference rules as the existing samples.
MQL5 implementation
The completed project contains ten source files. Historical processing is contained in DoubleBottomHistoricalScanner.mqh. It loads completed bars, prepares references, evaluates low pairs, compares profiles and writes the report. The library supplies stored samples, while the existing validator handles both reference qualification and historical pair evaluation.
PatternRecorderPanel.mqh starts the scan and manages the visible result list. The renderer displays a selected result without searching for its structure again. The attached chart supplies the symbol and timeframe being searched, while pattern-depth normalization allows references from different price ranges to be compared. The implementation below concentrates on the scanner, panel controls and report fields added for this search.
1. Scanner settings and result data
SDoubleBottomScanSettings keeps the historical limits separate from SDoubleBottomSettings. The validator still owns the pattern rules, while the scanner owns history length, maximum pair length, follow-up bars and reference comparison.
#define DOUBLE_BOTTOM_DETECTION_FILE "REFERENCE_MATCHES.csv"

//--- Stores the limits applied specifically to historical discovery
struct SDoubleBottomScanSettings
  {
   int               bars_to_scan;
   int               max_low_separation;
   int               followup_bars;
   int               max_detections;
   int               profile_points;
   int               min_reference_samples;
   int               reference_neighbors;
   double            min_reference_similarity_score;
   bool              exclude_recorded_intervals;
  };

//--- Identifies one unique pair and its final result in the scan range
struct SDoubleBottomDetection
  {
   ulong             id;
   int               range_start_index;
   int               range_end_index;
   ulong             best_reference_id;
   double            best_reference_similarity_score;
   double            reference_similarity_score;
   SDoubleBottomValidation result;
  };
SDoubleBottomDetection retains the validation result, drawing range and reference values needed by the panel and report. Before chart review, BuildDoubleBottomDetectionSample() translates the history indices into positions within the compact review sample. The selected structure, prices and status remain unchanged.
The summary structure records bars scanned, swing lows, pairs evaluated, structural candidates, similarity rejections, recorded-interval exclusions, same-second-low competitions and the three status counts. These values explain how the retained collection was produced.
2. Loading completed bars
CopyRates() starts at shift one to exclude the forming candle from the scan. The copied rates are accessed in chronological order and converted into SCandleData records.
//+------------------------------------------------------------------+
//| Converts completed chart bars into one temporary history sample  |
//+------------------------------------------------------------------+
bool LoadDoubleBottomScanHistory(const string symbol,
                                 const ENUM_TIMEFRAMES timeframe,
                                 const int bars_to_scan,
                                 SPatternSample &history,
                                 string &error)
  {
   MqlRates rates[];
   ResetLastError();

//--- Start at shift one so the current forming candle is excluded
   int copied = CopyRates(symbol, timeframe, 1, bars_to_scan, rates);
   int copy_error = GetLastError();

//--- Report insufficient history separately from synchronization
   if(copied < 2)
     {
      error = "Copied " + IntegerToString(copied) +
              " completed bars. Load chart history and retry.";
      if(copy_error != 0)
         error += " CopyRates error: " + IntegerToString(copy_error);
      return(false);
     }

//--- Require synchronized history before evaluating the copied bars
   if(!SeriesInfoInteger(symbol, timeframe, SERIES_SYNCHRONIZED))
     {
      error = "Chart history is not synchronized. Wait and retry.";
      return(false);
     }

   ArraySetAsSeries(rates, false);

//--- Initialize the temporary history sample
   InitPatternSample(history, 0, PATTERN_DOUBLE_BOTTOM_CANDIDATE,
                     symbol, timeframe,
                     rates[0].time, rates[copied - 1].time,
                     "Historical scan source");

//--- Convert copied rates into candle records
   for(int i = 0; i < copied; i++)
     {
      SCandleData candle;
      candle.time = rates[i].time;
      candle.open = rates[i].open;
      candle.high = rates[i].high;
      candle.low = rates[i].low;
      candle.close = rates[i].close;
      candle.tick_volume = rates[i].tick_volume;

      CalculateCandleDerived(candle);
      candle.norm_open = 0.0;
      candle.norm_high = 0.0;
      candle.norm_low = 0.0;
      candle.norm_close = 0.0;

      //--- Reject invalid candles or a failed append operation
      if(!MathIsValidNumber(candle.open) ||
         !MathIsValidNumber(candle.high) ||
         !MathIsValidNumber(candle.low) ||
         !MathIsValidNumber(candle.close) ||
         candle.low <= 0.0 ||
         candle.low > MathMin(candle.open, candle.close) ||
         candle.high < MathMax(candle.open, candle.close) ||
         (i > 0 && candle.time <= history.candles[i-1].time) ||
         !AddCandleToSample(history, candle))
        {
         error = "Invalid history candle or allocation failure.";
         return(false);
        }
     }

//--- Normalize the copied sample
   if(!NormalizeSample(history))
     {
      error = "The copied history could not be normalized.";
      return(false);
     }

//--- Retain the actual copied interval
   history.start_time = history.candles[0].time;
   history.end_time = history.candles[history.bars - 1].time;
   error = "";
   return(true);
  }
The history is stored in a temporary sample with ID zero. It is not added to the permanent library. Historical results receive local result IDs for panel and CSV use, but they do not become recorded samples automatically.
3. Building the shape profile
InterpolateDoubleBottomProfilePrice() reads a close or low at a fractional position between the two selected lows. BuildDoubleBottomShapeProfile() calls it for every profile point and fills both halves of the vector.
//+------------------------------------------------------------------+
//| Builds fixed-length close and low profiles for one structure     |
//+------------------------------------------------------------------+
bool BuildDoubleBottomShapeProfile(
   const SPatternSample &sample,
   const SDoubleBottomValidation &result,
   const int profile_points,
   double &profile[],
   string &error)
  {
   ArrayResize(profile, 0);
   int first = result.first_low_index;
   int second = result.second_low_index;
   if(first < 0 || second <= first || second >= sample.bars ||
      result.pattern_depth <= 0.0 || profile_points < 2 || profile_points > 128)
     {
      error = "The structure cannot be converted into a shape profile.";
      return(false);
     }

   int dimension = profile_points * 2;
   if(sample.bars != ArraySize(sample.candles) ||
      !MathIsValidNumber(result.pattern_depth) || !MathIsValidNumber(result.neckline_price) ||
      ArrayResize(profile, dimension) != dimension)
     {
      error = "Invalid profile inputs or allocation failure.";
      return(false);
     }
   double average_low = result.neckline_price - result.pattern_depth;
   double sequence_span = (double)(second - first);
   for(int point = 0; point < profile_points; point++)
     {
      double position = sequence_span * point /
                        (double)(profile_points - 1);
      double close_price = InterpolateDoubleBottomProfilePrice(
                              sample, first, second, position, false);
      double low_price = InterpolateDoubleBottomProfilePrice(
                            sample, first, second, position, true);
      profile[point] = ClampDoubleBottomProfileValue(
                          (close_price - average_low) / result.pattern_depth);
      profile[profile_points + point] = ClampDoubleBottomProfileValue(
                                           (low_price - average_low) / result.pattern_depth);
     }
   error = "";
   return(true);
  }
The profile uses the exact pair selected by the validator. It does not search for new lows or recalculate the neckline. The resampled values are used only for comparison; original candles and times remain available for the report and chart review.
4. Preparing reference profiles
PrepareDoubleBottomReferenceProfiles() obtains the complete sample array from CPatternLibrary. Each sample is passed to ValidateDoubleBottom(). Only accepted candidates and confirmed formations continue to profile construction.
//+------------------------------------------------------------------+
//| Builds usable profiles from the stored sample library            |
//+------------------------------------------------------------------+
bool PrepareDoubleBottomReferenceProfiles(
   CPatternLibrary *library,
   const SDoubleBottomSettings &validation_settings,
   const SDoubleBottomScanSettings &scan_settings,
   ulong &reference_ids[],
   double &reference_profiles[],
   SDoubleBottomScanSummary &summary,
   string &error)
  {
   ArrayResize(reference_ids, 0);
   ArrayResize(reference_profiles, 0);
   if(CheckPointer(library) == POINTER_INVALID || !library.IsReady())
     {
      error = "The pattern library is not available.";
      return(false);
     }

   SPatternSample samples[];
   if(!library.GetAllSamples(samples))
     {
      error = "Cannot allocate the reference snapshot.";
      return(false);
     }
   summary.reference_samples_total = ArraySize(samples);
   int dimension = scan_settings.profile_points * 2;
   for(int i = 0; i < summary.reference_samples_total; i++)
     {
      SDoubleBottomValidation validation;
      bool accepted = ValidateDoubleBottom(samples[i], validation_settings,
                                           validation);
      if(validation.execution_error)
        {
         error = validation.reason;
         return(false);
        }
      if(!accepted ||
         (validation.status != DOUBLE_BOTTOM_CANDIDATE &&
          validation.status != DOUBLE_BOTTOM_CONFIRMED))
        {
         summary.reference_samples_skipped++;
         continue;
        }

      double profile[];
      string profile_error;
      if(!BuildDoubleBottomShapeProfile(samples[i], validation,
                                        scan_settings.profile_points,
                                        profile, profile_error))
        {
         error = profile_error;
         return(false);
        }

      int reference_index = ArraySize(reference_ids);
      if(reference_index >= 100000 ||
         ArrayResize(reference_ids, reference_index + 1) != reference_index + 1 ||
         ArrayResize(reference_profiles, (reference_index+1)*dimension) != (reference_index+1)*dimension)
        {
         error = "Cannot allocate reference profiles.";
         return(false);
        }
      reference_ids[reference_index] = samples[i].id;

      for(int value = 0; value < dimension; value++)
         reference_profiles[reference_index * dimension + value] =
            profile[value];
     }

   summary.reference_samples_used = ArraySize(reference_ids);
   if(summary.reference_samples_used < scan_settings.min_reference_samples)
     {
      error = "Only " + IntegerToString(summary.reference_samples_used) +
              " usable reference sample(s) were found; " +
              IntegerToString(scan_settings.min_reference_samples) +
              " are required.";
      return(false);
     }
   error = "";
   return(true);
  }
Reference IDs and profile values are kept in parallel arrays. Every reference occupies one continuous block of profile_points * 2 values. After preparation, the function stops the scan if the usable count is below min_reference_samples.
5. Calculating similarity
The distance helper reads one candidate profile and one reference block. It calculates the root mean square error across their close and low values, then converts that distance into a similarity score using 100 / (1 + RMSE).
//+------------------------------------------------------------------+
//| Converts profile distance into a similarity score                |
//+------------------------------------------------------------------+
double CalculateDoubleBottomProfileSimilarity(
   double &candidate_profile[],
   double &reference_profiles[],
   const int reference_offset,
   const int profile_dimension)
  {
   if(profile_dimension < 1 || reference_offset < 0 ||
      ArraySize(candidate_profile) < profile_dimension ||
      reference_offset > ArraySize(reference_profiles)-profile_dimension)
      return(-1.0);
   double squared_error = 0.0;
   for(int i = 0; i < profile_dimension; i++)
     {
      double difference = candidate_profile[i] -
                          reference_profiles[reference_offset + i];
      squared_error += difference * difference;
     }
   double root_mean_square_error =
      MathSqrt(squared_error / profile_dimension);
   return(100.0 / (1.0 + root_mean_square_error));
  }
CompareDoubleBottomWithReferences() inserts each score into a descending list containing only the required nearest neighbors. After all references have been checked, the first entry supplies the closest reference ID and its score. The mean of the nearest scores becomes reference_similarity_score.
This method avoids sorting every score for every historical pair. If fewer references are available than the requested neighbor count, all available references are used. The minimum-reference check has already confirmed that the scan has enough profiles to begin.
6. Searching historical swing-low pairs
The scanner finds the historical swing lows once. It then evaluates ordered pairs whose separation falls between the validator minimum and the scanner maximum. Classification is limited to the configured number of follow-up bars after the second low.
//+------------------------------------------------------------------+
//| Finds accepted double-bottom pairs in completed chart history    |
//+------------------------------------------------------------------+
bool ScanDoubleBottomHistory(
   CPatternLibrary *library,
   const string symbol,
   const ENUM_TIMEFRAMES timeframe,
   const SDoubleBottomSettings &validation_settings,
   const SDoubleBottomScanSettings &scan_settings,
   SPatternSample &history,
   SDoubleBottomDetection &detections[],
   SDoubleBottomScanSummary &summary,
   string &error)
  {
   InitDoubleBottomScanSummary(summary);
   ArrayResize(detections, 0);
   if(!CheckDoubleBottomScanSettings(validation_settings, scan_settings,
                                     error))
      return(false);

   SPatternSample recorded[];
   if(CheckPointer(library) == POINTER_INVALID || !library.IsReady() || !library.GetAllSamples(recorded))
     {
      error = "Cannot obtain the stored collection.";
      return(false);
     }
//--- Build the reference set once before examining historical pairs
   ulong reference_ids[];
   double reference_profiles[];
   if(!PrepareDoubleBottomReferenceProfiles(library, validation_settings,
         scan_settings, reference_ids,
         reference_profiles, summary,
         error))
      return(false);
   if(!LoadDoubleBottomScanHistory(symbol, timeframe,
                                   scan_settings.bars_to_scan,
                                   history, error))
      return(false);

   summary.symbol = symbol;
   summary.timeframe = timeframe;
   summary.history_start = history.start_time;
   summary.history_end = history.end_time;
   summary.bars_scanned = history.bars;

//--- Discover each swing low once before evaluating eligible pairs
   int swing_lows[];
   summary.swing_lows = FindValidationSwingLows(
                           history, validation_settings.pivot_strength, swing_lows);
   if(summary.swing_lows < 0)
     {
      error = "Cannot allocate historical swing-low indices.";
      return(false);
     }
   for(int first = 0; first < summary.swing_lows - 1; first++)
     {
      for(int second = first + 1; second < summary.swing_lows; second++)
        {
         if(IsStopped())
           {
            error = "Historical scan interrupted.";
            return(false);
           }
         int first_index = swing_lows[first];
         int second_index = swing_lows[second];
         int separation = second_index - first_index;
         if(separation < validation_settings.min_low_separation)
            continue;
         if(separation > scan_settings.max_low_separation)
            break;

         summary.pairs_evaluated++;
         int evaluation_end = MathMin(history.bars - 1,
                                      second_index +
                                      scan_settings.followup_bars);
         SDoubleBottomValidation result;
         if(!EvaluateDoubleBottomPairRange(history, validation_settings,
                                           first_index, second_index,
                                           evaluation_end, result))
            continue;
         summary.structural_candidates++;

         //--- Exclude intervals the trader has already stored as references
         if(scan_settings.exclude_recorded_intervals &&
            IsRecordedDoubleBottomInterval(recorded, history, result))
           {
            summary.recorded_intervals_skipped++;
            continue;
           }

         //--- Require agreement with several of the nearest stored examples
         ulong best_reference_id = 0;
         double best_similarity_score = 0.0;
         double reference_similarity_score = 0.0;
         string comparison_error;
         if(!CompareDoubleBottomWithReferences(
               history, result, scan_settings, reference_ids,
               reference_profiles, best_reference_id,
               best_similarity_score, reference_similarity_score,
               comparison_error))
           {
            error = comparison_error;
            return(false);
           }
         if(reference_similarity_score <
            scan_settings.min_reference_similarity_score)
           {
            summary.similarity_rejected++;
            continue;
           }

         int equivalent = FindEquivalentDoubleBottomDetection(detections,
                          result);
         if(equivalent >= 0)
           {
            summary.duplicates_skipped++;
            if(reference_similarity_score >
               detections[equivalent].reference_similarity_score)
               SetDoubleBottomDetection(detections[equivalent],
                                        detections[equivalent].id,
                                        result, evaluation_end,
                                        validation_settings.pivot_strength,
                                        best_reference_id,
                                        best_similarity_score,
                                        reference_similarity_score);
            continue;
           }
         if(!AddDoubleBottomDetection(detections, result, evaluation_end,
                                  validation_settings.pivot_strength,
                                  best_reference_id,
                                  best_similarity_score,
                                  reference_similarity_score))
           {
            error = "Cannot allocate retained results.";
            return(false);
           }
        }
     }

   SortDoubleBottomDetections(detections);
   if(ArraySize(detections) > scan_settings.max_detections)
     {
      ArrayResize(detections, scan_settings.max_detections);
      summary.truncated = true;
     }
   CountDoubleBottomDetectionStatuses(detections, summary);
   summary.generated_at = TimeLocal();
   return(SaveDoubleBottomDetectionSummary(history, detections,
                                           validation_settings,
                                           scan_settings, summary, error));
  }
After structural acceptance, IsRecordedDoubleBottomInterval() removes known samples when exclusion is enabled. The remaining result is converted into a candidate profile and passed to the reference comparison. A result below min_reference_similarity_score increases the similarity-rejection count and does not enter the retained-results array.
When two retained pairs use the same second-low index, FindEquivalentDoubleBottomDetection() locates the existing result. The scanner keeps whichever pair has the higher consensus similarity. This reduces repeated interpretations around one market turn.
7. Writing the report
SaveDoubleBottomDetectionSummary() creates the report folder when necessary. The CSV contains labelled METADATA, SUMMARY, SETTINGS and RESULTS sections. Metadata identifies the report schema, scanner revision, reference scope and score interpretation. Summary and settings each contain a header and value row; the results section contains one row per retained result.
The results header is shown below:
report += "RESULT_ID" + "," +
             "STATUS" + "," +
             "STRUCTURAL_SCORE" + "," +
             "REFERENCE_SIMILARITY_SCORE" + "," +
             "BEST_REFERENCE_ID" + "," +
             "BEST_REFERENCE_SIMILARITY_SCORE" + "," +
             "RANGE_START" + "," +
             "RANGE_END" + "," +
             "FIRST_LOW_TIME" + "," +
             "SECOND_LOW_TIME" + "," +
             "NECKLINE_TIME" + "," +
             "DECISION_TIME" + "," +
             "FIRST_LOW_INDEX" + "," +
             "SECOND_LOW_INDEX" + "," +
             "NECKLINE_INDEX" + "," +
             "BREAKOUT_INDEX" + "," +
             "FAILURE_INDEX" + "," +
             "SEPARATION_BARS" + "," +
             "FIRST_LOW_PRICE" + "," +
             "SECOND_LOW_PRICE" + "," +
             "NECKLINE_PRICE" + "," +
             "PATTERN_DEPTH" + "," +
             "DEPTH_PCT" + "," +
             "LOW_DIFFERENCE_PCT" + "," +
             "SYMMETRY_PCT" + "," +
             "RECOVERY_PCT" + "," +
             "REASON" + "\r\n";
The summary separates structural candidates from retained results and records interval exclusions, score rejections, same-second-low competitions and truncation. Detailed rows contain timestamps as well as indices. SCAN_TIME uses the terminal computer's local clock; candle times retain the history's time basis. DECISION_TIME is the opening timestamp of the breakout or failure candle; it is blank for CANDIDATE results. It is not the instant at which a live signal became available.
RANGE_START and RANGE_END describe the compact chart-review interval. For a decisive result, RANGE_END is its breakout or failure candle. The recovery measurement still considers the full bounded follow-up window, so it may include candles after that review endpoint.
Numerical values are written with sufficient precision to preserve the stored doubles. The destination is:
MQL5\Files\PatternLibrary\DOUBLE_BOTTOM_CANDIDATE\REFERENCE_MATCHES.csv
The writer saves a temporary UTF-8 file and verifies its bytes before replacing the report. It reports write, verification or replacement failures. A successful scan replaces REFERENCE_MATCHES.csv without modifying SAMPLE_<ID>.csv files. Copy the report elsewhere before another scan if both runs must be retained, and close applications holding the destination file open.
The CSV records the closest reference ID, but not every contributing neighbor profile. Reproducing the comparison therefore also requires the library snapshot and scanned candle history used for that run.
8. Extending the panel
The panel adds SCAN REFERENCE MATCHES, SCROLL UP and SCROLL DOWN. Scrolling remains a separate panel action rather than drawing more rows beyond the panel boundary. Starting a scan clears the previous chart review and visible list, then passes the attached chart's symbol and timeframe to ScanDoubleBottomHistory().
//+------------------------------------------------------------------+
//| Scans completed chart history and exports all accepted pairs     |
//+------------------------------------------------------------------+
void CRecorderPanel::OnScanHistory()
  {
   ResetValidationState();
   if(!m_renderer.Clear())
     {
      ShowStatus("Review cleanup failed. Retry CLEAR MARKERS.", true);
      return;
     }
   m_selected_sample_id = 0;
   m_selected_detection_index = -1;
   m_list_mode = RECORDER_LIST_NONE;
   m_list_start = 0;
   DeleteObjectsWithPrefix(m_sample_prefix);
   DeleteObjectsWithPrefix(m_detection_prefix);

   string error;
   bool saved = ScanDoubleBottomHistory(m_library,
                                        ChartSymbol(m_chart_id),
                                        ChartPeriod(m_chart_id),
                                        m_validation_settings,
                                        m_scan_settings,
                                        m_scan_history,
                                        m_detections,
                                        m_scan_summary, error);
   if(m_scan_summary.bars_scanned > 0)
      ShowScanSummary(m_scan_summary);
   if(!saved)
     {
      m_list_mode = RECORDER_LIST_NONE;
      ShowStatus("Historical scan: " + error, true);
      return;
     }

   m_list_mode = RECORDER_LIST_DETECTIONS;
   m_list_start = MathMax(0, m_scan_summary.detections -
                          RECORDER_VISIBLE_LIST_ROWS);
   RefreshDetectionList();
   ShowStatus("Compared " +
              IntegerToString(m_scan_summary.structural_candidates) +
              " structural candidates with " +
              IntegerToString(m_scan_summary.reference_samples_used) +
              " references. Found " +
              IntegerToString(m_scan_summary.detections) + " result(s).",
              false);
   ChartRedraw(m_chart_id);
  }
Five list rows are created from m_list_start. The scroll buttons increase or decrease that starting position by one and redraw the active list. This same mechanism is used by stored samples and historical results.
Clicking a result calls BuildDoubleBottomDetectionSample(). The function copies the retained history interval and changes the original history indices into local sample indices. The existing renderer can then display the result without special historical drawing code.
9. Expert Advisor inputs
The historical controls are exposed beside the existing validator settings so comparisons can be repeated without editing source code. The baseline search uses the following default values:
//--- Inputs bound the current-chart historical discovery pass
input int Input_ScanBars = 2000;
input int Input_MaxScanLowSeparation = 80;
input int Input_ScanFollowupBars = 40;
input int Input_MaxScanDetections = 200;
input int Input_ReferenceProfilePoints = 32;
input int Input_MinReferenceSamples = 3;
input int Input_ReferenceNeighbors = 3;
input double Input_MinReferenceSimilarityScore = 75.0;
input bool Input_ExcludeRecordedIntervals = true;
Initialization checks the inputs before creating the panel. Requested history and follow-up limits must be between 20–100,000 and 1–100,000 bars respectively. Maximum low separation cannot be below the validator minimum. Profile length must be between 8 and 128 points, and the minimum similarity score must be between 25 and 100. The reference minimum, neighbor count and result limit must be positive.
For comparison tests, change one input at a time. Changing profile length, neighbor count and similarity threshold together would make it difficult to explain which setting changed the result list.
Installing and testing
Copy the supplied Experts and Include folders into the corresponding folders under MQL5 in the terminal’s Data Folder. Compile DoubleBottomRecorderEA.mq5 in MetaEditor, then attach it to the chart to be examined.
The reference search was tested on USDCAD M30 with 12 previously recorded samples. Seven samples qualified as references. The scanner identified 148 structural candidates and retained 72 reference-guided results: nine CANDIDATE, 42 CONFIRMED and 21 FAILED. The result list displayed similarity scores, reference sample identifiers, classifications and second-low times.
The recording demonstrates scanning, selecting results and reviewing their structures on historical chart data. Selecting a result populated the review area with its structural measurements and reference-comparison values. SHOW ON CHART moved the chart to the corresponding historical interval and displayed the pattern annotations.
Result #72 provided a confirmed example. Its similarity score was 88.4, with sample #10 as the closest reference. Candle indices are zero-based positions within the selected result’s chart-review sample. The review panel reported the following measurements:
| Measurement | Value |
|---|---|
| Status | CONFIRMED |
| Structural score | 68.3 |
| First and second low indices | #2 and #10 |
| Low separation | 8 bars |
| Neckline | #6 at 1.42157 |
| Low difference | 13.8% |
| Depth | 0.062% |
| Symmetry | 100% |
| Recovery | 100% |
The chart annotations identified the two lows, neckline and confirming breakout candle. Result #62 remained CANDIDATE despite achieving a similarity score of 85.1 against reference #10. This illustrates the distinction between profile resemblance and outcome classification: a high similarity score does not establish confirmation.
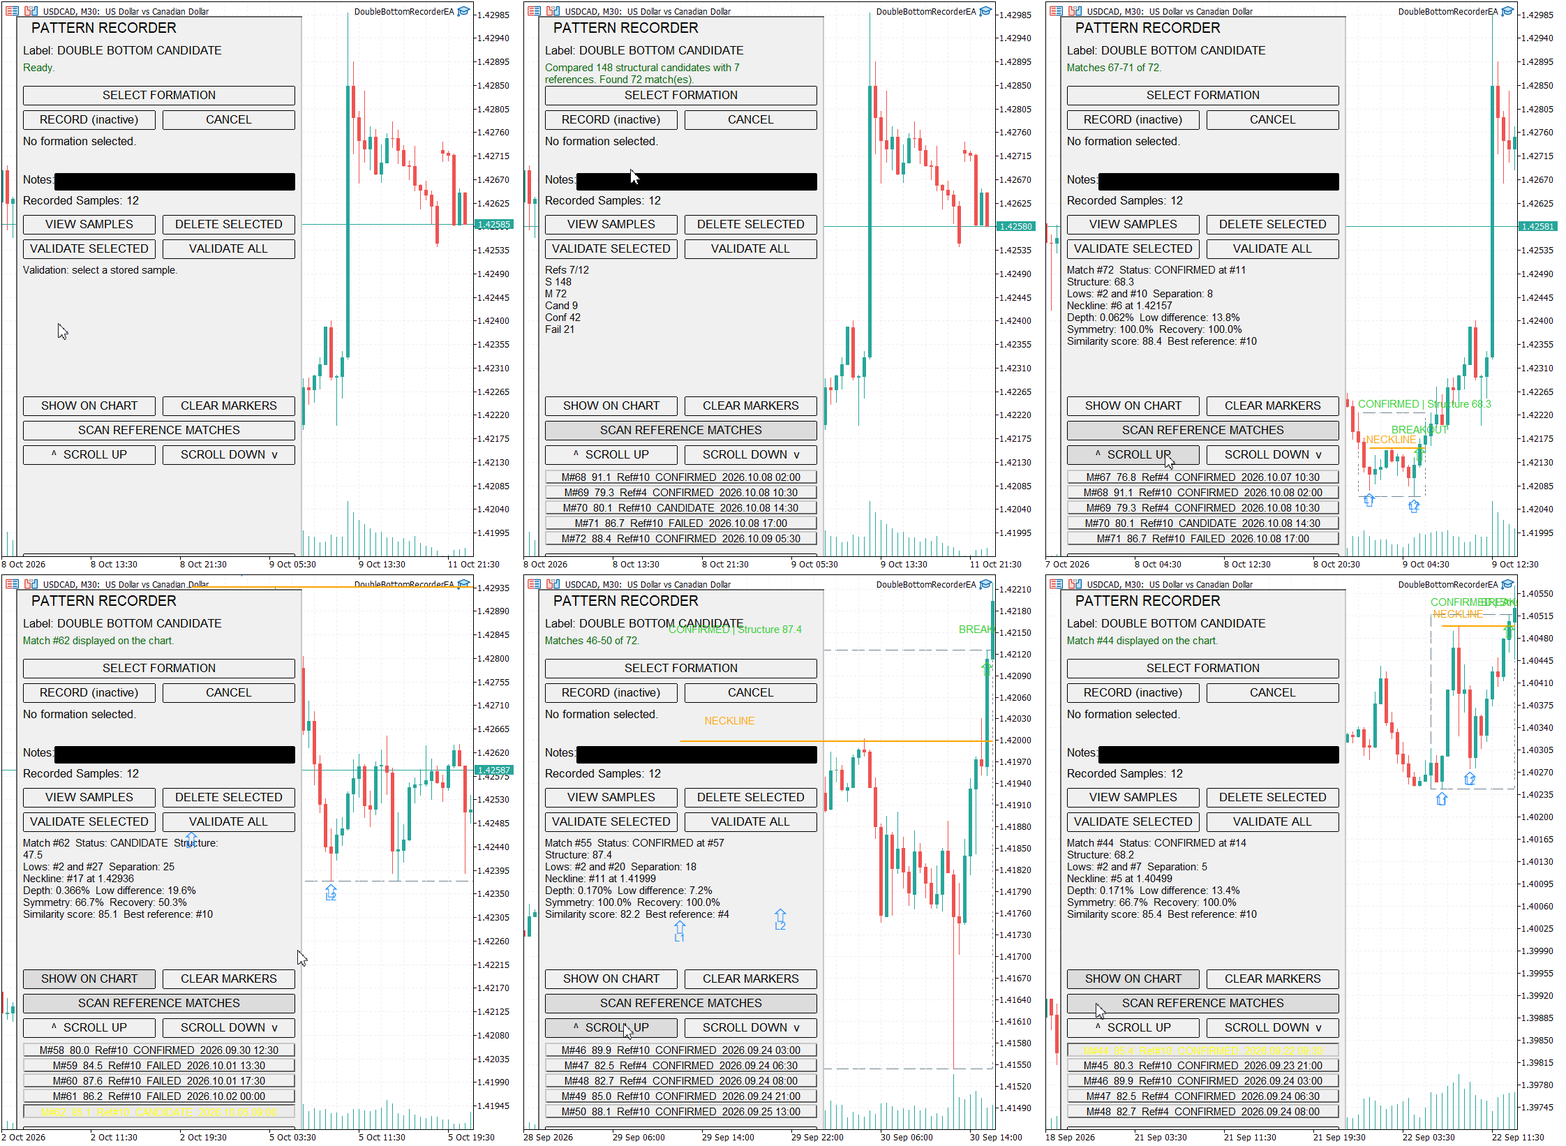
Figure 2. Reference scanning and historical chart review on USDCAD M30, including CONFIRMED and CANDIDATE results.
The test demonstrates the scanning and chart-review workflow. Recognition accuracy and threshold selection remain outside the scope of this demonstration.
Conclusion
Part 87 uses a manually recorded library to retrieve similar structures from completed chart history. The validator supplies the lows, neckline and geometric checks. Close and low profiles then provide a numerical comparison with eligible references, while the result status records the subsequent price action within the evaluation window.
The panel supports result selection, scrolling and chart review. REFERENCE_MATCHES.csv preserves the settings, totals, similarity scores and structural measurements for the retained collection. Keeping the reference files and source history alongside the report makes the comparison reproducible.
This establishes a historical review workflow. Search accuracy, performance across markets and trading usefulness require separate evidence from independently labelled data. The next stage can build on this foundation by processing completed bars sequentially and tracking when each status becomes available.
Attachments
| Name | Type | Responsibility |
|---|---|---|
| DoubleBottomRecorderEA.mq5 | Expert Advisor | Exposes recorder, validator and reference-search inputs; initializes the library and panel; forwards chart events. |
| DoubleBottomHistoricalScanner.mqh | Include | Loads completed history, builds profiles, compares references, retains historical results and writes the CSV report. |
| PatternRecorderPanel.mqh | Include | Manages recording, validation, scanning, list scrolling, selection and chart review. |
| DoubleBottomValidator.mqh | Include | Finds swing lows, evaluates low pairs, calculates measurements and assigns validation status. |
| DoubleBottomRenderer.mqh | Include | Draws the retained sample or historical result on its source chart. |
| DoubleBottomBatchValidator.mqh | Include | Validates the complete stored sample collection and writes its summary report. |
| PatternLibrary.mqh | Include | Owns the in-memory sample collection and coordinates persistence. |
| PatternStorage.mqh | Include | Reads, writes, discovers and deletes individual sample CSV files. |
| PatternExtractor.mqh | Include | Converts the chart rectangle into structured and normalized candle data. |
| PatternData.mqh | Include | Defines the shared candle and sample structures and helper functions. |
| MQL5.zip | Archive | Contains the complete project in the required MetaTrader 5 Data Folder structure. |
Warning: All rights to these materials are reserved by MetaQuotes Ltd. Copying or reprinting of these materials in whole or in part is prohibited.
This article was written by a user of the site and reflects their personal views. MetaQuotes Ltd is not responsible for the accuracy of the information presented, nor for any consequences resulting from the use of the solutions, strategies or recommendations described.

 Neural Networks in Trading: A Spiking-Semantic Approach to Spatiotemporal Identification (S3CE-Net)
 Beyond Tick Volume: Measuring Market Activity from the Waits Between Quotes
 Beyond Clone and Commit: The Advanced Side of MQL5 Algo Forge
 MetaTrader 5 Machine Learning Blueprint (Part 23): Feature Screening

- Free trading apps
- Over 8,000 signals for copying
- Economic news for exploring financial markets
You agree to website policy and terms of use