

Price Action Analysis Toolkit Development (Part 85): Visualizing and Reviewing Validated Double-Bottom Samples
 384
384
 0
0

Contents
- Introduction
- Seeing what the validator selected
- Designing the review layer
- System architecture
- MQL5 implementation
- Installing and operating the visual reviewer
- Testing
- Reviewing the validator’s decisions
- Conclusion
Introduction
A validator can be mathematically consistent and still be awkward to review. When the panel reports two low indices and a neckline index, the result is precise, but the trader must translate those numbers back into candles and find the sample's historical date. That interruption becomes costly as the library grows.
A status such as CONFIRMED also tells the developer that a branch was reached without showing whether the chosen pair agrees with the intended chart interpretation. A sample may contain several local lows. If the algorithm and the reviewer select different pairs, the mismatch may indicate a questionable label, a threshold worth studying, or a different structure within the interval.
Part 85 makes the result inspectable. SHOW ON CHART verifies the sample's symbol and timeframe, navigates to the saved period, and draws the boundary, the two lows, the neckline, the classification, and the score. Confirmed and failed results receive their decisive markers; a candidate shows its accepted structure without inventing an outcome. Invalid results retain their explanation in the panel and remain undrawn.
The trader gains a disciplined way to examine references. The developer gains a visible diagnostic surface for indices, coordinates, and state changes. By the end, the stored sample, the validation result, and the historical chart function as a single review session while keeping separate code responsibilities.
Seeing what the validator selected
From indices to market structure
The validation result already contains the drawing coordinates. Its low and neckline indices identify candles in the sample array, while breakout_index or failure_index identify the first decisive close. Prices provide vertical coordinates and candle times provide horizontal coordinates.
This is where two descriptions of one formation meet. The validator uses indices for loops and comparisons; the chart uses time and price for graphical objects. The renderer connects them through the stored candles. It does not search again for lows, recalculate the neckline or reclassify the outcome. Otherwise, the panel could report one interpretation while the chart drew another.
A stable visual grammar
Consistent annotations make samples easier to compare. The qualifying lows use blue arrows labeled L1 and L2; the neckline is orange. Green identifies a breakout and red identifies a failure. A dashed gray rectangle frames the stored interval, while a label above it combines status with the structural score. Text and tooltips keep meaning available without relying on color or crowding the chart.
The rectangle marks the stored evidence interval. It does not prevent the reviewer from considering surrounding candles. Its right edge is extended by one timeframe period because the stored end time is the opening time of the last candle; the extension includes that final bar.
Chart context is part of the evidence
A candle coordinate is meaningful only with its symbol and timeframe. An EURUSD M30 result drawn on H1 might produce objects, but they would no longer represent the stored sequence.
The renderer compares ChartSymbol() and ChartPeriod() with the sample metadata before creating anything. On a mismatch, the panel names the chart to open. It does not call ChartSetSymbolPeriod (). Changing the chart that hosts an Expert Advisor can reinitialize the program and discard the retained review state.
Before navigation, the renderer compares every stored candle time and OHLC value with the chart history. Price comparisons allow only a small floating-point tolerance, not a tick-size approximation. It then uses iBarShift() with exact=true for the final candle and requests a shift from CHART_END. Auto-scroll is paused during review. Cleanup attempts to restore the saved scrolling setting and reports failure if it cannot.
One review at a time
The renderer attempts to clear existing review objects before drawing another result. Draw() stops if cleanup fails. The panel also requests cleanup when the selected sample changes or the interface closes.
CLEAR MARKERS keeps the retained validation result so it can be displayed again. Selecting another sample resets that result and requests removal of its annotations. If object deletion fails, some annotations may remain; Clear() reports the failure in the log.
Invalid results remain available for the panel's explanation, but SHOW ON CHART refuses to mark two lows as though they passed the active rules. Their absence is deliberate output, not a drawing failure.
Designing the review layer
The visual reviewer preserves sample data. It consumes an SPatternSample and an SDoubleBottomValidation without changing stored candles, IDs or CSV files. It does change chart state by creating objects, navigating and pausing auto-scroll. The panel decides when review starts or ends; the renderer owns object creation, styling, error cleanup and scrolling restoration.
Each drawing helper returns bool, and Draw() combines those results. Styling helpers set and read back object properties. If creation or styling fails, the renderer attempts to remove the partial set and reports the error. Cleanup failures are reported separately; drawing is not an atomic transaction. Labels are offset by 3.5 percent of the sample's price span, with a point-based fallback, so spacing follows the formation rather than one instrument-specific distance.
System architecture
Part 85 adds DoubleBottomRenderer.mqh and extends PatternRecorderPanel.mqh. The validator remains responsible for structure, the library still owns samples, and storage continues to preserve CSV files. The Expert Advisor requires no new chart logic because it already forwards object-click events to the panel.
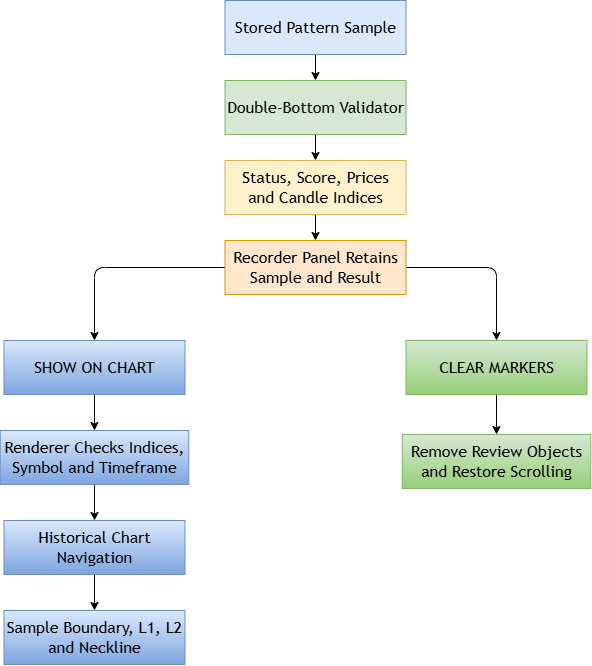
Figure 1. System architecture flow.
The panel retains both the sample and the validation result. Drawing needs indices and scores from the result, and candle times plus symbol/timeframe context from the sample. Keeping only the result would force the renderer to reopen the storage layer or to reconstruct context that was already available during validation.
MQL5 implementation
The completed project contains eight source files. Seven continue the recorder and validator developed earlier; the new renderer contains the chart-review logic. The excerpts below follow the path from its contract to its panel integration. The attachment contains the complete compile-ready project.
1. Declaring the renderer contract
CDoubleBottomRenderer exposes three public operations. Configure() identifies the destination chart and reserved naming prefix. Draw() receives a sample and its completed validation. Clear() removes review objects and restores the saved auto-scroll setting, returning false if cleanup is incomplete. The private methods separate context checks, navigation and graphical primitives from the composition of a complete result.
//+------------------------------------------------------------------+
//| Draws a validated double-bottom structure on its source chart    |
//+------------------------------------------------------------------+
class CDoubleBottomRenderer
  {
private:
   long              m_chart_id;
   int               m_subwin;
   string            m_prefix;
   bool              m_restore_autoscroll;
   bool              m_previous_autoscroll;

   bool              CheckChartContext(const SPatternSample &sample,
                                       string &error);
   bool              CheckResultIndices(const SPatternSample &sample,
                                        const SDoubleBottomValidation &result,
                                        string &error);
   bool              NavigateToSample(const SPatternSample &sample,
                                      string &error);
   bool              SetInteger(const string name, const ENUM_OBJECT_PROPERTY_INTEGER property, const long value);
   bool              SetString(const string name, const ENUM_OBJECT_PROPERTY_STRING property, const string value);
   bool              StyleObject(const string name, const color object_color,
                                 const int width, const ENUM_LINE_STYLE style,
                                 const bool draw_in_background = false);
   bool              CreateRectangle(const SPatternSample &sample);
   bool              CreateNeckline(const SPatternSample &sample,
                                    const SDoubleBottomValidation &result);
   bool              CreateArrow(const string suffix,
                                 const ENUM_OBJECT arrow_type,
                                 const datetime time,
                                 const double price,
                                 const color arrow_color,
                                 const string tooltip);
   bool              CreateText(const string suffix, const datetime time,
                                const double price, const string text,
                                const color text_color,
                                const ENUM_ANCHOR_POINT anchor,
                                const string tooltip);
   color             StatusColor(const ENUM_DOUBLE_BOTTOM_STATUS status);

public:
                     CDoubleBottomRenderer();
   void              Configure(const long chart_id, const int subwin,
                               const string prefix);
   bool              Clear();
   bool              Draw(const SPatternSample &sample,
                          const SDoubleBottomValidation &result,
                          string &error);
  };
The scrolling fields are renderer state because navigation temporarily changes a chart property. They are not validation settings and do not belong in the sample. The object prefix is equally important: it creates an ownership boundary inside the chart's shared object collection.
2. Clearing owned objects and restoring chart behavior
Clear() scans the configured subwindow in reverse order. Reverse iteration is appropriate because deleting an object changes the remaining positions. Only names beginning with the renderer's reserved prefix are removed. Other chart objects remain untouched; manually created objects must not reuse that prefix.
//+------------------------------------------------------------------+
//| Removes every chart object created by the renderer               |
//+------------------------------------------------------------------+
bool CDoubleBottomRenderer::Clear()
  {
   bool ok = true;
   if(m_prefix == "")
      return(false);
//--- Remove only names in the reserved review namespace
   for(int i = ObjectsTotal(m_chart_id, m_subwin) - 1; i >= 0; i--)
     {
      string name = ObjectName(m_chart_id, i, m_subwin);
      if(StringFind(name, m_prefix) == 0)
        {
         bool removed = ObjectDelete(m_chart_id, name);
         if(!removed || ObjectFind(m_chart_id, name) >= 0)
            ok = false;
        }
     }
//--- Restore the saved setting, including any manual change during review
   if(m_restore_autoscroll)
     {
      bool restored = ChartSetInteger(m_chart_id, CHART_AUTOSCROLL,
                                       m_previous_autoscroll);
      long actual = 0;
      restored = restored && ChartGetInteger(m_chart_id, CHART_AUTOSCROLL, 0, actual)
                 && (bool)actual == m_previous_autoscroll;
      if(restored)
        {
         if(m_previous_autoscroll && !ChartNavigate(m_chart_id, CHART_END, 0))
            restored = false;
        }
      if(restored)
         m_restore_autoscroll = false;
      else
         ok = false;
     }
   if(!ok)
      Print("Chart review cleanup or scrolling restoration failed; retry Clear.");
   ChartRedraw(m_chart_id);
   return(ok);
  }
Clear() can be called when no review is visible. If review changed auto-scroll, it restores the value saved before navigation. This also overrides a manual auto-scroll change made during the review. When the saved value was on, cleanup requests navigation to the chart end; it does not restore the previous zoom or exact viewport. Failed restoration retains the pending state for another cleanup attempt and writes a diagnostic to the log.
3. Protecting the relationship between result and sample
The renderer rejects INVALID and checks the complete sample through the storage validator, including candle order, bounds and price extremes. Structural indices must satisfy L1 < neckline < L2, and their prices and separation must match the sample. A decisive index must follow L2 and agree with the status. These checks protect coordinate mapping; they do not independently repeat all validation rules or establish market validity.
//+------------------------------------------------------------------+
//| Checks the structural indices required for chart drawing         |
//+------------------------------------------------------------------+
bool CDoubleBottomRenderer::CheckResultIndices(
                                      const SPatternSample &sample,
                                      const SDoubleBottomValidation &result,
                                      string &error)
  {
   if(result.status == DOUBLE_BOTTOM_INVALID)
     {
      error = result.reason;
      return(false);
     }
   if(!ValidatePatternSample(sample))
     {
      error = "The stored sample does not contain complete candle data.";
      return(false);
     }
   if(result.first_low_index < 0 || result.first_low_index >= sample.bars ||
      result.second_low_index < 0 || result.second_low_index >= sample.bars ||
      result.neckline_index < 0 || result.neckline_index >= sample.bars)
     {
      error = "The validation result contains an invalid structure index.";
      return(false);
     }
   if(result.status == DOUBLE_BOTTOM_CONFIRMED &&
      (result.breakout_index < 0 || result.breakout_index >= sample.bars))
     {
      error = "The validation result contains an invalid breakout index.";
      return(false);
     }
   if(result.status == DOUBLE_BOTTOM_FAILED &&
      (result.failure_index < 0 || result.failure_index >= sample.bars))
     {
      error = "The validation result contains an invalid failure index.";
      return(false);
     }
//--- Verify the result refers to the same ordered candle structure
   int first = result.first_low_index;
   int second = result.second_low_index;
   int neck = result.neckline_index;
   if(result.status < DOUBLE_BOTTOM_CANDIDATE || result.status > DOUBLE_BOTTOM_FAILED ||
      first >= neck || neck >= second ||
      result.first_low_price != sample.candles[first].low ||
      result.second_low_price != sample.candles[second].low ||
      result.neckline_price != sample.candles[neck].high ||
      result.separation_bars != second-first ||
      !MathIsValidNumber(result.score) || result.score < 0.0 || result.score > 100.0)
     {
      error = "The result does not match the stored candle structure.";
      return(false);
     }
   if((result.status == DOUBLE_BOTTOM_CONFIRMED &&
       (result.breakout_index <= second || result.failure_index != -1)) ||
      (result.status == DOUBLE_BOTTOM_FAILED &&
       (result.failure_index <= second || result.breakout_index != -1)) ||
      (result.status == DOUBLE_BOTTOM_CANDIDATE &&
       (result.breakout_index != -1 || result.failure_index != -1)))
     {
      error = "The decisive index is inconsistent with the result status.";
      return(false);
     }
   error = "";
   return(true);
  }
These checks are defensive, but they also document the contract. A candidate needs the two lows and neckline. A confirmed result additionally needs a breakout candle. A failed result needs a failure candle. The renderer never guesses a missing coordinate.
4. Checking context and navigating to history
The chart check converts the stored timeframe to concise panel text when it reports a mismatch. Navigation begins only after the context matches.
//+------------------------------------------------------------------+
//| Checks that the open chart matches the recorded sample           |
//+------------------------------------------------------------------+
bool CDoubleBottomRenderer::CheckChartContext(const SPatternSample &sample,
                                              string &error)
  {
   string chart_symbol = ChartSymbol(m_chart_id);
   ENUM_TIMEFRAMES chart_timeframe = ChartPeriod(m_chart_id);
   if(chart_symbol != sample.symbol || chart_timeframe != sample.timeframe)
     {
      string timeframe = EnumToString(sample.timeframe);
      StringReplace(timeframe, "PERIOD_", "");
      error = "Open " + sample.symbol + " " + timeframe +
              " before showing this sample.";
      return(false);
     }
   error = "";
   return(true);
  }

//+------------------------------------------------------------------+
//| Moves the chart to the historical interval of the sample         |
//+------------------------------------------------------------------+
bool CDoubleBottomRenderer::NavigateToSample(const SPatternSample &sample,
                                             string &error)
  {
//--- Compare the whole interval before changing chart state
   MqlRates rates[];
   int copied = CopyRates(sample.symbol, sample.timeframe,
                          sample.start_time, sample.end_time, rates);
   if(copied != sample.bars ||
      !SeriesInfoInteger(sample.symbol, sample.timeframe, SERIES_SYNCHRONIZED))
     {
      error = "Load the complete sample history and retry.";
      return(false);
     }
   for(int i = 0; i < copied; i++)
     {
      SCandleData candle = sample.candles[i];
      double tolerance = 1e-12 * MathMax(1.0, MathAbs(candle.close));
      if(rates[i].time != candle.time ||
         MathAbs(rates[i].open-candle.open) > tolerance ||
         MathAbs(rates[i].high-candle.high) > tolerance ||
         MathAbs(rates[i].low-candle.low) > tolerance ||
         MathAbs(rates[i].close-candle.close) > tolerance)
        {
         error = "Chart history differs from the stored sample.";
         return(false);
        }
     }
   int end_shift = iBarShift(sample.symbol, sample.timeframe, sample.end_time, true);
   if(end_shift < 0)
     {
      error = "The final sample candle is absent from chart history.";
      return(false);
     }
//--- Save and verify the scrolling setting before navigation
   long previous = 0;
   if(!ChartGetInteger(m_chart_id, CHART_AUTOSCROLL, 0, previous))
     {
      error = "The chart scrolling setting could not be read.";
      return(false);
     }
   m_previous_autoscroll = (bool)previous;
   m_restore_autoscroll = true;
   bool paused = ChartSetInteger(m_chart_id, CHART_AUTOSCROLL, false);
   long actual = 1;
   paused = paused && ChartGetInteger(m_chart_id, CHART_AUTOSCROLL, 0, actual)
            && actual == 0;
   if(!paused || !ChartNavigate(m_chart_id, CHART_END, -end_shift))
     {
      error = "The chart could not pause scrolling or navigate.";
      if(!Clear())
         error += " Cleanup also failed; retry CLEAR MARKERS.";
      return(false);
     }
   error = "";
   return(true);
  }
The last candle provides a navigation reference, not a guarantee that the whole interval fits on screen. Visible coverage depends on zoom, chart width and sample length. The reviewer may need to zoom out or scroll. If navigation fails after auto-scroll has been paused, cleanup attempts to restore the saved setting and reports any restoration failure.
5. Creating reusable graphical primitives
Every review object is non-selectable and hidden from the ordinary object list. The annotations explain the program's result; they are not manual drawing tools. Central styling prevents one helper from accidentally leaving an object draggable while another locks it.
//+------------------------------------------------------------------+
//| Draws the recorded sample boundary                               |
//+------------------------------------------------------------------+
bool CDoubleBottomRenderer::CreateRectangle(const SPatternSample &sample)
  {
   string name = m_prefix + "sample_range";
   datetime display_end = sample.end_time +
                          PeriodSeconds(sample.timeframe);
   if(!ObjectCreate(m_chart_id, name, OBJ_RECTANGLE, m_subwin,
                    sample.start_time, sample.price_high,
                    display_end, sample.price_low))
      return(false);

   if(!StyleObject(name, clrSlateGray, 1, STYLE_DASH, true))
      return(false);
   if(!SetInteger(name, OBJPROP_FILL, false))
      return(false);
   if(!SetString(name, OBJPROP_TOOLTIP,
                   "Recorded sample #" + IntegerToString(sample.id)))
      return(false);
   return(true);
  }

//+------------------------------------------------------------------+
//| Draws the horizontal neckline retained by the validator          |
//+------------------------------------------------------------------+
bool CDoubleBottomRenderer::CreateNeckline(
                                      const SPatternSample &sample,
                                      const SDoubleBottomValidation &result)
  {
   string name = m_prefix + "neckline";
   datetime start_time = sample.candles[result.first_low_index].time;
   datetime display_end = sample.end_time +
                          PeriodSeconds(sample.timeframe);
   if(!ObjectCreate(m_chart_id, name, OBJ_TREND, m_subwin,
                    start_time, result.neckline_price,
                    display_end, result.neckline_price))
      return(false);

   if(!StyleObject(name, clrOrange, 2, STYLE_SOLID, false))
      return(false);
   if(!SetInteger(name, OBJPROP_RAY_LEFT, false))
      return(false);
   if(!SetInteger(name, OBJPROP_RAY_RIGHT, false))
      return(false);
   if(!SetString(name, OBJPROP_TOOLTIP,
                   "Neckline at " + DoubleToString(result.neckline_price,
                                                    _Digits)))
      return(false);
   return(true);
  }
CreateArrow() and CreateText() provide the remaining primitives. Their suffixes are combined with the common prefix, so objects remain easy to identify during debugging while cleanup still treats them as one set.
//+------------------------------------------------------------------+
//| Creates one structural arrow marker                              |
//+------------------------------------------------------------------+
bool CDoubleBottomRenderer::CreateArrow(const string suffix,
                                        const ENUM_OBJECT arrow_type,
                                        const datetime time,
                                        const double price,
                                        const color arrow_color,
                                        const string tooltip)
  {
   string name = m_prefix + suffix;
   if(!ObjectCreate(m_chart_id, name, arrow_type, m_subwin, time, price))
      return(false);

   if(!StyleObject(name, arrow_color, 2, STYLE_SOLID, false))
      return(false);
   if(!SetString(name, OBJPROP_TOOLTIP, tooltip))
      return(false);
   return(true);
  }

//+------------------------------------------------------------------+
//| Creates one explanatory label beside a structural marker         |
//+------------------------------------------------------------------+
bool CDoubleBottomRenderer::CreateText(const string suffix,
                                       const datetime time,
                                       const double price,
                                       const string text,
                                       const color text_color,
                                       const ENUM_ANCHOR_POINT anchor,
                                       const string tooltip)
  {
   string name = m_prefix + suffix;
   if(!ObjectCreate(m_chart_id, name, OBJ_TEXT, m_subwin, time, price))
      return(false);

   if(!StyleObject(name, text_color, 1, STYLE_SOLID, false))
      return(false);
   if(!SetString(name, OBJPROP_TEXT, text))
      return(false);
   if(!SetString(name, OBJPROP_FONT, "Arial"))
      return(false);
   if(!SetInteger(name, OBJPROP_FONTSIZE, 9))
      return(false);
   if(!SetInteger(name, OBJPROP_ANCHOR, anchor))
      return(false);
   if(!SetString(name, OBJPROP_TOOLTIP, tooltip))
      return(false);
   return(true);
  }
6. Composing one chart explanation
Draw() begins by clearing any earlier review and validating its inputs. It calculates label padding, translates structural indices into candle coordinates and builds the common objects. Candidate, confirmed and failed results share the two lows and neckline; only decisive states add an outcome marker.
//+------------------------------------------------------------------+
//| Draws all annotations for one accepted validation result         |
//+------------------------------------------------------------------+
bool CDoubleBottomRenderer::Draw(const SPatternSample &sample,
                                 const SDoubleBottomValidation &result,
                                 string &error)
  {
   if(m_prefix == "" || StringLen(m_prefix) > 40 || m_subwin != 0)
     {
      error = "Use a nonempty review prefix and the main chart window.";
      return(false);
     }
   if(!Clear())
     {
      error = "Previous review cleanup failed; retry CLEAR MARKERS.";
      return(false);
     }
   if(!CheckResultIndices(sample, result, error))
      return(false);
   if(!CheckChartContext(sample, error))
      return(false);
   if(!NavigateToSample(sample, error))
      return(false);

   double price_span = sample.price_high - sample.price_low;
   double padding = price_span * 0.035;
   if(padding <= 0.0)
      padding = SymbolInfoDouble(sample.symbol, SYMBOL_POINT) * 20.0;

   int low1 = result.first_low_index;
   int low2 = result.second_low_index;
   int neckline = result.neckline_index;
   color status_color = StatusColor(result.status);
   string status = DoubleBottomStatusToString(result.status);

//--- Draw the sample boundary, two lows and the measured neckline
   bool created = CreateRectangle(sample);
   created = created && CreateArrow("low1_arrow", OBJ_ARROW_UP,
                                   sample.candles[low1].time,
                                   sample.candles[low1].low,
                                   clrDodgerBlue,
                                   "First low, candle #" +
                                   IntegerToString(low1));
   created = created && CreateText("low1_text",
                                  sample.candles[low1].time,
                                  sample.candles[low1].low - padding,
                                  "L1", clrDodgerBlue, ANCHOR_UPPER,
                                  "First qualifying swing low");
   created = created && CreateArrow("low2_arrow", OBJ_ARROW_UP,
                                   sample.candles[low2].time,
                                   sample.candles[low2].low,
                                   clrDodgerBlue,
                                   "Second low, candle #" +
                                   IntegerToString(low2));
   created = created && CreateText("low2_text",
                                  sample.candles[low2].time,
                                  sample.candles[low2].low - padding,
                                  "L2", clrDodgerBlue, ANCHOR_UPPER,
                                  "Second qualifying swing low");
   created = created && CreateNeckline(sample, result);
   created = created && CreateText("neckline_text",
                                  sample.candles[neckline].time,
                                  result.neckline_price + padding,
                                  "NECKLINE", clrOrange, ANCHOR_LOWER,
                                  "Highest high between L1 and L2");

//--- Mark the first decisive close when the sample has one
   if(result.status == DOUBLE_BOTTOM_CONFIRMED)
     {
      int breakout = result.breakout_index;
      created = created && CreateArrow("breakout_arrow", OBJ_ARROW_UP,
                                      sample.candles[breakout].time,
                                      sample.candles[breakout].close,
                                      clrLimeGreen,
                                      "Breakout close, candle #" +
                                      IntegerToString(breakout));
      created = created && CreateText("breakout_text",
                                     sample.candles[breakout].time,
                                     sample.candles[breakout].high + padding,
                                     "BREAKOUT", clrLimeGreen, ANCHOR_LOWER,
                                     "First close above the configured breakout level");
     }
   else
      if(result.status == DOUBLE_BOTTOM_FAILED)
        {
         int failure = result.failure_index;
         created = created && CreateArrow("failure_arrow", OBJ_ARROW_DOWN,
                                         sample.candles[failure].time,
                                         sample.candles[failure].close,
                                         clrRed,
                                         "Failure close, candle #" +
                                         IntegerToString(failure));
         created = created && CreateText("failure_text",
                                        sample.candles[failure].time,
                                        sample.candles[failure].low - padding,
                                        "FAILURE", clrRed, ANCHOR_UPPER,
                                        "First close below the failure level");
        }

//--- Summarize the classification and structure score above the range
   string summary = status + " | Structure " +
                    DoubleToString(result.score, 1);
   created = created && CreateText("status_text", sample.start_time,
                                  sample.price_high + padding,
                                  summary, status_color, ANCHOR_LEFT_LOWER,
                                  result.reason);
   if(!created)
     {
      bool cleared = Clear();
      error = "An annotation could not be created or styled.";
      if(!cleared)
         error += " Cleanup failed; retry CLEAR MARKERS.";
      return(false);
     }

   ChartRedraw(m_chart_id);
   error = "";
   return(true);
  }
Short-circuit evaluation stops later creation after a helper fails. The final error branch attempts to remove earlier objects. A failed cleanup is reported rather than treated as success. Object property readbacks confirm the requested styling, but they do not guarantee that labels are unobscured at every chart scale.
7. Retaining validation state in the panel
Visual review needs the sample and validation result after the button event has finished. The panel stores both structures, together with a renderer and a flag indicating whether validation has been performed.
   SDoubleBottomSettings m_validation_settings;
   CDoubleBottomRenderer m_renderer;
   bool               m_has_validation;
   SPatternSample     m_last_validated_sample;
   SDoubleBottomValidation m_last_validation_result;
The existing validation handler still works on a copy from the library. After validation, it copies the sample and result into panel state. Before validation, the panel requests removal of the previous drawing. Validation continues if cleanup fails, so any remaining annotations must be interpreted alongside the cleanup diagnostic in the log.
//--- Apply the configured structural rules and display every outcome
   m_renderer.Clear();
   SDoubleBottomValidation result;
   bool structurally_valid = ValidateDoubleBottom(sample,
                                                    m_validation_settings,
                                                    result);
   m_last_validated_sample = sample;
   m_last_validation_result = result;
   m_has_validation = true;
   ShowValidationResult(m_selected_sample_id, result);
Retaining an invalid result is intentional. Its reason remains useful in the panel, even though the renderer will not produce a structure. m_has_validation means that validation was performed; the status determines whether there is an accepted result to draw.
8. Adding review controls
The panel height is increased to make room for two buttons between the validation details and sample list. Both controls use the same dimensions as the existing paired rows, preserving the interface rhythm.//--- Create controls that show or remove the retained validation drawing CreateObject(m_btn_show_name, OBJ_BUTTON, x+10, y+ 530 , bw, 28, "SHOW ON CHART"); ObjectSetInteger(m_chart_id, m_btn_show_name, OBJPROP_COLOR, clrBlack); ObjectSetInteger(m_chart_id, m_btn_show_name, OBJPROP_BORDER_COLOR, clrBlack); ObjectSetInteger(m_chart_id, m_btn_show_name, OBJPROP_FONTSIZE, 10); CreateObject(m_btn_clear_markers_name, OBJ_BUTTON, x+20+bw, y+ 530 , bw, 28, "CLEAR MARKERS"); ObjectSetInteger(m_chart_id, m_btn_clear_markers_name, OBJPROP_COLOR, clrBlack); ObjectSetInteger(m_chart_id, m_btn_clear_markers_name, OBJPROP_BORDER_COLOR, clrBlack); ObjectSetInteger(m_chart_id, m_btn_clear_markers_name, OBJPROP_FONTSIZE, 10);
Recent-sample rows now include symbol and timeframe alongside ID, candle count and date. That context helps the user choose the correct chart before requesting a review, especially when one library contains samples from several instruments.
9. Showing, clearing and resetting a review
OnShowOnChart() separates three outcomes. No retained validation produces an instruction. An invalid result produces a refusal. An accepted result is passed to the renderer, whose detailed error is returned through the panel status line.
//+------------------------------------------------------------------+
//| Shows the retained validation structure on the source chart      |
//+------------------------------------------------------------------+
void CRecorderPanel::OnShowOnChart()
  {
   if(!m_has_validation)
     {
      ShowStatus("Validate a selected sample before showing it.", true);
      return;
     }
   if(m_last_validation_result.status == DOUBLE_BOTTOM_INVALID)
     {
      m_renderer.Clear();
      ShowStatus("Invalid samples have no structure to draw.", true);
      return;
     }

   string error;
   if(!m_renderer.Draw(m_last_validated_sample,
                       m_last_validation_result, error))
     {
      ShowStatus("Chart review: " + error, true);
      return;
     }
   ShowStatus("Sample #" + IntegerToString(m_last_validated_sample.id) +
              " displayed on the chart.", false);
  }

//+------------------------------------------------------------------+
//| Removes the current validation annotations from the chart        |
//+------------------------------------------------------------------+
void CRecorderPanel::OnClearMarkers()
  {
   if(m_renderer.Clear())
      ShowStatus("Validation markers cleared.", false);
   else
      ShowStatus("Review cleanup failed. Retry CLEAR MARKERS.", true);
  }
Clearing markers does not invalidate the retained result. Resetting does. The separate reset helper is used when the selected research subject changes.
//+------------------------------------------------------------------+
//| Clears retained validation data and its chart annotations        |
//+------------------------------------------------------------------+
void CRecorderPanel::ResetValidationState()
  {
   m_has_validation = false;
   ClearValidationInfo();
   m_renderer.Clear();
  }
This difference supports a natural interaction. A trader may clear the drawing to inspect the unmarked candles and then show it again for comparison. Selecting another sample begins a new review and must not reuse the old result.
Installing and operating the visual reviewer
Copy DoubleBottomRecorderEA.mq5 to MQL5\Experts\PatternRecorder. Copy the seven headers to MQL5\Include\PatternRecorder. Preserve the supplied structure and compile the EA in MetaEditor. The package uses the candidate CSV format and strict loader defined in Parts 83 and 84. Compatibility depends on the schema, timestamps and validation rules, not merely similar column names. Samples in MQL5\Files\PatternLibrary\DOUBLE_BOTTOM_CANDIDATE that pass those checks can be loaded. Other formats are not automatically converted.
Attach the EA to a chart matching the samples to inspect. Press VIEW SAMPLES, select a row and choose VALIDATE SELECTED. Read the panel result, then press SHOW ON CHART to move to the stored interval and display its interpretation.
Review the rectangle first, because it defines the evidence available to the validator. Compare L1 and L2 with the turns you intended to record. Check whether the orange neckline belongs to the intervening recovery and whether the decisive marker sits on the first qualifying close. The status and score above the range should agree with the panel.
CLEAR MARKERS removes review annotations and restores the saved auto-scroll value, subject to successful cleanup. Other chart drawings remain. The retained result can be shown again; selecting another row clears it. Symbol, timeframe or historical candle mismatches stop drawing and produce an error message. Load the required history or open the matching chart, then revalidate if the EA has reinitialized.
Testing
Displaying a confirmed sample
The test used a Deriv USDCAD M30 chart with ten stored samples. Before reviewing a sample, I enabled Auto Scroll and drew a green trendline to check whether cleanup would preserve an unrelated chart object.
I selected sample #11 and pressed VALIDATE SELECTED. The sample contained 41 candles, covering 8 September 2026 at 22:00 through 9 September 2026 at 18:00. Validation returned CONFIRMED at candle 31, with a structural score of 87.4.
The panel displayed the following measurements:
| Measurement | Result |
|---|---|
| First low | Candle 18 |
| Second low | Candle 28 |
| Low separation | 10 bars |
| Neckline | Candle 24 at 1.37868 |
| Depth | 0.149% |
| Low difference | 2.4% |
| Symmetry | 66.7% |
| Recovery | 100.0% |
Pressing SHOW ON CHART moved the chart to the recorded period and displayed the sample boundary, low markers, neckline, breakout marker and classification summary. Auto Scroll was disabled during the review. The chart position was adjusted to inspect the annotations; label visibility depended on the available chart space and position.
Comparing the markers with the stored data
Inspection of SAMPLE_11.csv provided the following reference coordinates. Candle indices start at zero, and times follow the stored chart timestamps.
| Feature | Candle index | Stored candle time | Reference price |
|---|---|---|---|
| First low (L1) | 18 | 2026.09.09 07:00 | Low: 1.37665 |
| Neckline reference candle | 24 | 2026.09.09 10:00 | High: 1.37868 |
| Second low (L2) | 28 | 2026.09.09 12:00 | Low: 1.37660 |
| Breakout | 31 | 2026.09.09 13:30 | Close: 1.37893 |
The visible markers are consistent with these references, and the panel reports the corresponding indices and neckline price. This comparison supports visual agreement with the CSV. Exact chart-object anchor values were not inspected.
Clearing and displaying the result again
Pressing CLEAR MARKERS removed the review annotations and returned the chart to its latest bars. The Auto Scroll toolbar button returned to its enabled state. The manually drawn green trendline remained, showing that cleanup preserved this unrelated object.
The panel retained sample #11’s numerical result. Pressing SHOW ON CHART again, without revalidation, returned to the recorded period and recreated the annotations. This demonstrated that clearing the drawing did not discard the retained result.
Refusing an invalid result
I then selected sample #8 and pressed VALIDATE SELECTED. The panel returned INVALID, explaining that swing lows were found but no pair passed all mandatory rules.
Pressing SHOW ON CHART displayed "Invalid samples have no structure to draw." No new validation annotations appeared, and the manual trendline remained. The rejection message describes the overall outcome; it does not identify the failed thresholds for each possible pair.
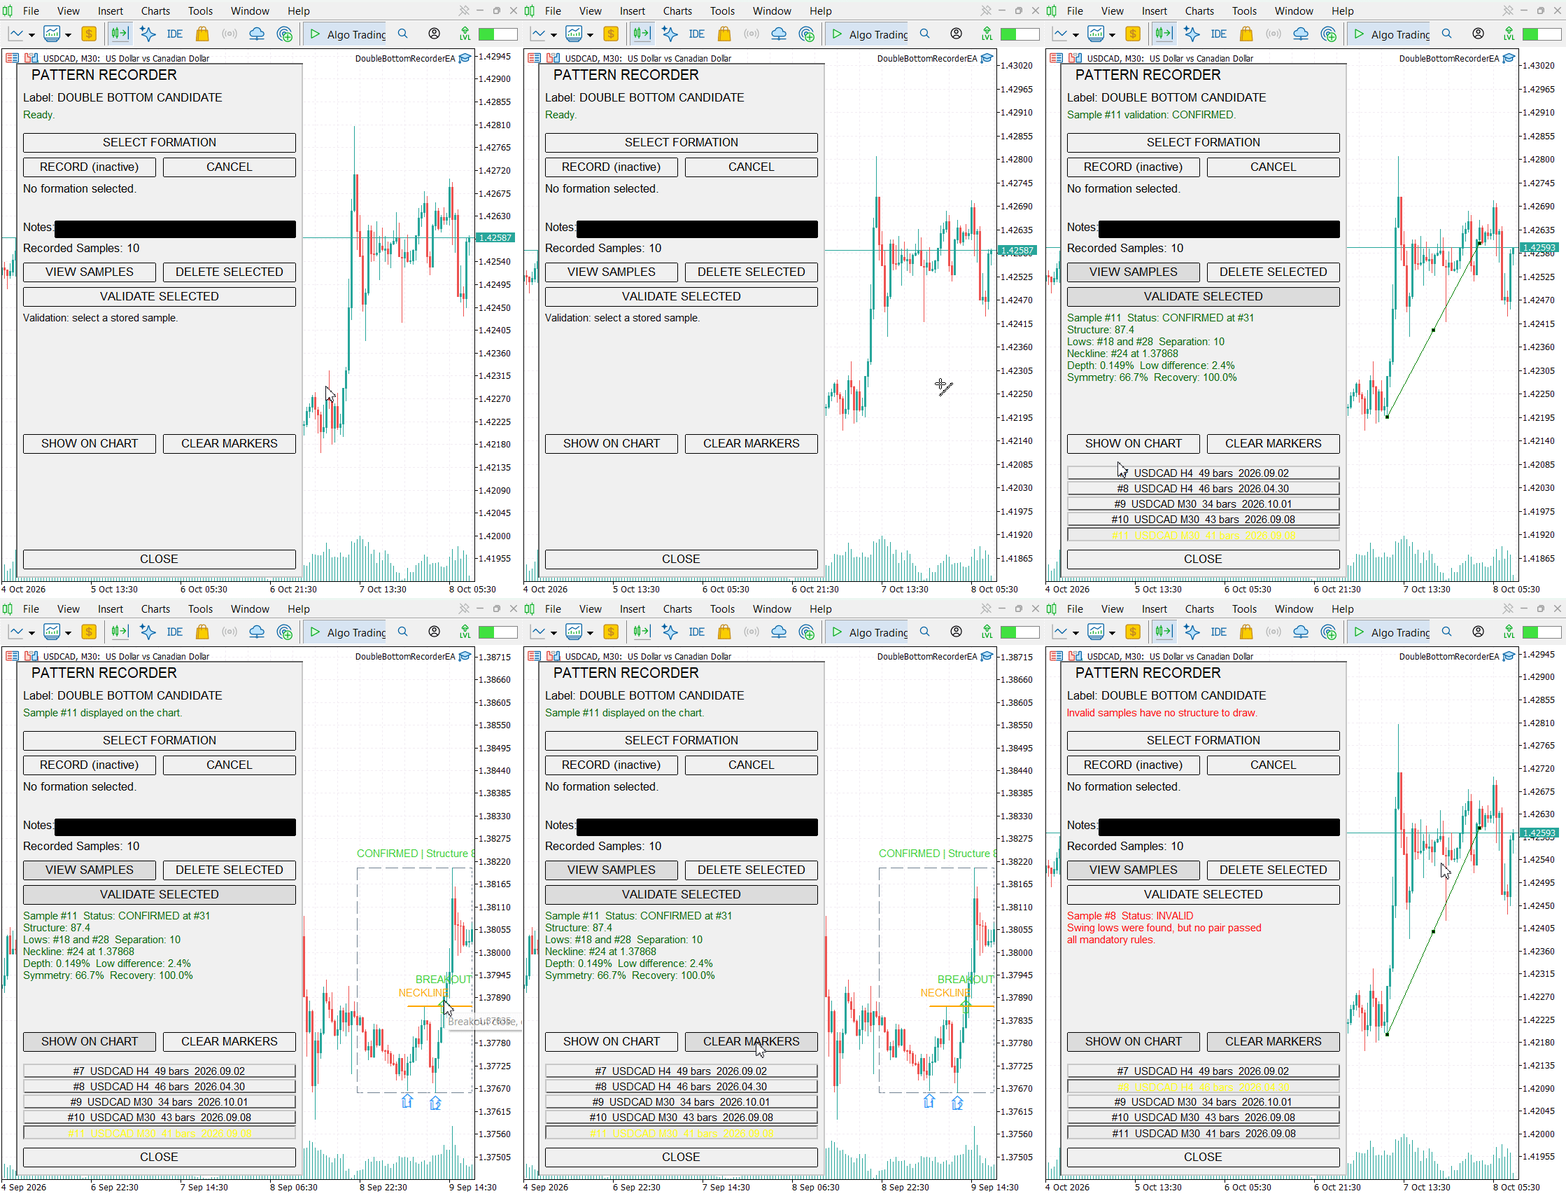
Figure 2. Reviewing confirmed sample #11, clearing and replaying its annotations, and refusing to draw invalid sample #8 on USDCAD M30.
Scope of the results
The recording demonstrates navigation, confirmed-result display, cleanup, restoration of initially enabled Auto Scroll, preservation of one unrelated trendline, replay without revalidation and refusal to draw an invalid result. The CSV comparison adds reference coordinates for the visible structure. These observations support the demonstrated workflow; they do not establish the correctness of the market interpretation.
The recording does not show exact object-anchor inspection, refusal to draw a newly selected sample before validation, CANDIDATE or FAILED rendering, symbol or timeframe mismatches, missing or mismatched history, or object-creation and styling failures. Auto Scroll was initially enabled; restoration from an initially disabled state was not demonstrated. The results are limited to the USDCAD M30 chart used in this test.
Reviewing the validator’s decisions
Once a sample appears on the chart, the first question is straightforward: did the program mark the formation you had in mind? Check L1, L2 and the neckline before considering the score. If those points match your reading, the measurements describe the intended structure. If they do not, the chart shows exactly where the two interpretations separated.
This makes older samples easier to examine. The panel handles navigation, so there is no need to search manually for the recording date. One useful approach is to study the candles before showing the annotations, decide where the two lows and neckline should be, and then press SHOW ON CHART. A disagreement does not automatically mean that the code is wrong. The recorded interval may contain another qualifying low, the scoring rules may prefer a different pair, or the original label may need to be reconsidered.
For developers, misplaced annotations provide direct clues. A marker appearing one candle early may indicate an indexing problem. A neckline drawn at the wrong price points toward result mapping or chart coordinates. Agreement between annotations and panel values supports correct coordinate mapping. It does not by itself verify cleanup, history handling, styling or scrolling restoration. If the marked pair is valid according to the result but looks unsuitable on the chart, the validator settings or scoring logic should be examined instead.
Failed and invalid samples remain useful during this review. INVALID can mean that no pair passed the rules or that the input could not be evaluated. The diagnostic must be checked before attributing rejection to the manual label. FAILED means that the selected accepted pair crossed its failure level before its breakout level within the recorded interval. Keeping these examples alongside confirmed formations produces a more honest reference collection and gives later changes something meaningful to test against.
Conclusion
Part 85 closes the distance between a structural result and the chart from which it came. The validator's candle indices are translated into time and price, the chart is moved to the correct historical interval, and a consistent visual grammar identifies the two lows, neckline, outcome, sample boundary and score. Invalid samples remain explanations rather than drawings.
The implementation adds a dedicated renderer instead of placing graphical logic inside the validator or Expert Advisor. It checks the result’s coordinate consistency and chart context, manages review objects under a reserved prefix, handles partial failures and pauses auto-scroll during review. Cleanup attempts to restore the saved auto-scroll setting and reports any failure. The panel retains one sample-result pair and gives the user explicit controls to show, hide and replace its review.
For traders, this provides a faster way to examine stored formations and compare personal judgment with repeatable rules. For developers, the annotated chart provides a visible test surface for the exact indices and states returned by the algorithm. Both work from the same preserved evidence, so neither conclusion is hidden inside a black box.
The toolkit has therefore moved beyond recording and numerical classification. A saved hypothesis can be located, measured, displayed, challenged and revisited. This supports inspection of stored results and planning further tests. It does not establish the accuracy of the pattern labels or the robustness of the library across market conditions.
Attachments
| File | Type | Responsibility |
|---|---|---|
| DoubleBottomRecorderEA.mq5 | Expert Advisor | Initializes the library and panel, supplies validation settings and forwards chart events |
| DoubleBottomRenderer.mqh | Include | Navigates to stored samples and draws or clears their validation annotations |
| DoubleBottomValidator.mqh | Include | Detects, measures, scores and classifies double-bottom structures |
| PatternRecorderPanel.mqh | Include | Coordinates recording, sample selection, validation and visual review |
| PatternData.mqh | Include | Defines candle and pattern-sample structures |
| PatternExtractor.mqh | Include | Converts a chart rectangle into normalized candle data |
| PatternLibrary.mqh | Include | Owns the in-memory sample collection |
| PatternStorage.mqh | Include | Persists, discovers, loads and deletes CSV samples |
| MQL5.zip | Archive | Contains the complete eight-file project in its MQL5 directory structure |
Warning: All rights to these materials are reserved by MetaQuotes Ltd. Copying or reprinting of these materials in whole or in part is prohibited.
This article was written by a user of the site and reflects their personal views. MetaQuotes Ltd is not responsible for the accuracy of the information presented, nor for any consequences resulting from the use of the solutions, strategies or recommendations described.

 Evolutionary Selection of LLM Agents in MetaTrader 5
 Institutional-Grade Multi-Currency Portfolio Engine in MQL5 (Part 2): Instrument Universe Management and Symbol Metadata
 Surrogate Data Testing: A Null Model for Any Statistic, and Why Shuffling Bars Is Not One
 Does Your EA Depend on Candle Boundaries? A Shifted-Bar Stress Test in MQL5

- Free trading apps
- Over 8,000 signals for copying
- Economic news for exploring financial markets
You agree to website policy and terms of use