

Building a Crosshair Volume Profile Indicator in MQL5
 1 404
1 404
 0
0

Introduction
Volume Profile is one of the most powerful tools in technical analysis, revealing where the market has traded most actively and helping traders identify potential reversal zones. However, most volume-based indicators associate each candle's entire volume with a single price—typically the closing price. While simple and efficient, this assumption may not always reflect where the majority of trading activity actually occurred.
In this article, we will build a Crosshair Volume Profile indicator in MQL5. It turns MetaTrader 5's right-click-and-drag interaction into an interactive volume analysis tool. After you select a chart region, the indicator determines the analysis boundaries and constructs adaptive price bins. It then accumulates tick or real volume, identifies the Point of Control (POC), and renders a color‑scaled Volume Profile on the chart. To provide a broader perspective of market participation, the implementation also supports multiple price allocation models, including Close, Median, Typical, Weighted Close, and OHLC4, rather than relying solely on the closing price. By the end of this article, you will learn how to:- Capture user-defined price ranges interactively using chart events.
- Implement a custom crosshair interface in MQL5.
- Dynamically determine analysis boundaries.
- Support multiple price models beyond the traditional closing price.
More importantly, this article encourages a different way of thinking about volume analysis. Rather than accepting a single-price representation for every candle, we'll explore how alternative price models and interactive analysis can uncover market insights that conventional approaches may overlook.
Project Overview
Unlike conventional Volume Profile tools that rely on predefined or fixed analysis windows, this implementation enables users to generate an on-demand Volume Profile for any region of the chart. The Crosshair Volume Profile Indicator is an event-driven MQL5 indicator that combines the familiarity of MetaTrader 5's Crosshair tool with the analytical power of a Volume Profile. When activated via the menu button, the indicator enables mouse-move events and disables the default context menu. This reserves right-click-and-drag interactions for range selection. When the indicator is switched OFF, these chart settings are automatically restored, preventing interference with MetaTrader 5's native controls and preserving the user's normal workflow. The selected range is then used to compute and render a color-scaled Volume Profile together with its Point of Control (POC). The indicator also supports multiple volume allocation models—including Close, Median, Typical, Weighted Close, and OHLC4—providing a more flexible framework for analyzing how volume is distributed across price levels.
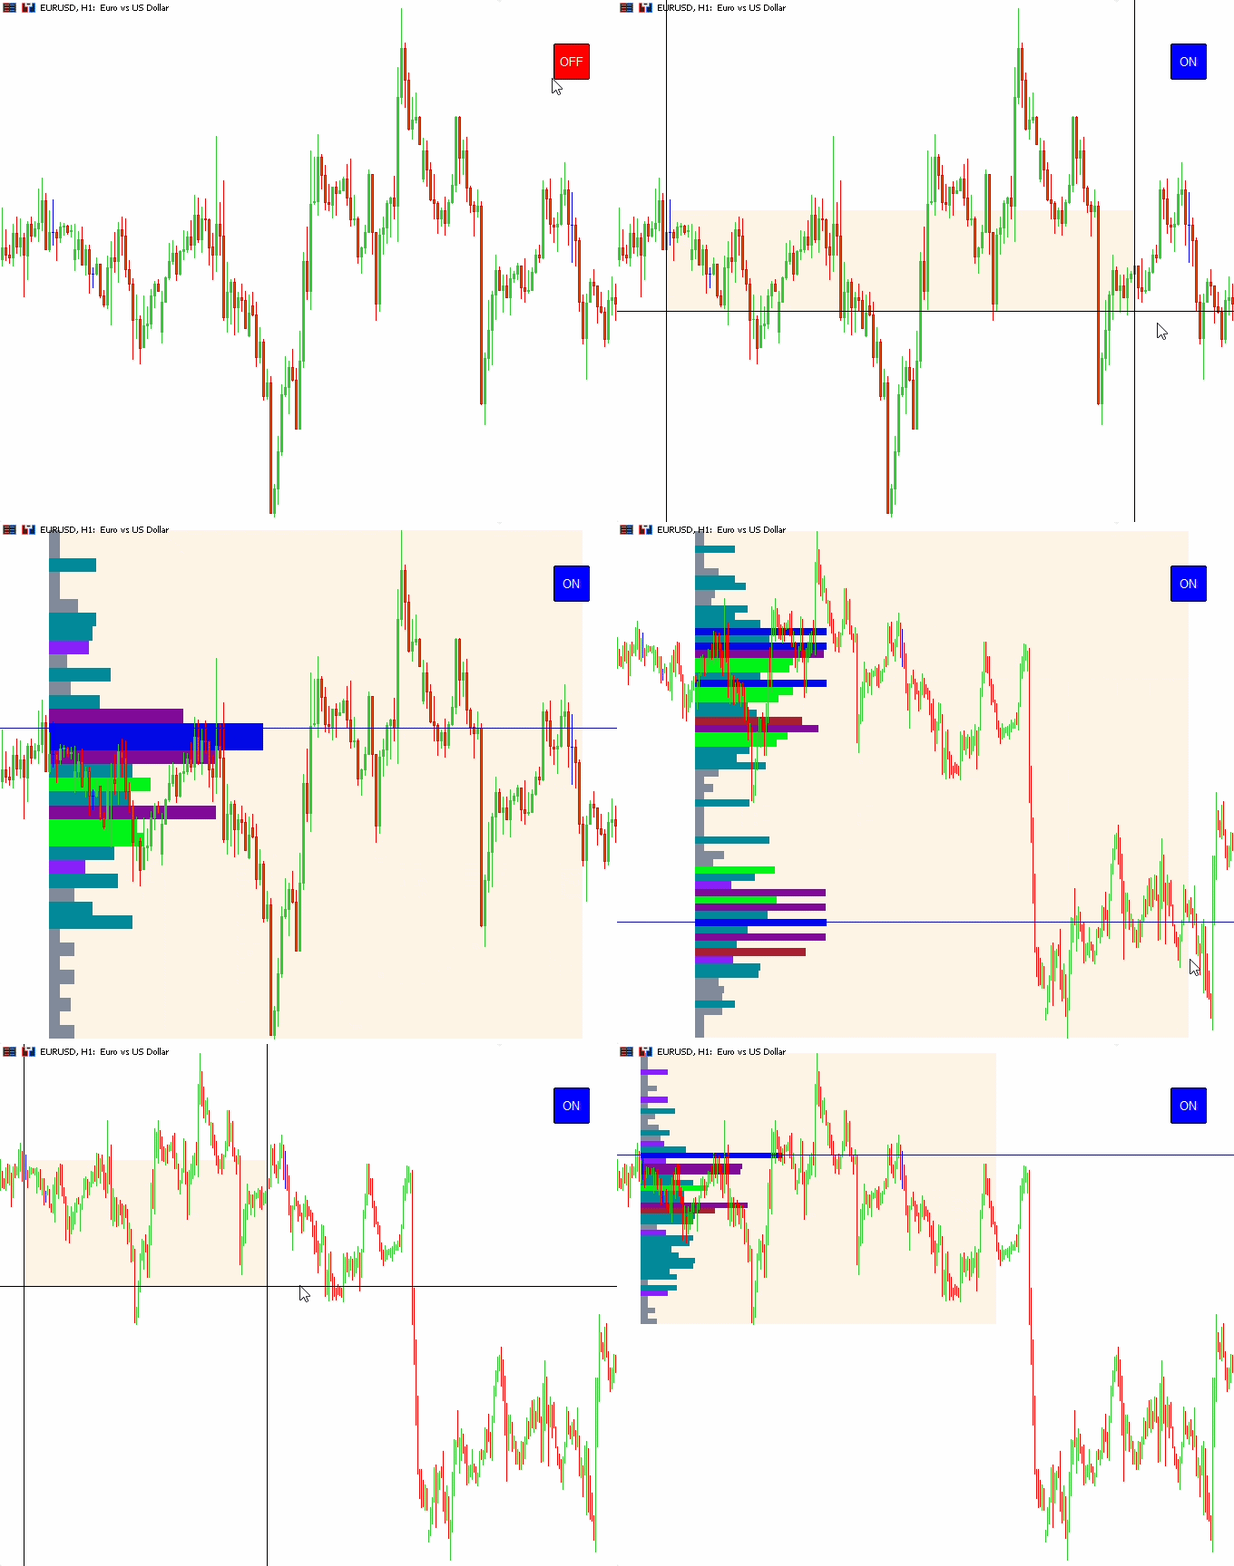
The indicator also supports quick profile deletion. Press "C" twice to clear the current Volume Profile, reducing chart clutter and keeping the price chart unobstructed. Below is a visual model of the indicator described in this project:
Design Workflow
This section presents the end-to-end workflow of the Crosshair Volume Profile Indicator. We break the implementation into its core stages: initialization, event-driven interaction, analysis range selection, adaptive bin construction, volume accumulation, and efficient rendering of the resulting Volume Profile on the chart.
Initialization
The initialization stage prepares the indicator for interactive volume analysis. When the indicator is attached to the chart, it creates an ON/OFF menu button that serves as the primary control for enabling or disabling the analysis mode. This prevents the indicator from continuously monitoring mouse events when they are not required, reducing unnecessary event processing and allowing traders to interact with the chart normally.
Event-Driven Interaction
The OnChartEvent() function coordinates the indicator's interactive behavior. It responds to menu button clicks and toggles, captures mouse right-click-and-drag operations to define the analysis range, and detects a double-press of the "C" key to clear the current Volume Profile. This event-driven design ensures that user actions are processed only when they occur, improving both responsiveness and computational efficiency.
Analysis Range Selection
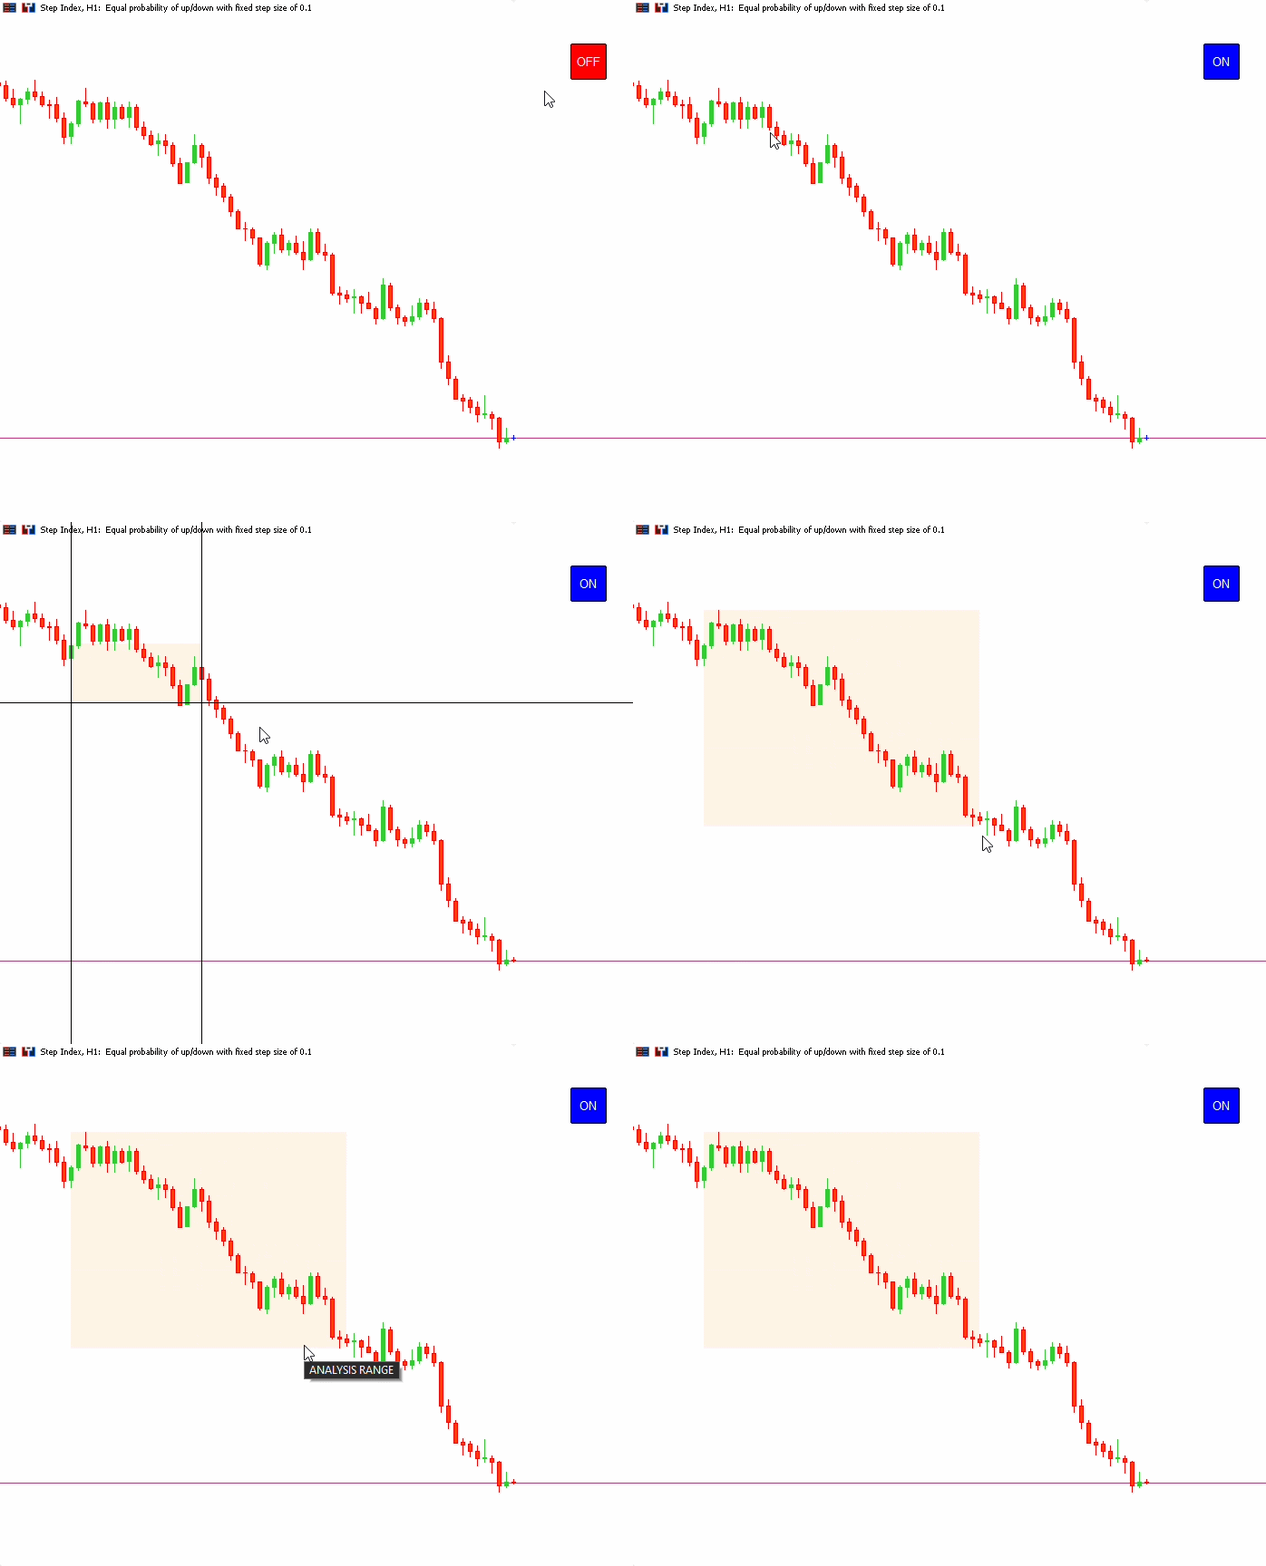
The analysis range is defined interactively using a custom crosshair interface. When the menu button is switched ON, the indicator begins monitoring mouse right-click events. The first right-click marks the start of the analysis range and creates the crosshair tool, consisting of two vertical lines and one horizontal line. As long as the right mouse button remains pressed, mouse movement continuously updates the position of the second vertical line, providing real-time visual feedback of the prospective analysis range. This allows traders to adjust the selection dynamically before confirming it. When the right mouse button is released, the current cursor position becomes the end of the analysis range.
Adaptive Bin Construction
Once the analysis range has been finalized, the indicator constructs a set of adaptive price bins that form the foundation of the Volume Profile. It first determines the highesthigh and lowestlow within the selected range, establishing the vertical price boundaries for the analysis.
Rather than using a fixed number of bins, the indicator derives the bin count dynamically from the selected range by dividing the total number of candles by four. The resulting number of bins is then used to partition the entire price range into equally sized price intervals, with each interval representing a single price bin for subsequent volume accumulation.
Volume Accumulation
With the analysis range and adaptive bin structure in place, the indicator begins accumulating volume into the corresponding price bins. For each candle within the selected range, the indicator computes a representative source price using the selected model: Close, Median (H + L) / 2, Typical (H + L + C) / 3, Weighted Close (H + L + 2C) / 4, or OHLC4 (O + H + L + C) / 4. The indicator then determines which price bin contains the computed source price and adds the candle's tick volume or real volume to that bin. This process is repeated for every candle within the analysis range, progressively building a distribution of trading activity across all price levels.
Volume Profile Rendering
Finally, the accumulated volume data is transformed into a horizontal Volume Profile and rendered directly on the chart. Each price bin is represented by a horizontal profile bar of uniform height, while its horizontal length is scaled proportionally to the volume accumulated within that price interval. Consequently, longer bars indicate higher trading activity, whereas shorter bars represent relatively lower market participation.
To improve visual interpretation, the profile bars are rendered using a color scale based on their relative volume, making high-volume price levels immediately distinguishable from lower-volume regions. The price level associated with the highest accumulated volume is then identified as the Point of Control (POC) and highlighted on the chart, providing traders with an immediate reference to the area of greatest market participation within the selected analysis range.
MQL5 Implementation
Having established the design workflow and the responsibilities of each stage, we can now translate the concepts into a fully functional MQL5 indicator. In this chapter, we will implement each component of the workflow—from initialization and event-driven interaction to analysis range selection, adaptive bin construction, volume accumulation, and Volume Profile rendering.
Preprocessor Directives
We begin by establishing the compiler directives, which define the indicator's metadata, specify that it is rendered in the main chart window without indicator plots, and declare symbolic constants used throughout the program for mouse event detection and the consistent naming of chart objects associated with the Crosshair Volume Profile.
//+------------------------------------------------------------------+
//|                                     Crosshair Volume Profile.mq5 |
//|                                             © 2026, ChukwuBuikem |
//|                             https://www.mql5.com/en/users/bikeen |
//+------------------------------------------------------------------+
#property copyright "© 2026, ChukwuBuikem"
#property link      "https://www.mql5.com/en/users/bikeen"
#property indicator_chart_window
#property indicator_plots 0
//--- MOUSE RIGHT-CLICK MACRO
#define MOUSE_RIGHT  0x02
//--- PROFILE MACRO
#define _PROG_NAME "Crosshair Volume Profile"
#define _MENU_BUTTON _PROG_NAME + "BUTTON"
#define _V_START_LINE _PROG_NAME + "V_START_LINE"
#define _V_END_LINE _PROG_NAME + "V_END_LINE"
#define _H_LINE _PROG_NAME + "HLINE"
#define _VOLUME_RANGE _PROG_NAME + "RECTANGLE"
#define _PROFILE _PROG_NAME + "PROFILE"
#define _PROFILE_POC _PROG_NAME + "PROFILE_POC"
Custom Enumeration
To provide flexibility in volume allocation, the following custom enumeration defines the supported price models that determine the representative price to which each candle's volume is assigned during profile construction.
//--- CUSTOM ENUMERATION
enum ENUM_VOLUME_PRICE
  {
//---
   VOLUME_PRICE_CLOSE,     //PRICE CLOSE
   VOLUME_PRICE_MEDIAN,    //PRICE MEDIAN
   VOLUME_PRICE_TYPICAL,   //PRICE TYPICAL
   VOLUME_PRICE_WEIGHTED,  //PRICE WEIGHTED
   VOLUME_PRICE_OHLC4      //PRICE OHLC4
  };
Data Structure
Since both cursor interaction and Volume Profile construction rely on time and price information, the following structure provides a unified container for storing time, price, and volume values. During crosshair movement, it tracks the current cursor coordinates, while during profile construction it stores the accumulated volume associated with each price level.
//--- DATA STRUCTURE
struct st_priceVolume
  {
   //---
   datetime          time;
   double            price;
   long              volume;
   //---CONSTRUCTOR
                     st_priceVolume(): time(0), price(EMPTY_VALUE), volume(0) {}
  };
Input Parameters
The following user input determines the price model used throughout the volume accumulation process. This allows users to compare Volume Profiles generated from different price representations without modifying the program code.
//--- INPUT SETTINGS
input ENUM_VOLUME_PRICE inpPriceType = VOLUME_PRICE_CLOSE;//Price source
Global Variables
With the input setting in place, we now transition to defining the program's global variables. These variables track the menu button status and record the start and end times that define the current Volume Profile analysis range.
//--- GLOBAL VARIABLES
bool isButtonOn = false;
datetime startTime = 0;
datetime endTime = 0;
Helper Functions
This section introduces a collection of helper functions that encapsulate the indicator's core responsibilities. These utilities coordinate chart interaction, normalize chart data, manage graphical objects, compute the Volume Profile, and render the final analysis on the chart. By separating these responsibilities into dedicated functions, the implementation becomes more modular, reusable, and easier to maintain.
Price Source Computation
To enable the Volume Profile to accurately represent market activity using the selected price model—whether Close, Median, Typical, Weighted, or OHLC4—we create the following function to compute the representative price for each candle.
//+------------------------------------------------------------------+
//|                 PRICE SOURCE COMPUTATION                         |
//+------------------------------------------------------------------+
double getPrice(const MqlRates & rate)
  {
//---
   switch(inpPriceType)
     {
      case VOLUME_PRICE_MEDIAN:
         return (rate.high + rate.low) / 2;

      case VOLUME_PRICE_TYPICAL:
         return (rate.high + rate.low + rate.close) / 3;

      case VOLUME_PRICE_WEIGHTED:
         return (rate.high + rate.low + (2 * rate.close)) / 4;

      case VOLUME_PRICE_OHLC4:
         return (rate.open + rate.high + rate.low + rate.close) / 4;
     }
//--- FALLBACK TO CLOSE PRICE
   return NormalizeDouble(rate.close, _Digits);
  }
Time and Volume Normalization
Accurate visualization depends on both precise time alignment and consistent volume scaling. The first function, normalizeToChartTime(), normalizes any given time to the nearest valid time on the current chart, ensuring the vertical line is anchored to an accurate candle. The second function, normalizeMinMax(), normalizes volume values to a range between 0 and 1, allowing the Volume Profile bars to be proportionally scaled regardless of the absolute volume magnitude.
//+------------------------------------------------------------------+
//|                      TIME NORMALIZATION                          |
//+------------------------------------------------------------------+
datetime normalizeToChartTime(const datetime time)
  {
//---
   int shift = iBarShift(_Symbol, PERIOD_CURRENT, time);
   if(shift < 0)
      shift = 0;

   return iTime(_Symbol, PERIOD_CURRENT, shift);
  }
//+------------------------------------------------------------------+
//|                   VOLUME NORMALIZATION                           |
//+------------------------------------------------------------------+
double normalizeMinMax(const long value, const long maxVol, const long minVol)
  {
//---
   if(maxVol <= minVol)
      return 0;

   return (double)(value - minVol) / (maxVol - minVol);
  }
Chart Object Management
To build an interactive Crosshair Volume Profile, the indicator must dynamically create, update, and remove graphical objects in response to user interactions. The following helper functions encapsulate the creation and management of chart objects such as buttons, lines, rectangles, and cleanup routines, resulting in cleaner, reusable, and easier-to-maintain code.
//+------------------------------------------------------------------+
//|                           BUTTON CREATION                        |
//+------------------------------------------------------------------+
void createMenuButton(void)
  {
//---
   if(ObjectFind(0, _MENU_BUTTON) != -1)
      ObjectDelete(0, _MENU_BUTTON);

   ObjectCreate(0, _MENU_BUTTON, OBJ_BUTTON, 0, 0, 0);
   ObjectSetInteger(0, _MENU_BUTTON, OBJPROP_CORNER, CORNER_RIGHT_UPPER);
   ObjectSetInteger(0, _MENU_BUTTON, OBJPROP_XDISTANCE, 70);
   ObjectSetInteger(0, _MENU_BUTTON, OBJPROP_YDISTANCE, 50);
   ObjectSetInteger(0, _MENU_BUTTON, OBJPROP_XSIZE, 40);
   ObjectSetInteger(0, _MENU_BUTTON, OBJPROP_YSIZE, 40);
   ObjectSetInteger(0, _MENU_BUTTON, OBJPROP_COLOR, clrWhite);
   ObjectSetInteger(0, _MENU_BUTTON, OBJPROP_BGCOLOR, clrRed);
   ObjectSetInteger(0, _MENU_BUTTON, OBJPROP_BORDER_COLOR, clrBlack);
   ObjectSetInteger(0, _MENU_BUTTON, OBJPROP_SELECTABLE, false);
   ObjectSetInteger(0, _MENU_BUTTON, OBJPROP_STATE, false);
   ObjectSetString(0, _MENU_BUTTON, OBJPROP_TOOLTIP, "Menu Button");
   ObjectSetString(0, _MENU_BUTTON, OBJPROP_TEXT, "OFF");
   ObjectSetInteger(0, _MENU_BUTTON, OBJPROP_FONTSIZE, 10);
   ChartRedraw();
  }
//+------------------------------------------------------------------+
//|                     BUTTON TOGGLE SYSTEM                         |
//+------------------------------------------------------------------+
void toggleMenuButton(void)
  {
//---
   isButtonOn = !isButtonOn;

   if(isButtonOn)
     {
      ObjectSetInteger(0, _MENU_BUTTON, OBJPROP_BGCOLOR, clrBlue);
      ObjectSetString(0, _MENU_BUTTON, OBJPROP_TEXT, "ON");
      ObjectSetInteger(0, _MENU_BUTTON, OBJPROP_STATE, false);
      //--- CHANGE CHART SETTINGS
      ChartSetInteger(0, CHART_CONTEXT_MENU, false);
      ChartSetInteger(0, CHART_EVENT_MOUSE_MOVE, true);
     }
   else
     {
      ObjectSetInteger(0, _MENU_BUTTON, OBJPROP_BGCOLOR, clrRed);
      ObjectSetString(0, _MENU_BUTTON, OBJPROP_TEXT, "OFF");
      ObjectSetInteger(0, _MENU_BUTTON, OBJPROP_STATE, false);

      //--- RESTORE CHART SETTINGS
      ChartSetInteger(0, CHART_CONTEXT_MENU, true);
      ChartSetInteger(0, CHART_EVENT_MOUSE_MOVE, false);
     }
   ChartRedraw();
  }
//+------------------------------------------------------------------+
//|                      VERTICAL LINE CREATION                      |
//+------------------------------------------------------------------+
void createVLine(const string objName, const datetime vTime)
  {
//---
   if(ObjectCreate(0, objName, OBJ_VLINE, 0, vTime, 0))
     {
      color clr = (color)ChartGetInteger(0, CHART_COLOR_BACKGROUND);
      ObjectSetInteger(0, objName, OBJPROP_COLOR, (clr == clrBlack) ? clrWhite : clrBlack);
      ObjectSetInteger(0, objName, OBJPROP_WIDTH, 1);
      ObjectSetInteger(0, objName, OBJPROP_HIDDEN, true);
      ObjectSetInteger(0, objName, OBJPROP_SELECTABLE, false);
      ObjectSetString(0, objName, OBJPROP_TOOLTIP, "\n");
     }
  }
//+------------------------------------------------------------------+
//|                   HORIZONTAL LINE CREATION                       |
//+------------------------------------------------------------------+
void createHLine(const string objName, const double price1,
                 const color clr = clrBlack, const string toolTip = "\n")
  {
//---
   if(ObjectCreate(0, objName, OBJ_HLINE, 0, 0, price1))
     {
      ObjectSetInteger(0, objName, OBJPROP_COLOR, clr);
      ObjectSetInteger(0, objName, OBJPROP_WIDTH, 1);
      ObjectSetInteger(0, objName, OBJPROP_HIDDEN, true);
      ObjectSetInteger(0, objName, OBJPROP_SELECTABLE, false);
      ObjectSetString(0, objName, OBJPROP_TOOLTIP, toolTip);
     }
  }
//+------------------------------------------------------------------+
//|                      RECTANGLE CREATION                          |
//+------------------------------------------------------------------+
void createRect(const string objName, const datetime time1,
                const double price1, const datetime time2,
                const double price2, const color clr,
                const string tooltip = "\n")
  {
//---
   if(ObjectCreate(0, objName, OBJ_RECTANGLE, 0, time1, price1, time2, price2))
     {
      ObjectSetInteger(0, objName, OBJPROP_COLOR, clr);
      ObjectSetInteger(0, objName, OBJPROP_BACK, true);
      ObjectSetInteger(0, objName, OBJPROP_FILL, true);
      ObjectSetInteger(0, objName, OBJPROP_HIDDEN, true);
      ObjectSetInteger(0, objName, OBJPROP_SELECTABLE, false);
      ObjectSetInteger(0, objName, OBJPROP_WIDTH, 1);
      ObjectSetString(0, objName, OBJPROP_TOOLTIP, tooltip);
     }
  }
//+------------------------------------------------------------------+
//|                        OBJECT DELETION                           |
//+------------------------------------------------------------------+
void  clearChart(void)
  {
//---
   ChartSetInteger(0, CHART_EVENT_MOUSE_MOVE, false);
   ChartSetInteger(0, CHART_CONTEXT_MENU, true);
   ObjectsDeleteAll(0, _PROG_NAME);
   ChartRedraw();
  }
Explanation:
- createMenuButton()
Creates and initializes the ON/OFF control button that enables or disables the Crosshair Volume Profile functionality.
- toggleMenuButton()
Switches the indicator between its active and inactive states by updating the button's appearance and configuring the chart's interaction settings. When activated, it disables the chart context menu (CHART_CONTEXT_MENU) to prevent right-click interruptions and enables mouse movement events (CHART_EVENT_MOUSE_MOVE) so the indicator can continuously track the cursor and update the crosshair and Volume Profile in real time. When deactivated, it restores the default chart behavior by re-enabling the context menu, and disables mouse movement events to eliminate unnecessary event processing.
- createVLine()
Responsible for creating a vertical reference line at a specified time, enabling the crosshair to accurately mark the selected candle on the chart.
- createHLine()
Generates a horizontal reference line at a specified price, allowing the crosshair and POC to precisely indicate price levels.
- createRect()
Constructs a filled rectangle between two time-price coordinates, forming the graphical building blocks used to render the Volume Profile bars.
- clearChart()
Performs the indicator cleanup by deleting all generated chart objects, restoring the default chart interaction settings, and leaving the chart in its original state when the indicator is removed.
Next we define a function that captures the cursor's movement on the chart by converting its X and Y screen coordinates into normalized time and price values, returning them as an st_priceVolume structure that enables the user to accurately define the Volume Profile analysis range.
//+------------------------------------------------------------------+
//|               CURSOR COORDINATE PROCESSOR                        |
//+------------------------------------------------------------------+
st_priceVolume getCursorPriceTime(short x, short y)
  {
//---
   int sub;
   st_priceVolume tp;
   double tickSize = SymbolInfoDouble(_Symbol, SYMBOL_TRADE_TICK_SIZE);
   ChartXYToTimePrice(0, x, y, sub, tp.time, tp.price);
//--- NORMALIZE PRICE AND TIME
   tp.price = NormalizeDouble(MathRound(tp.price / tickSize) * tickSize, _Digits);
   tp.time = normalizeToChartTime(tp.time);
   return tp;
  }
Volume Computation
The calcVolume() function orchestrates the complete Volume Profile generation process by analyzing the selected market data, distributing volume across adaptive price bins, locating the Point of Control (POC), and visualizing the results on the chart.
//+------------------------------------------------------------------+
//|                   VOLUME COMPUTATION                             |
//+------------------------------------------------------------------+
void calcVolume(void)
  {
//---
   MqlRates rates[];

   if(CopyRates(_Symbol, PERIOD_CURRENT, startTime, endTime, rates) > 0)
     {
      double rangeHigh = rates[0].high, rangeLow = rates[0].low;
      int  count = MathAbs(iBarShift(_Symbol, PERIOD_CURRENT, startTime) -
                           iBarShift(_Symbol, PERIOD_CURRENT, endTime)) + 1;

      //---VERTICAL PRICE RANGE
      for(int b = 0; b < ArraySize(rates); b++)
        {
         if(rates[b].high > rangeHigh)
            rangeHigh = rates[b].high;

         if(rates[b].low < rangeLow)
            rangeLow = rates[b].low;
        }
      //--- SET ANALYSIS RANGE RECTANGLE PROPERLY
      ObjectSetDouble(0, _VOLUME_RANGE, OBJPROP_PRICE, 0, rangeHigh);
      ObjectSetDouble(0, _VOLUME_RANGE, OBJPROP_PRICE, 1, rangeLow);
      ChartRedraw();
      //--- ADAPTIVE BIN CONSTRUCTION
      int numberOfBins = int(count / 4);
      numberOfBins = MathMax(5, numberOfBins);
      double step = (rangeHigh - rangeLow) / numberOfBins;
      st_priceVolume bins[];
      ArrayResize(bins, numberOfBins);
      double binHigh = EMPTY_VALUE,  binLow = EMPTY_VALUE;
      bool useRealVol = (rates[0].real_volume > 0);

      //--- VOLUME ACCUMULATION USING SELECTED PRICE MODEL
      for(int w = 0; w < numberOfBins; w++)
        {
         binLow = rangeLow + step * w;
         binHigh = binLow + step;
         for(int c = 0; c < ArraySize(rates); c++)
           {
            if(getPrice(rates[c]) >= binLow && getPrice(rates[c]) <= binHigh)
              {
               bins[w].volume += (useRealVol) ? rates[c].real_volume : rates[c].tick_volume;
               bins[w].price = NormalizeDouble(getPrice(rates[c]), _Digits);
              }
           }
        }
      //--- VOLUME EXTREMES
      long maxVol = 0, minVol = LONG_MAX;
      for(int b = 0; b < ArraySize(bins); b++)
        {
         if(bins[b].volume > maxVol)
            maxVol = bins[b].volume;

         if(bins[b].volume < minVol)
            minVol = bins[b].volume;
        }
      //--- PROFILE SCALING
      int extendBars = 0;
      int maxProfileLength =  int(count * 0.4);
      int minProfileLength = (int)MathRound(maxProfileLength * 0.05);
      minProfileLength = MathMax(2, minProfileLength);// CLAMP
      color clr = clrRed;
      double dominance = EMPTY_VALUE;
      //--- PROFILE RENDERING
      bool pocDrawn = false;
      for(int p = 0; p < ArraySize(bins); p++)
        {
         binLow = rangeLow + step * p;
         binHigh = binLow + step;

         extendBars = minProfileLength + (int)MathRound(normalizeMinMax(bins[p].volume, maxVol, minVol)
                      * (maxProfileLength - minProfileLength));
         dominance = (double)extendBars / maxProfileLength;
         clr = (dominance >= 0.8) ? clrBlue :
               (dominance >= 0.6) ? clrPurple :
               (dominance >= 0.5) ? clrBrown :
               (dominance >= 0.4) ? clrLime :
               (dominance >= 0.2) ? clrTeal :
               (dominance >= 0.15) ? clrBlueViolet :
               clrGray;

         createRect(_PROFILE + (string)p, startTime, binHigh, startTime + (PeriodSeconds()*extendBars), binLow, clr);
         if(bins[p].volume == maxVol && !pocDrawn)
           {
            //--- DRAW MAXIMUM VOLUME'S POC
            createHLine(_PROFILE_POC + (string)p, NormalizeDouble(bins[p].price, _Digits), clr, "POC");
            pocDrawn = true;
           }
        }
      ChartRedraw();
     }
  }
Initialization and Cleanup
Having established the supporting helper functions, we now implement the standard MQL5 event handlers, beginning with OnInit() and OnDeinit(). During initialization, the indicator creates the ON/OFF menu button, providing users with a convenient way to enable or disable the interactive Crosshair Volume Profile. Conversely, when the indicator is removed, the cleanup routine is executed to delete all indicator-generated chart objects and restore the chart's default interaction settings, ensuring the chart is left in a clean and consistent state.//+------------------------------------------------------------------+ //| INITIALIZATION FUNCTION | //+------------------------------------------------------------------+ int OnInit() { //--- createMenuButton(); return(INIT_SUCCEEDED); } //+------------------------------------------------------------------+ //| DEINITIALIZATION FUNCTION | //+------------------------------------------------------------------+ void OnDeinit(const int32_t reason) { //--- clearChart(); }
Iteration Engine (OnCalculate)
Unlike conventional indicators that recalculate whenever new market data arrives, this indicator is designed around user interaction rather than incoming candles. For this reason, the OnCalculate() function is intentionally left empty, simply returning rates_total to satisfy the standard MQL5 indicator interface. All Volume Profile computations are instead triggered by Crosshair-driven chart events, ensuring the indicator updates only when the user selects or modifies an analysis range. This event-driven approach aligns with the interactive nature of the indicator while avoiding unnecessary recalculations on every incoming tick or bar.
//+------------------------------------------------------------------+
//| Custom indicator iteration function                              |
//+------------------------------------------------------------------+
int OnCalculate(const int32_t rates_total,
                const int32_t prev_calculated,
                const datetime &time[],
                const double &open[],
                const double &high[],
                const double &low[],
                const double &close[],
                const long &tick_volume[],
                const long &volume[],
                const int32_t &spread[])
  {
//--- EMPTY
   return(rates_total);
  }
Interactive Engine
At the heart of the indicator is the OnChartEvent() function, which handles all chart events and drives the interactive behavior of the Crosshair Volume Profile. Rather than relying on incoming market data, the indicator responds to user actions such as button clicks, mouse movement, keyboard input, and right-click operations. This event-driven architecture enables users to interactively define an analysis range and generate the Volume Profile only when required.
//+------------------------------------------------------------------+
//|                      CHARTEVENT FUNCTION                         |
//+------------------------------------------------------------------+
void OnChartEvent(const int32_t id,
                  const long &lparam,
                  const double &dparam,
                  const string &sparam)
  {
//---
   st_priceVolume tp;
   static bool isDragging = false;
   int key = (int)lparam;
   static ulong lastClick = 0;
   switch(id)
     {
      case CHARTEVENT_OBJECT_CLICK:
         //--- TOGGLE MENU BUTTON
         if(sparam == _MENU_BUTTON)
           {
            toggleMenuButton();
           }
         break;
      case CHARTEVENT_KEYDOWN:
         //--- PROFILE DELETION: "C" DOUBLE-CLICK
         if(key == 67)
           {
            ulong now = GetTickCount();
            bool doubleClick = (now - lastClick <= 300);
            lastClick = now;
            if(doubleClick && ObjectFind(0, _VOLUME_RANGE) > -1)
              {
               ObjectsDeleteAll(0, _PROFILE);
               ObjectDelete(0, _VOLUME_RANGE);
               if(ObjectGetString(0, _MENU_BUTTON, OBJPROP_TEXT) == "ON")
                 {
                  toggleMenuButton();
                 }
               ChartRedraw();
              }
           }
         break;
      case CHARTEVENT_MOUSE_MOVE:
         if(isDragging)
           {
            //--- UPDATE OBJECTS ALONG THE CURSOR POSITION USING getCursorPriceTime()
            tp = getCursorPriceTime((short)lparam, (short)dparam);
            tp.time = (tp.time >= iTime(_Symbol, PERIOD_CURRENT, 0)) ?
                      iTime(_Symbol, PERIOD_CURRENT, 1) : tp.time;
            ObjectMove(0, _V_END_LINE, 0, tp.time, 0);
            ObjectMove(0, _H_LINE, 0, 0, tp.price);
            ObjectMove(0, _VOLUME_RANGE, 1, tp.time, tp.price);
            endTime = tp.time;
            ChartRedraw();
           }
         //--- RIGHT-CLICK
         if(((uchar)sparam & MOUSE_RIGHT) != 0)
           {
            tp = getCursorPriceTime((short)lparam, (short)dparam);

            if(!isDragging)
              {
               //--- CREATE CROSSHAIR
               isDragging = true;
               color clr = (color)ChartGetInteger(0, CHART_COLOR_BACKGROUND);
               ObjectsDeleteAll(0, _PROFILE);
               ChartRedraw();
               startTime = tp.time;
               createVLine(_V_START_LINE, tp.time);
               createVLine(_V_END_LINE, 0);
               createHLine(_H_LINE, 0, (clr == clrBlack) ?
                           clrWhite : clrBlack);
               //--- POSITION RECTANGLE ANCHOR (0) AT THE HIGH OF BAR AT RIGHT-CLICK POSITION
               int index = iBarShift(_Symbol, PERIOD_CURRENT, tp.time);
               double price = iHigh(_Symbol, PERIOD_CURRENT, index);
               createRect(_VOLUME_RANGE, tp.time, price, 0, 0, clrOldLace, "ANALYSIS RANGE");
               ChartRedraw();
              }
           }
         else
           {
            //--- RIGHT-CLICK RELEASE
            if(isDragging)
              {
               //--- DELETE CROSSHAIR
               ObjectDelete(0, _V_START_LINE);
               ObjectDelete(0, _V_END_LINE);
               ObjectDelete(0, _H_LINE);
               ChartRedraw();
               isDragging = false;
               //--- RENDER VOLUME PROFILE
               calcVolume();
              }
           }
         break;
     }
  }
Explanation:
- Menu button click
When the user clicks the ON/OFF menu button, the toggleMenuButton() function is invoked to activate or deactivate the interactive mode, while updating both the button's appearance and the chart interaction settings.
- Volume Profile deletion
To facilitate repeated analyses without cluttering the chart, a double-click of the "C" key clears the existing Volume Profile, removes the analysis range rectangle, and restores the indicator to its initial state, ready for a new selection.
- Right-click event
While interactive mode is enabled, pressing and holding the right mouse button initiates the analysis process. The current cursor position is converted into normalized chart time and price coordinates, which become the starting point of the analysis range. The indicator then creates the interactive crosshair by drawing the starting vertical line, the movable vertical line, the horizontal price line, and the analysis range rectangle.
- Drag-and-move operation
As the user drags the mouse with the right button held down, the indicator continuously tracks the cursor position. The movable vertical line, horizontal line, and analysis rectangle are updated in real time, allowing the user to precisely define the horizontal time boundaries of the analysis range before computation.
- Right-click release
Releasing the right mouse button signals that the desired analysis range has been selected. The temporary crosshair objects are removed from the chart, the dragging operation is terminated, and the calcVolume() function is called to compute the volume distribution, identify the Point of Control (POC), and render the completed Volume Profile for the selected region.
Indicator Testing
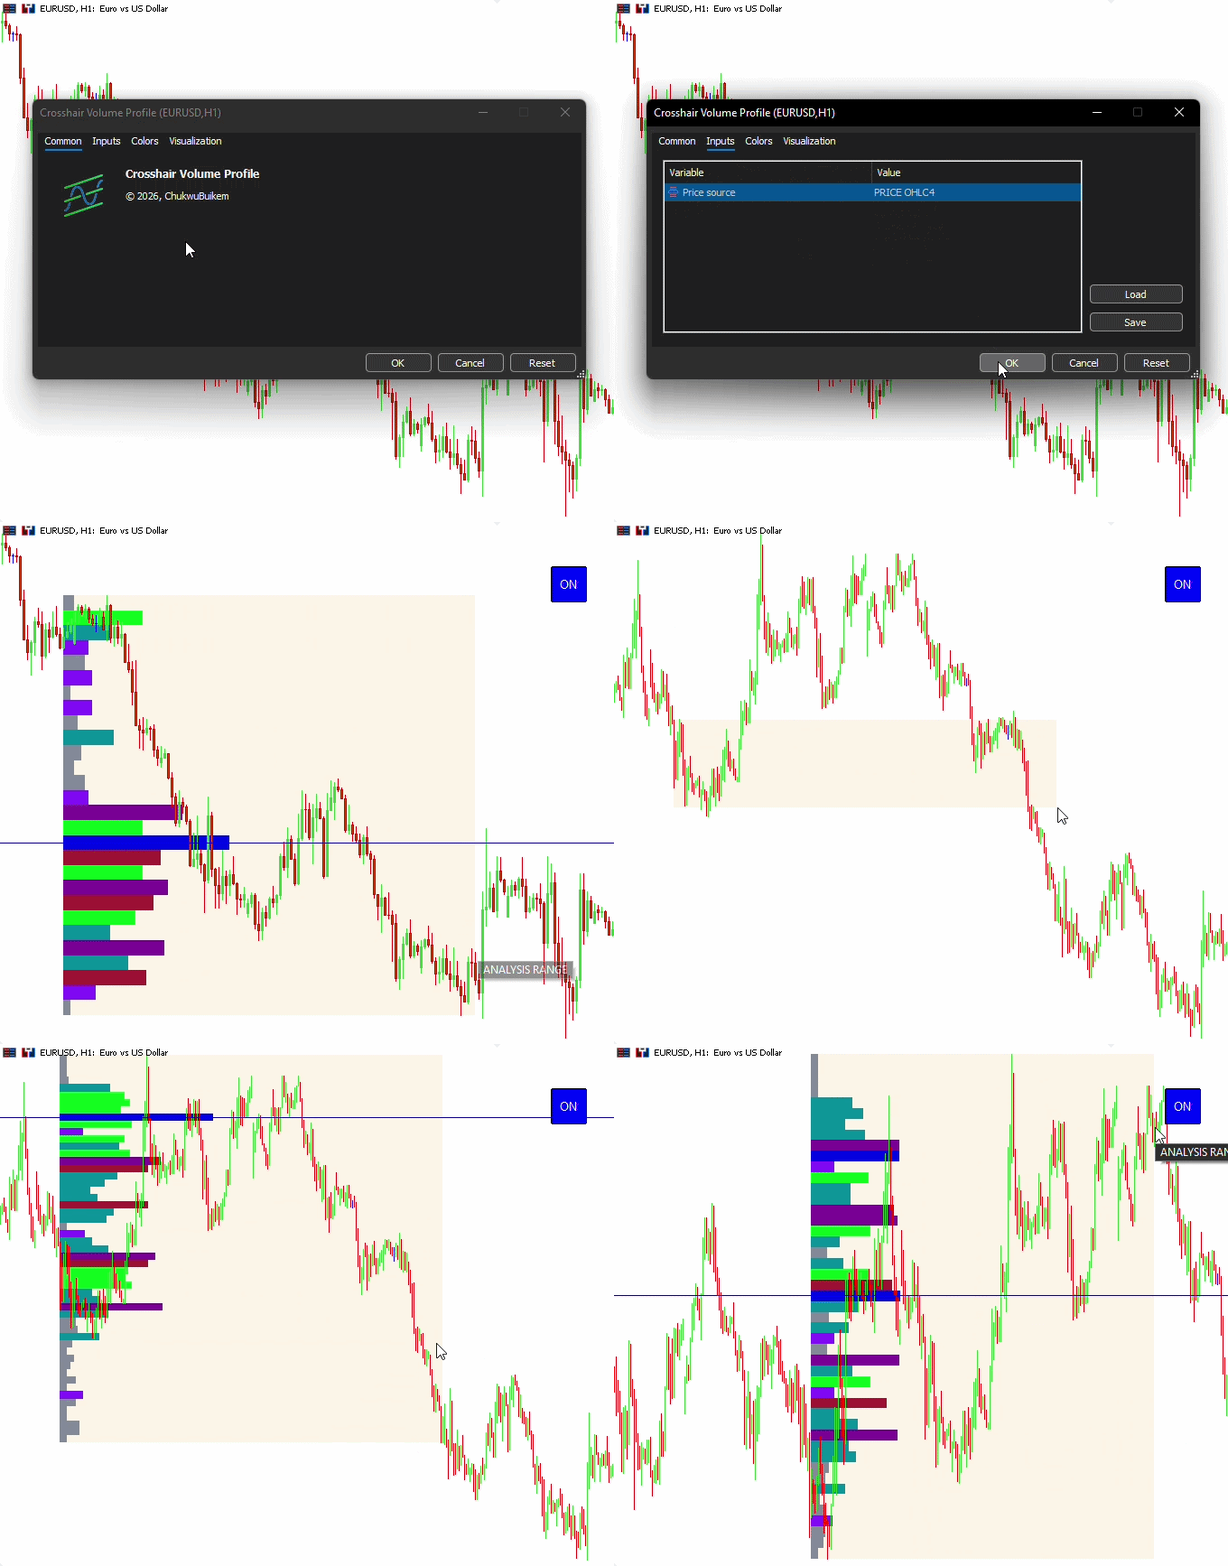
Once the indicator compiles successfully without errors, it is ready for testing on the chart. The GIF below illustrates the complete interactive workflow, showing how the indicator is activated through the ON/OFF menu button, how the crosshair is used to define an analysis range via a right-click-and-drag operation, and how the Volume Profile is automatically computed and rendered upon releasing the mouse button. This validates the indicator's event-driven design and confirms that the interactive Crosshair Volume Profile operates as intended.
Conclusion
In this article, we implemented an interactive Crosshair Volume Profile Indicator in MQL5 that leverages an event-driven architecture to provide an intuitive and efficient approach to volume analysis. Rather than relying on continuous recalculation with every incoming tick or bar, the indicator enables users to interactively define an analysis range using a crosshair, compute the corresponding volume distribution, and visualize the resulting Volume Profile directly on the chart.
The major implementations include:
-
Crosshair-driven range selection—an interactive crosshair that allows users to define the analysis range through a simple right-click-and-drag operation, providing precise control over the profiled market region.
-
Flexible price source computation—support for multiple representative price models, including Close, Median, Typical, Weighted, and OHLC4, enabling the Volume Profile to adapt to different analytical preferences.
-
Adaptive volume profile construction—automatic generation of price bins based on the selected analysis range, followed by volume accumulation using either tick volume or real volume for proportional profile construction.
By combining interactive chart manipulation with efficient volume analysis, you now have a robust framework upon which even more sophisticated Volume Profile and market structure tools can be developed in MQL5.
Warning: All rights to these materials are reserved by MetaQuotes Ltd. Copying or reprinting of these materials in whole or in part is prohibited.
This article was written by a user of the site and reflects their personal views. MetaQuotes Ltd is not responsible for the accuracy of the information presented, nor for any consequences resulting from the use of the solutions, strategies or recommendations described.

 Low-Frequency Quantitative Strategies in MetaTrader 5 (Part 5): Pre-Backtest Evaluation of Machine-Learning-Generated Signals Through Formulaic Alphas
 Building a Dynamic ATR-Based Trend Channel Indicator in MQL5
 Bonobo Optimizer (BO)
 Enhancing the MQL5 Portfolio Analyzer Dashboard: Active Mitigation, Data Exports, and AI Integration

- Free trading apps
- Over 8,000 signals for copying
- Economic news for exploring financial markets
You agree to website policy and terms of use