

Building an Adaptive Fibonacci Volatility Band Indicator in MQL5
 119
119
 0
0

Introduction
Traditional price band indicators often rely on fixed distances, making them less responsive to changing market volatility and reducing their effectiveness across different market conditions. To address this limitation, we will build an adaptive Fibonacci volatility band indicator. It adjusts band width using a smoothed Average True Range (ATR) and uses a smoothed price as the center line. The resulting indicator can be used to visualize dynamic volatility zones, identify potential support and resistance areas, and analyze how price behaves as market volatility expands or contracts. We will implement the indicator in MQL5. It calculates smoothed ATR and price values, applies Fibonacci ratios to generate multiple band levels, and plots filled volatility zones.
Project Overview and Implementation Plan
Before implementing in MQL5, we define the indicator structure and the required build steps. A clear plan shows how each component contributes to the final indicator: volatility measurement, price smoothing, band generation, and visualization.
What We Are Building
In this project, we will develop a custom adaptive Fibonacci volatility band indicator that adjusts its band width according to changing market volatility. Rather than using fixed distances from a central price line, the indicator combines a Smoothed Moving Average (SMMA) of price with a smoothed Average True Range (ATR) to create dynamic upper and lower bands. Fibonacci ratios are then applied to the smoothed ATR values, allowing the bands to expand and contract automatically as market conditions change.
To improve the interpretation chart, the indicator displays multiple Fibonacci band levels around the smoothed price. It also fills the outer-band zones. These components provide a clear visual representation of changing market volatility and dynamic price boundaries, making the indicator useful for identifying potential support and resistance zones, monitoring price expansion, and serving as a foundation for further indicator and strategy development.
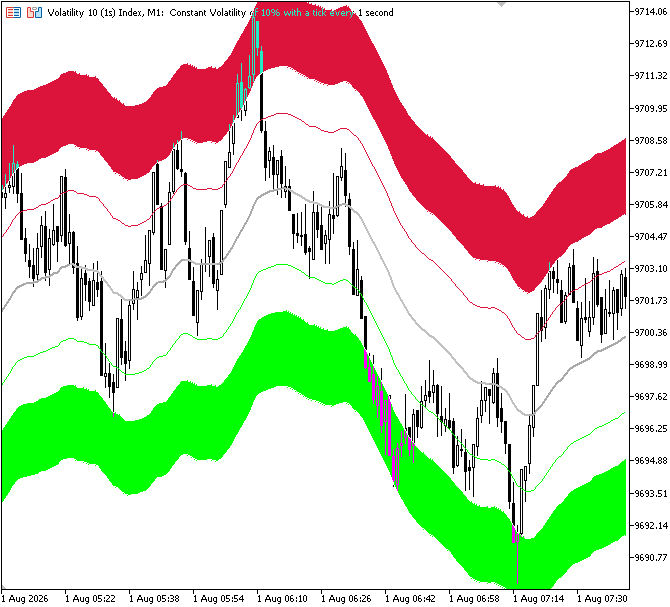
Figure 1. What We Are Building
Implementation Plan
Before we begin the implementation, let's explore the sequence of steps involved in building the adaptive Fibonacci volatility band indicator in MQL5. This will provide a clear roadmap of the calculations, data processing, and visualization stages required to transform the concept into a fully functional custom indicator.
1. Setting up the Indicator Properties and Buffers
First, we configure the basic structure of the adaptive Fibonacci volatility band indicator.
This includes:
- indicator properties that define the number of buffers, plots, and the chart window where the indicator will be displayed;
- plot configurations that specify the drawing styles, colors, and widths for the Fibonacci upper bands, lower bands, middle SMMA line, and filled volatility zones;
- input parameters that allow users to customize the calculation period, applied price, band width, Fibonacci ratios, and display settings;
- indicator buffers used to store the calculated Fibonacci levels, middle line values, and filling areas for chart rendering;
- internal working arrays that store intermediate calculations such as smoothed ATR values, smoothed price values, and trend direction data;
- buffer mappings that connect each indicator buffer with its corresponding plot or calculation role during initialization.
2. Setting up ATR Calculation and Data Processing
After configuring the indicator structure, the next step is to prepare the data required for calculating the adaptive Fibonacci volatility bands. In this stage, we initialize the Average True Range (ATR) calculation, manage the required historical data, and optimize the calculation process to ensure efficient indicator updates.
This includes:
- creating an ATR(200) indicator handle to obtain the volatility measurements used in the band calculations;
- checking that enough historical bars are available to perform ATR and SMMA calculations correctly;
- resizing internal arrays used to store ATR values, smoothed price data, trend information, and intermediate calculations;
- determining the starting point for recalculation to process only new and updated bars instead of recalculating the entire chart history on every tick;
- applying the lookback limitation and warm-up period required for accurate ATR and SMMA initialization;
- clearing indicator buffers during the first calculation to prevent invalid values from being displayed;
- retrieving ATR values using CopyBuffer() and converting them into the correct order for further processing.
3. Calculating Smoothed ATR and Price Values
After preparing the required data, the indicator calculates the smoothed ATR and smoothed price values that form the foundation of the adaptive Fibonacci volatility bands. The smoothed ATR value is used to measure the current volatility level, while the smoothed price value creates the central reference line from which the Fibonacci bands are projected.
During this step, the indicator:
- calculates the initial Smoothed ATR value by applying a Simple Moving Average (SMA) to the first 100 ATR values using the formula:
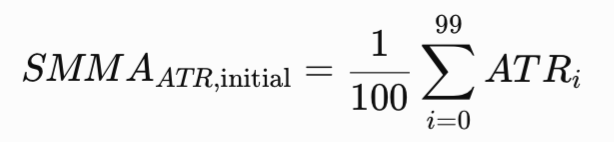
Figure 2. Initial Smoothed ATR
- applies the SMMA calculation to update the ATR smoothing value for each new bar using the formula:

Figure 3. Smoothed ATR
- calculates the initial Smoothed Price value by applying a Simple Moving Average to the selected applied price values over the defined period using the formula:
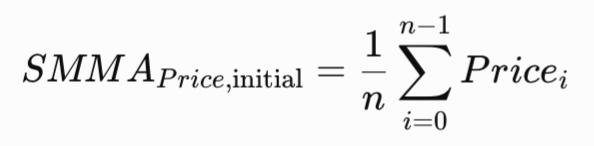
Figure 4. Initial Smoothed Price
- applies the SMMA calculation to update the smoothed price value for each new bar using the formula:

Figure 5. Smoothed Price
The resulting Smoothed ATR value will later be combined with Fibonacci ratios to determine the width of the upper and lower volatility bands, while the Smoothed Price value will serve as the middle line of the indicator.
4. Generating Adaptive Fibonacci Volatility Bands
After calculating the Smoothed ATR and Smoothed Price values, the indicator uses these values to generate the adaptive Fibonacci volatility bands. The Smoothed ATR value acts as the volatility measurement, determining how far the bands should be placed from the middle line, while the Smoothed Price value provides the central reference point from which the upper and lower bands are calculated. To understand this process, assume that the Smoothed ATR value has stabilized at:
Smoothed ATR = 0.0045
This value acts as the volatility reference for calculating the adaptive bandwidth. Instead of maintaining a constant distance from the middle line, the indicator continuously adjusts the bands based on the current market environment. Higher volatility produces a larger Smoothed ATR value, resulting in wider bands, while reduced volatility decreases the distance between the bands and the middle line.
The volatility unit is then multiplied by the selected Fibonacci ratios to calculate the distance of each band from the middle line. Assuming the width multiplier is set to 1.0, the band distances are calculated as follows:
| Band | Fibonacci Ratio | Calculation | Distance |
|---|---|---|---|
| Band 1 | 1.618 | 0.0045 × 1.618 | 0.00728 |
| Band 2 | 2.618 | 0.0045 × 2.618 | 0.01178 |
| Band 3 | 4.236 | 0.0045 × 4.236 | 0.01906 |
After calculating the distances, the indicator projects the Fibonacci levels above and below the Smoothed Price value. For example, if the current Smoothed Price value is:
Smoothed Price = 1.1000
| Line | Calculation | Price Level |
|---|---|---|
| Top Band 3 | 1.1000 + 0.01906 | 1.11906 |
| Top Band 2 | 1.1000 + 0.01178 | 1.11178 |
| Top Band 1 | 1.1000 + 0.00728 | 1.10728 |
| Middle Line | 1.10000 | |
| Bottom Band 1 | 1.1000 - 0.00728 | 1.09272 |
| Bottom Band 2 | 1.1000 - 0.01178 | 1.08822 |
| Bottom Band 3 | 1.1000 - 0.01906 | 1.08094 |
The final output is a set of adaptive Fibonacci volatility bands positioned around the Smoothed Price line. Since the band distances are derived from the Smoothed ATR value, the indicator automatically adjusts its range based on current volatility, expanding during active market conditions and contracting when price movement becomes quieter.
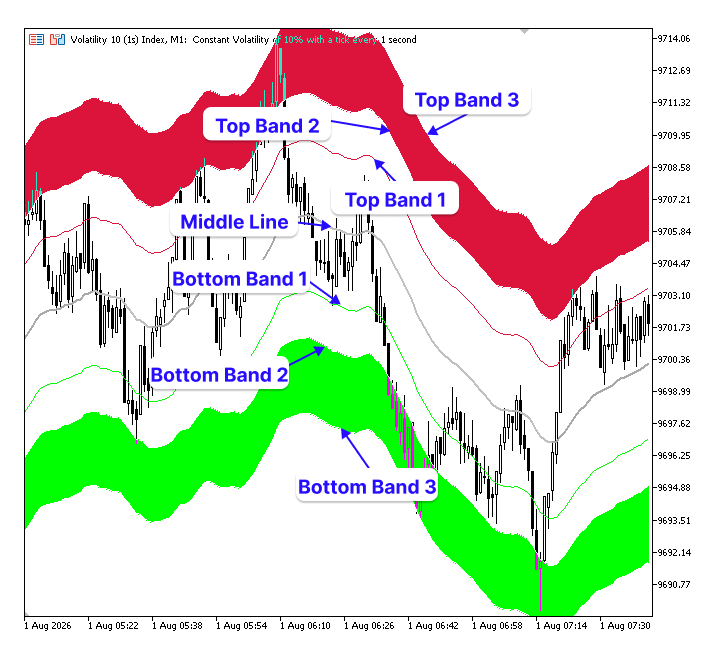
Figure 6. Bands
Implementation in MQL5
In this section, we will implement the adaptive Fibonacci volatility band indicator in MQL5 by following the implementation plan and developing each component step by step.
Setting up the Indicator Properties and Buffers
First, set up the indicator properties.
Example:#property indicator_chart_window #property indicator_buffers 12 #property indicator_plots 9 //--- plot 0: Fib Top 3 #property indicator_type1 DRAW_LINE #property indicator_color1 clrCrimson #property indicator_width1 1 //--- plot 1: Fib Top 2 #property indicator_type2 DRAW_LINE #property indicator_color2 clrCrimson #property indicator_width2 1 //--- plot 2: Fib Top 1 #property indicator_type3 DRAW_LINE #property indicator_color3 clrCrimson #property indicator_width3 1 //--- plot 3: Middle SMMA (color-changing: up vs down) #property indicator_type4 DRAW_COLOR_LINE #property indicator_color4 clrDarkGray,clrSilver #property indicator_width4 2 //--- plot 4: Fib Bottom 1 #property indicator_type5 DRAW_LINE #property indicator_color5 clrLime #property indicator_width5 1 //--- plot 5: Fib Bottom 2 #property indicator_type6 DRAW_LINE #property indicator_color6 clrLime #property indicator_width6 1 //--- plot 6: Fib Bottom 3 #property indicator_type7 DRAW_LINE #property indicator_color7 clrLime #property indicator_width7 1 //--- plot 7: Top fill (between ratio2 and ratio3) #property indicator_type8 DRAW_FILLING #property indicator_color8 clrCrimson //--- plot 8: Bottom fill (between ratio2 and ratio3) #property indicator_type9 DRAW_FILLING #property indicator_color9 clrLime
Explanation:
The indicator is configured to run directly on the main price chart by using the chart window property. It is designed with 12 indicator buffers and 9 plots, where each buffer stores the calculated values required for drawing the Fibonacci volatility bands, middle line, and filled areas. The upper Fibonacci levels are displayed using three separate line plots, representing the first, second, and third upper volatility bands. These lines are drawn in a crimson color to visually distinguish the upper range of the indicator. Similarly, the three lower Fibonacci levels are displayed as separate line plots using a lime color to represent the lower volatility range. The middle line is created using a color-changing line plot, which allows the indicator to display different colors depending on the detected direction of the smoothed price movement. This provides a visual indication of whether the middle line is moving upward or downward.
In addition to the individual Fibonacci levels, two filling plots are configured to highlight the volatility zones between the Fibonacci bands. The upper fill highlights the space between the second and third upper Fibonacci bands, while the lower fill marks the area between the second and third lower Fibonacci bands. These visual elements define the outer volatility zones of the indicator and provide the necessary plotting structure for displaying the adaptive bands on the chart.
Next, we will configure and map the indicator buffers to their corresponding plots and data storage arrays.
Example://--- INPUTS input int InpLookbackBars = 300; // Lookback (bars to process, 0 = all history) input int InpExtend = 30; // Extend Bands (bars) input int InpPeriod = 20; // Period input ENUM_APPLIED_PRICE InpPrice = PRICE_CLOSE; // Source input double InpWidth = 1.0; // Width input bool InpHideFib = false; // Hide Fibonacci Lines input double InpFibRatio1 = 1.618; // Fibonacci Ratio 1 input double InpFibRatio2 = 2.618; // Fibonacci Ratio 2 input double InpFibRatio3 = 4.236; // Fibonacci Ratio 3 //--- internal working arrays (not plotted) double AtrRaw[],SmmaAtr[],SmmaPrice[],SlopeArr[]; bool PivHigh[],PivLow[],MidTrend[]; //--- indicator buffers double Top3[],Top2[],Top1[]; double Mid[],MidColor[]; double Bot1[],Bot2[],Bot3[]; double FillTopHi[],FillTopLo[]; double FillBotHi[],FillBotLo[]; //+------------------------------------------------------------------+ //| Custom indicator initialization function | //+------------------------------------------------------------------+ int OnInit() { //--- indicator buffers mapping SetIndexBuffer(0,Top3,INDICATOR_DATA); SetIndexBuffer(1,Top2,INDICATOR_DATA); SetIndexBuffer(2,Top1,INDICATOR_DATA); SetIndexBuffer(3,Mid,INDICATOR_DATA); SetIndexBuffer(4,MidColor,INDICATOR_COLOR_INDEX); SetIndexBuffer(5,Bot1,INDICATOR_DATA); SetIndexBuffer(6,Bot2,INDICATOR_DATA); SetIndexBuffer(7,Bot3,INDICATOR_DATA); SetIndexBuffer(8,FillTopHi,INDICATOR_DATA); SetIndexBuffer(9,FillTopLo,INDICATOR_DATA); SetIndexBuffer(10,FillBotHi,INDICATOR_DATA); SetIndexBuffer(11,FillBotLo,INDICATOR_DATA); ArraySetAsSeries(Top3,false); ArraySetAsSeries(Top2,false); ArraySetAsSeries(Top1,false); ArraySetAsSeries(Mid,false); ArraySetAsSeries(MidColor,false); ArraySetAsSeries(Bot1,false); ArraySetAsSeries(Bot2,false); ArraySetAsSeries(Bot3,false); ArraySetAsSeries(FillTopHi,false); ArraySetAsSeries(FillTopLo,false); ArraySetAsSeries(FillBotHi,false); ArraySetAsSeries(FillBotLo,false); //--- return(INIT_SUCCEEDED); }
Explanation:
After defining the indicator properties, the next step is to create the input parameters, internal calculation arrays, and indicator buffers required for the adaptive Fibonacci volatility band indicator. The input parameters provide flexibility by allowing users to control how the indicator behaves. The lookback setting determines the amount of historical data processed, while the extension setting controls how far the bands can be projected. The smoothing period defines the length used for the price calculation, and the selected price source determines which price value is used as the basis for the middle line calculation.
The width parameter controls the overall size of the volatility bands, while the Fibonacci ratio parameters define the distance of each upper and lower band from the middle line. An option is also included to control the visibility of the Fibonacci levels. The indicator also creates internal working arrays that store intermediate calculation values. These arrays hold the raw ATR values, the smoothed ATR values, the smoothed price values, and additional calculation states used during processing. Since these values are only required for internal calculations and are not displayed on the chart, they are stored separately from the indicator buffers.
The indicator buffers are then declared to store the final values that will be displayed on the chart. These buffers hold the three upper Fibonacci bands, three lower Fibonacci bands, the middle smoothed price line, the color index for the middle line, and the data required for filling the volatility zones between the outer Fibonacci levels. Inside the OnInit() function, the SetIndexBuffer() function is used to connect each buffer with its corresponding plot. This mapping allows MetaTrader 5 to know which calculated values should be displayed as lines, color changes, or filled areas on the chart.
Finally, the ArraySetAsSeries() function is applied to the plotting buffers and sets their indexing direction. The buffers are set to match the natural flow of time, where previous bar values are placed at lower indexes and recent bar values are placed at higher indexes. This arrangement allows the indicator to perform calculations consistently and display the generated Fibonacci volatility bands correctly. After completing this step, all input controls, calculation storage, and chart display buffers are prepared, allowing the indicator calculation logic to be implemented.
Setting up ATR Calculation and Data Processing
Next, we will initialize the ATR calculation and prepare the required data for further indicator calculations.
Example:
int    g_atrHandle=INVALID_HANDLE;
//+------------------------------------------------------------------+
//| Custom indicator initialization function                         |
//+------------------------------------------------------------------+
int OnInit()
  {
//--- indicator buffers mapping
   SetIndexBuffer(0,Top3,INDICATOR_DATA);
   SetIndexBuffer(1,Top2,INDICATOR_DATA);
   SetIndexBuffer(2,Top1,INDICATOR_DATA);
   SetIndexBuffer(3,Mid,INDICATOR_DATA);
   SetIndexBuffer(4,MidColor,INDICATOR_COLOR_INDEX);
   SetIndexBuffer(5,Bot1,INDICATOR_DATA);
   SetIndexBuffer(6,Bot2,INDICATOR_DATA);
   SetIndexBuffer(7,Bot3,INDICATOR_DATA);
   SetIndexBuffer(8,FillTopHi,INDICATOR_DATA);
   SetIndexBuffer(9,FillTopLo,INDICATOR_DATA);
   SetIndexBuffer(10,FillBotHi,INDICATOR_DATA);
   SetIndexBuffer(11,FillBotLo,INDICATOR_DATA);

   ArraySetAsSeries(Top3,false);
   ArraySetAsSeries(Top2,false);
   ArraySetAsSeries(Top1,false);
   ArraySetAsSeries(Mid,false);
   ArraySetAsSeries(MidColor,false);
   ArraySetAsSeries(Bot1,false);
   ArraySetAsSeries(Bot2,false);
   ArraySetAsSeries(Bot3,false);
   ArraySetAsSeries(FillTopHi,false);
   ArraySetAsSeries(FillTopLo,false);
   ArraySetAsSeries(FillBotHi,false);
   ArraySetAsSeries(FillBotLo,false);

   g_atrHandle=iATR(_Symbol,_Period,200);
   if(g_atrHandle==INVALID_HANDLE)
     {
      Print("Failed to create ATR(200) handle");
      return(INIT_FAILED);
     }

//---
   return(INIT_SUCCEEDED);
  }
//+------------------------------------------------------------------+
//| Custom indicator iteration function                              |
//+------------------------------------------------------------------+
int OnCalculate(const int32_t rates_total,
                const int32_t prev_calculated,
                const datetime &time[],
                const double &open[],
                const double &high[],
                const double &low[],
                const double &close[],
                const long &tick_volume[],
                const long &volume[],
                const int32_t &spread[])
  {
//---
   int minBars=310; // ATR(200) + SMMA(100) warm-up
   if(rates_total<minBars)
      return(0);

   ArrayResize(AtrRaw,rates_total);
   ArrayResize(SmmaAtr,rates_total);
   ArrayResize(SmmaPrice,rates_total);
   ArrayResize(SlopeArr,rates_total);
   ArrayResize(PivHigh,rates_total);
   ArrayResize(PivLow,rates_total);
   ArrayResize(MidTrend,rates_total);

//--- Recalculate only the current forming bar and newly added bars to improve performance by avoiding full history recalculation on every tick.
   int limit = (prev_calculated==0) ? 0 : prev_calculated-1;
   if(limit<0)
      limit=0;

//--- Limit recalculation to the selected lookback period while keeping enough historical bars for ATR and SMMA warm-up.
   int warmup=309;
   int windowStart=0;
   if(InpLookbackBars>0)
      windowStart=MathMax(0,rates_total-InpLookbackBars-warmup);
   int calcFrom=MathMax(limit,windowStart);

   if(prev_calculated==0)
     {
      //--- blank everything first so bars outside the lookback window don't
      //--- show stale/garbage buffer contents; cheap - simple array fills.
      ArrayInitialize(Top3,EMPTY_VALUE);
      ArrayInitialize(Top2,EMPTY_VALUE);
      ArrayInitialize(Top1,EMPTY_VALUE);
      ArrayInitialize(Mid,EMPTY_VALUE);
      ArrayInitialize(MidColor,0);
      ArrayInitialize(Bot1,EMPTY_VALUE);
      ArrayInitialize(Bot2,EMPTY_VALUE);
      ArrayInitialize(Bot3,EMPTY_VALUE);
      ArrayInitialize(FillTopHi,EMPTY_VALUE);
      ArrayInitialize(FillTopLo,EMPTY_VALUE);
      ArrayInitialize(FillBotHi,EMPTY_VALUE);
      ArrayInitialize(FillBotLo,EMPTY_VALUE);
      ArrayInitialize(SmmaAtr,EMPTY_VALUE);
      ArrayInitialize(SmmaPrice,EMPTY_VALUE);
     }

//--- Fetch required ATR values with extra history for SMMA initialization and convert them to chronological order.
   int atrFetchFrom = MathMax(0,calcFrom-100);
   int copyCount = rates_total-atrFetchFrom;
   double atrSeries[];
   ArraySetAsSeries(atrSeries,true);
   if(CopyBuffer(g_atrHandle,0,0,copyCount,atrSeries)<=0)
      return(0);

   ArraySetAsSeries(AtrRaw,false);
   for(int k=0; k<copyCount; k++)
     {
      AtrRaw[rates_total-1-k]=atrSeries[k];
     }

//--- return value of prev_calculated for next call
   return(rates_total);
  }
Explanation:
After setting up the indicator structure, the next step is to initialize the ATR calculation and prepare the required data arrays for processing. First, the indicator creates an ATR handle using a 200-period ATR calculation, which provides the raw volatility values used as the input for the later smoothing process. If the ATR handle cannot be created successfully, the initialization process is stopped because the indicator cannot continue without the required volatility data. Before performing any calculations, the indicator checks whether enough historical bars are available. Since the calculation requires a 200-period ATR and an additional 100-period smoothing stage, a minimum amount of historical data is required before valid values can be produced. If the available bars are insufficient, the calculation is skipped until enough data becomes available.
The indicator then resizes the internal arrays used for storing raw ATR values, smoothed ATR values, smoothed price values, and other calculation states according to the current chart history size. This ensures that the arrays have enough space to store data for every available bar. To improve performance, the indicator avoids recalculating the entire chart history on every tick. Instead, it determines the starting point for calculation by checking the previously calculated bars and only processes the current forming bar and newly added bars.
When the indicator is loaded for the first time, it also applies the selected lookback limit while keeping additional historical bars required for ATR and SMMA initialization. During the first calculation, the indicator clears its buffers to remove invalid data and prevent outdated values from being displayed. It then retrieves the required ATR values with additional historical data for proper SMMA initialization and rearranges the values into chronological order to ensure correct processing from older bars to newer bars.
Calculating Smoothed ATR and Price Values
Next, we will calculate the Smoothed ATR and Smoothed Price values used to build the adaptive Fibonacci bands.
Example:
//+------------------------------------------------------------------+
//| Simple average of src[] over `length` bars ending at index i.    |
//| Used to seed the Wilder/SMMA smoothing on its very first value   |
//| (returns EMPTY_VALUE if there isn't enough history yet).         |
//+------------------------------------------------------------------+
double SmaAt(const double &src[],int i,int length)
  {
   if(i<length-1)
      return(EMPTY_VALUE);
   double sum=0;
   for(int k=i-length+1;k<=i;k++)
      sum+=src[k];
   return(sum/length);
  }

//+------------------------------------------------------------------+
//| Returns the selected applied price value for a specific bar       |
//+------------------------------------------------------------------+
double GetPrice(ENUM_APPLIED_PRICE ap,const double &open[],const double &high[],
                const double &low[],const double &close[],int i)
  {
   switch(ap)
     {
      case PRICE_OPEN:
         return(open[i]);
      case PRICE_HIGH:
         return(high[i]);
      case PRICE_LOW:
         return(low[i]);
      case PRICE_MEDIAN:
         return((high[i]+low[i])/2.0);
      case PRICE_TYPICAL:
         return((high[i]+low[i]+close[i])/3.0);
      case PRICE_WEIGHTED:
         return((high[i]+low[i]+2*close[i])/4.0);
      default:
         return(close[i]);
     }
  }

//+------------------------------------------------------------------+
//|Simple average of the applied price over `length` bars ending at i|
//+------------------------------------------------------------------+
double SmaPriceAt(ENUM_APPLIED_PRICE ap,const double &open[],const double &high[],
                  const double &low[],const double &close[],int i,int length)
  {
   if(i<length-1)
      return(EMPTY_VALUE);
   double sum=0;
   for(int k=i-length+1;k<=i;k++)
      sum+=GetPrice(ap,open,high,low,close,k);
   return(sum/length);
  }
ArraySetAsSeries(AtrRaw,false);
for(int k=0; k<copyCount; k++)
  {
   AtrRaw[rates_total-1-k]=atrSeries[k];
  }

for(int i=calcFrom;i<rates_total;i++)
  {

//--- SMMA of ATR(200), length 100
   if(i<199+100)
      SmmaAtr[i]=EMPTY_VALUE;
   else
     {
      if(i==199+100 || SmmaAtr[i-1]==EMPTY_VALUE)
         SmmaAtr[i]=SmaAt(AtrRaw,i,100);
      else
         SmmaAtr[i]=(SmmaAtr[i-1]*99+AtrRaw[i])/100.0;
     }

//--- SMMA of price, length InpPeriod
   double px=GetPrice(InpPrice,open,high,low,close,i);
   if(i<InpPeriod-1)
      SmmaPrice[i]=EMPTY_VALUE;
   else
     {
      if(i==InpPeriod-1 || SmmaPrice[i-1]==EMPTY_VALUE)
         SmmaPrice[i]=SmaPriceAt(InpPrice,open,high,low,close,i,InpPeriod);
      else
         SmmaPrice[i]=(SmmaPrice[i-1]*(InpPeriod-1)+px)/InpPeriod;
     }

  }
Explanation:
After preparing the ATR data and price values, the indicator calculates the Smoothed ATR and Smoothed Price values that serve as the foundation for generating the adaptive Fibonacci volatility bands. The Smoothed ATR provides a stable measurement of market volatility, while the Smoothed Price creates the central reference line from which the Fibonacci bands are projected. Before performing the smoothing calculations, the indicator defines helper functions required to generate the initial SMA values and retrieve the selected price data. The SmaAt() function calculates the average value of a data array over a specified number of bars. It is used to initialize the first Smoothed ATR value because the SMMA calculation requires an initial average before the recursive smoothing process can begin. If enough historical data is unavailable, the function returns an empty value to prevent invalid calculations.
The GetPrice() function retrieves the price value used for smoothing based on the selected applied price method. It allows the indicator to work with different price sources, including open, high, low, median, typical, weighted, or closing prices. This makes the middle line calculation more flexible by allowing users to choose the price representation that best suits their analysis.
Next, the SmaPriceAt() function calculates the initial average of the selected price values over the defined period. Similar to the ATR calculation, this initial average is required to start the SMMA process before the indicator begins updating the smoothed value for each new bar. During the main calculation loop, the indicator first calculates the Smoothed ATR value. It waits until enough historical data is available for both the ATR calculation and the smoothing period, then initializes the first value using the average of the required ATR values. After initialization, the SMMA calculation is applied continuously to update the volatility measurement with each new bar.
The indicator then calculates the Smoothed Price value using the same approach. It first retrieves the selected price value for the current bar, creates the initial average when enough historical data is available, and then applies the SMMA calculation to update the central price line as new bars appear. By completing this step, the indicator obtains a stable volatility measurement and a smoothed price reference line. These two values will later be used to calculate the adaptive Fibonacci band distances and position the upper and lower volatility levels around the middle line.
Generating Adaptive Fibonacci Volatility Bands
Next, we will generate the Fibonacci volatility bands using the Smoothed ATR and Smoothed Price values.
Example:
for(int i=calcFrom;i<rates_total;i++)
  {
//--- SMMA of ATR(200), length 100
   if(i<199+100)
      SmmaAtr[i]=EMPTY_VALUE;
   else
     {
      if(i==199+100 || SmmaAtr[i-1]==EMPTY_VALUE)
         SmmaAtr[i]=SmaAt(AtrRaw,i,100);
      else
         SmmaAtr[i]=(SmmaAtr[i-1]*99+AtrRaw[i])/100.0;
     }

//--- SMMA of price, length InpPeriod
   double px=GetPrice(InpPrice,open,high,low,close,i);
   if(i<InpPeriod-1)
      SmmaPrice[i]=EMPTY_VALUE;
   else
     {
      if(i==InpPeriod-1 || SmmaPrice[i-1]==EMPTY_VALUE)
         SmmaPrice[i]=SmaPriceAt(InpPrice,open,high,low,close,i,InpPeriod);
      else
         SmmaPrice[i]=(SmmaPrice[i-1]*(InpPeriod-1)+px)/InpPeriod;
     }

   if(SmmaAtr[i]==EMPTY_VALUE || SmmaPrice[i]==EMPTY_VALUE)
     {
      Top3[i]=Top2[i]=Top1[i]=EMPTY_VALUE;
      Bot1[i]=Bot2[i]=Bot3[i]=EMPTY_VALUE;
      Mid[i]=EMPTY_VALUE;
      MidColor[i]=0;
      FillTopHi[i]=FillTopLo[i]=FillBotHi[i]=FillBotLo[i]=EMPTY_VALUE;
      SlopeArr[i]=0;
      MidTrend[i]=(i>0?MidTrend[i-1]:true);
      continue;
     }

   double r1=SmmaAtr[i]*InpFibRatio1*InpWidth;
   double r2=SmmaAtr[i]*InpFibRatio2*InpWidth;
   double r3=SmmaAtr[i]*InpFibRatio3*InpWidth;

   Top1[i]=SmmaPrice[i]+r1;
   Top2[i]=SmmaPrice[i]+r2;
   Top3[i]=SmmaPrice[i]+r3;
   Bot1[i]=SmmaPrice[i]-r1;
   Bot2[i]=SmmaPrice[i]-r2;
   Bot3[i]=SmmaPrice[i]-r3;
   Mid[i]=SmmaPrice[i];

   MidTrend[i]=(i>0 && SmmaPrice[i-1]!=EMPTY_VALUE) ? (SmmaPrice[i]>SmmaPrice[i-1]) : true;
   MidColor[i]=MidTrend[i]?0:1;

   FillTopHi[i]=Top3[i];
   FillTopLo[i]=Top2[i];
   FillBotHi[i]=Bot2[i];
   FillBotLo[i]=Bot3[i];

  }
Explanation:
This section handles cases where the required Smoothed ATR or Smoothed Price values are not yet available. Since the Fibonacci volatility bands depend on both the volatility measurement and the middle reference line, the indicator cannot perform valid calculations until these values have been successfully calculated. The condition checks whether either SmmaAtr[i] or SmmaPrice[i] contains an empty value. This usually happens during the initial calculation period when there is not enough historical data available for the ATR and SMMA calculations.
When valid values are unavailable, the indicator assigns EMPTY_VALUE to all band buffers, including the upper Fibonacci levels, lower Fibonacci levels, middle line, and filling areas. This prevents MetaTrader 5 from drawing incomplete or incorrect values on the chart. The indicator also resets the middle line color state and slope information while preserving the previous trend direction when possible. After clearing the invalid data for the current bar, the continue statement skips the remaining calculations and moves to the next bar until enough data becomes available.
Once the required Smoothed ATR and Smoothed Price values have been calculated, the indicator determines the spacing of the Fibonacci volatility levels from the middle line. The three distance variables, r1, r2, and r3, are generated by multiplying the volatility value by the selected Fibonacci ratios and scaling the result with the width setting. This allows the bands to adapt to market volatility while giving users the ability to increase or decrease their overall width. These calculated distances are then used to position the upper and lower Fibonacci levels around the Smoothed Price line.
Next, the indicator uses them to create the upper and lower volatility bands around the Smoothed Price line. The upper Fibonacci levels are calculated by adding the distances (r1, r2, and r3) to the Smoothed Price value, while the lower Fibonacci levels are calculated by subtracting the same distances from the Smoothed Price value. The Top1, Top2, and Top3 buffers store the three upper Fibonacci band levels, with each level representing a different volatility expansion distance. Similarly, the Bot1, Bot2, and Bot3 buffers store the corresponding lower Fibonacci band levels. The Mid buffer is assigned the Smoothed Price value and acts as the central reference line of the indicator. Together, these calculations create a dynamic channel structure that expands and contracts according to changes in market volatility.
The indicator determines the direction of the Smoothed Price line by comparing the current and previous values, then uses the MidColor buffer to display the middle line with the appropriate color based on its movement. It also prepares the filling buffers that define the upper and lower volatility zones between the outer Fibonacci bands, allowing the indicator to visually highlight these areas on the chart.
Conclusion
By completing this article, we have developed an adaptive Fibonacci volatility band indicator in MQL5 that adjusts its upper and lower boundaries according to changes in market volatility. The focus was on understanding how Smoothed ATR values can be combined with Fibonacci ratios to create dynamic price bands that expand during high-volatility periods and contract during quieter market conditions. Throughout this implementation, we have learned how to:
- calculate volatility using ATR and apply SMMA smoothing techniques;
- generate adaptive Fibonacci bands based on dynamic volatility measurements;
- create a smoothed price line as the central reference point for the bands;
- organize indicator buffers for displaying multiple band levels and filled volatility zones;
- structure MQL5 calculations efficiently for adaptive indicator development.
This project demonstrates how volatility-based analysis can be transformed into a flexible visual tool using MQL5. The concepts covered in this article can be applied to build custom indicators, improve trading analysis, and develop automated systems that adapt more effectively to changing market environments.
Warning: All rights to these materials are reserved by MetaQuotes Ltd. Copying or reprinting of these materials in whole or in part is prohibited.
This article was written by a user of the site and reflects their personal views. MetaQuotes Ltd is not responsible for the accuracy of the information presented, nor for any consequences resulting from the use of the solutions, strategies or recommendations described.

 Python-MetaTrader 5 Strategy Tester (Part 06): MQL5-Style Backtesting for Python Expert Advisors
 Building AI-Powered Trading Systems in MQL5 (Part 10): A Resolution-Independent Vector Icon System
 Features of Experts Advisors
 From Basic to Intermediate: Operator Overloading (IV)

- Free trading apps
- Over 8,000 signals for copying
- Economic news for exploring financial markets
You agree to website policy and terms of use