

Enhancing the MQL5 Portfolio Analyzer Dashboard: Active Mitigation, Data Exports, and AI Integration
 1 015
1 015
 0
0

Introduction and problem statement
You already have an interactive Portfolio Analyzer from Creating an Interactive Portfolio Analyzer Dashboard with CCanvas in MQL5 that reconstructs closed trades, normalizes magic numbers and comments, and displays basic metrics with a correlation matrix. In practice, this is not enough.
When multiple Expert Advisors run together, a single equity curve often hides severe drawdowns in individual strategies; during sudden market stress, the dashboard remains an observer rather than an active protector. Traders also need fast, well-formatted exports for reporting and hypothesis testing, together with automated quantitative audits that do not depend on the MetaTrader 5 WebRequest sandbox.
This article extends CPortfolioAnalyzer to fill those operational gaps. The integrated, measurable goals are:
- Produce a strategy-level Drawdown Timeline Heatmap that logs peak-to-trade-exit drawdowns.
- Run a non-blocking monitoring loop that enforces user thresholds and applies protective actions.
- Export detailed trade history and metrics as CSV and a multi-worksheet Excel XML workbook.
- Provide an asynchronous MQL5-Python AI review pipeline that returns risk-parity weights, correlation alerts, and textual recommendations.
The result is a dashboard that moves from passive visualization to an actionable control center.
Inputs and configuration
The completed Portfolio Analyzer dashboard introduces three new input parameter groups to govern the automated alerts, risk mitigation rules, and AI provider configurations. These parameters are declared in the global scope of the Expert Advisor and are passed to the private member variables of CPortfolioAnalyzer using public setter methods during initialization. This design preserves the modular independence of the class, allowing it to run without direct dependencies on global variables.
To represent the alerts, actions, and API settings, three custom enumerations are defined in the source code:
enum ENUM_ALERT_MODE
  {
   ALERT_MODE_EACH_STRATEGY,      // Each strategy individually
   ALERT_MODE_PORTFOLIO,          // Entire portfolio overall drawdown
   ALERT_MODE_SPECIFIC_STRATEGY   // Specific strategy/strategies (comma-separated list)
  };

enum ENUM_MITIGATION_ACTION
  {
   ACTION_CLOSE_ONLY,       // Close positions/orders only
   ACTION_BLOCK_GV,         // Close positions & set selective Global Variable block
   ACTION_DISABLE_GLOBAL    // Close positions & disable global AutoTrading (Ctrl+E)
  };

enum ENUM_AI_PROVIDER
  {
   AI_PROVIDER_GEMINI,       // Google Gemini
   AI_PROVIDER_OPENAI,       // OpenAI (ChatGPT)
   AI_PROVIDER_CLAUDE,       // Anthropic Claude
   AI_PROVIDER_OPENROUTER,   // OpenRouter (Multi-model hub)
   AI_PROVIDER_CUSTOM        // Custom Endpoint
  };
The input parameters allow the developer to toggle alert notifications, define maximum drawdown limits, and select active risk mitigation rules. The three configuration groups declare the alert scope, mitigation behavior, and AI connection settings:
input group "=== AUTOMATED ALERTS ==="
input bool             InpEnableEmailAlerts    = false;                       // Enable Email Alerts
input bool             InpEnablePushAlerts     = true;                        // Enable Mobile Push Alerts
input double           InpMaxStrategyDrawdown  = 500.0;                       // Max Drawdown Threshold (Cash/Pct)
input bool             InpUsePercentageLimit   = false;                       // Use Percentage limit instead of Cash
input ENUM_ALERT_MODE  InpAlertMode            = ALERT_MODE_EACH_STRATEGY;    // Alert Mode
input string           InpAlertSpecificName    = "";                          // Specific EAs (comma-separated list)

input group "=== RISK MITIGATION ==="
input bool                   InpEnableMitigation = false;                 // Enable Risk Mitigation
input ENUM_MITIGATION_ACTION InpMitigationAction = ACTION_CLOSE_ONLY;     // Mitigation Action

input group "=== AI CONFIGURATION ==="
input ENUM_AI_PROVIDER InpAIApiProvider     = AI_PROVIDER_GEMINI;        // AI Provider
input string           InpAIApiKey          = "";                        // AI API Key (Required)
input string           InpAIModelName       = "gemini-1.5-flash";        // AI Model Name
input string           InpAICustomEndpoint  = "";                        // Custom Endpoint URL (Optional)
input int              InpAITimeoutSeconds  = 20;                        // AI Timeout (Seconds)
Executing Windows API functions and launching external Python scripts requires checking the "Allow DLL imports" safety setting under the Expert Advisor's properties dialog. This permission is required for Windows API calls on charts. It lets the dashboard communicate with external processes and change terminal-wide settings.
Algorithms and data structures
Drawdown Timeline Heatmap calculation
To compute strategy-level drawdowns over time, the Portfolio Analyzer dashboard uses a Drawdown Timeline Heatmap. Standard MetaTrader 5 account reports list only the global account-wide drawdown. When multiple Expert Advisors run simultaneously, their individual drawdowns can offset each other visually, hiding strategy-level risk. The Drawdown Timeline Heatmap resolves this by iterating through the chronological trade history of each active strategy, calculating individual peak equity values, and recording the drawdown at each trade exit timestamp.
The drawdown data is populated inside PopulateStrategyHeatmapData(). The following excerpt highlights the core equity accumulation and peak-tracking loop. For clarity, only the primary calculation is shown; the complete method is available in the attached source file:
   if(match)
     {
      current_equity += m_filteredTrades[i].netProfit;
      if(current_equity > peak)
        {
         peak = current_equity;
        }

      data.trades[idx].exitTime = m_filteredTrades[i].exitTime;
      data.trades[idx].drawdown = current_equity - peak;

      if(data.trades[idx].drawdown < data.maxDd)
        {
         data.maxDd = data.trades[idx].drawdown;
        }
      idx++;
     }
The algorithm reads the chronologically sorted filtered trades and accumulates their net profit on a strategy-by-strategy basis. To ensure financial accuracy, the loop does not rely solely on the raw trade profit. Instead, it sums the profit, swap, and commission values extracted from the SPositionTrade structure. Chronological tracking uses each trade's exit timestamp. This keeps equity-peak updates consistent regardless of the order in which positions were opened.
For each trade exit, the peak equity of the specific strategy is monitored. The drawdown of that strategy at any given trade is calculated as the deficit from its historical peak equity: Drawdown = Current_Equity - Peak_Equity (yielding a negative or zero value). If the current equity rises above the previous peak, the peak is updated. This strategy-level drawdown is recorded in cash terms and then rendered on a timeline transitioning from the panel background (zero drawdown) to dark red (maximum drawdown).
Active Risk Mitigation Engine
The Active Risk Mitigation Engine monitors the drawdown levels calculated by the Portfolio Analyzer dashboard and executes protective actions when a strategy or overall portfolio exceeds user-defined drawdown thresholds. The check cycle is executed inside CheckAlerts(). Depending on InpAlertMode, the Active Risk Mitigation Engine checks whether the drawdown of any strategy, the overall portfolio, or a specific list of strategies exceeds InpMaxStrategyDrawdown.
When a breach is detected, the PerformMitigation() method executes the mitigation rules defined by InpMitigationAction. Three escalating action rules are available:
- ACTION_CLOSE_ONLY: Loops through all active market positions using the CTrade library and closes them immediately, while deleting any pending orders. To prevent array out-of-range errors and index shifting during the mass closure of positions, the algorithm iterates backwards through the open positions pool.
- ACTION_BLOCK_GV: Closes all positions and sets a global variable named after the breached strategy (e.g., "GV_BLOCK_" + block_id, where block_id is the magic number or normalized comment). Trading Expert Advisors can query this variable to block subsequent trade entries. Utilizing terminal Global Variables ensures that the trading block remains persistently stored in the client terminal, surviving accidental platform restarts or Expert Advisor reinitializations until the developer manually removes the restriction.
- ACTION_DISABLE_GLOBAL: Closes all positions and disables the terminal-wide AutoTrading switch in MetaTrader 5. Disabling AutoTrading prevents all Expert Advisors on the terminal from placing orders. This is achieved by posting a WM_COMMAND message to the main terminal window using the Windows API PostMessageW() function with the command ID MT5_CMD_AUTOTRADE.
To demonstrate how the advanced action rules interact with the terminal environment, this excerpt from PerformMitigation() isolates the core mechanism. The full implementation, including comprehensive error checking and position loops, is provided in the attached source file:
//--- 3. Apply mitigation action rules
   if(m_mitigationAction == ACTION_BLOCK_GV)
     {
      string block_id = (magic != -1) ? ::IntegerToString(magic) : commentStr;
      string gv_name = "GV_BLOCK_" + block_id;
      ::GlobalVariableSet(gv_name, 1.0);
      ::Print("Portfolio Analyzer: Set Software Block variable: " + gv_name + " = 1.0");
     }
   else
      if(m_mitigationAction == ACTION_DISABLE_GLOBAL)
        {
         if(::TerminalInfoInteger(TERMINAL_TRADE_ALLOWED))
           {
            long hwnd = ::ChartGetInteger(0, CHART_WINDOW_HANDLE);
            long main_hwnd = ::GetAncestor(hwnd, GA_ROOT);
            if(main_hwnd > 0)
              {
               ::PostMessageW(main_hwnd, WM_COMMAND, MT5_CMD_AUTOTRADE, 0);
               ::Print("Portfolio Analyzer: Sent toggle command to disable global AutoTrading.");
              }
           }
        }
After closing positions and deleting pending orders, the method applies the selected escalation rule.
Data export and Excel XML formatting
To support detailed record exporting, the SPositionTrade structure introduced in the first part is extended with symbol, volume, and trade type fields, which are populated during the deal-reconstruction loop.
The data-export system writes the filtered trade details to a CSV export and a structured Excel XML export. While CSV files contain raw data, they do not support formatting, worksheets, or custom styles. The Excel XML export solves this by writing structured spreadsheet files from scratch. The method ExportExcelXML() creates a standard XML file containing spreadsheet tags and styling namespaces:
   ::FileWriteString(file_handle, "<?xml version=\"1.0\"?>\n");
   ::FileWriteString(file_handle, "<?mso-application progid=\"Excel.Sheet\"?>\n");
   ::FileWriteString(file_handle, "<Workbook xmlns=\"urn:schemas-microsoft-com:office:spreadsheet\"\n");
   ::FileWriteString(file_handle, " xmlns:o=\"urn:schemas-microsoft-com:office:office\"\n");
   ::FileWriteString(file_handle, " xmlns:x=\"urn:schemas-microsoft-com:office:excel\"\n");
   ::FileWriteString(file_handle, " xmlns:ss=\"urn:schemas-microsoft-com:office:spreadsheet\"\n");
   ::FileWriteString(file_handle, " xmlns:html=\"http://www.w3.org/TR/REC-html40\">\n");
The spreadsheet file uses XML tags to define workbook properties, styles, worksheet tables, rows, and cells. The style tags specify fonts, borders, alignments, and custom number formats for different data columns (such as dates, magic numbers, or currency values). To make Excel parse timestamps as dates, the code converts trade exit times to ISO-8601 (YYYY-MM-DDThh:mm:ss). Similarly, percentage metrics like the drawdown ratio are dynamically injected into the XML structure using the dedicated number format tag. This string formatting demonstrates how MQL5 can natively bridge internal terminal data structures with external cross-platform reporting standards without relying on third-party conversion libraries.
The Excel XML export writes a structured spreadsheet consisting of separate worksheets for portfolio metrics and detailed trade records, formatted for presentation directly inside Microsoft Excel. Note that the trade records and metrics shown in all visual examples throughout this article are derived from an illustrative test portfolio to demonstrate the system's capabilities:
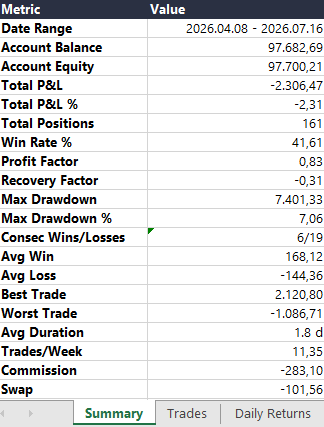
Image 1: Formatted Excel XML spreadsheet.
Writing these files directly in MQL5 is achieved by calling helper methods: WriteXMLRowString() writes text cells, WriteXMLRowNumber() writes floating-point values, and WriteXMLRowInteger() writes integer values. The XML tags must match the exact data columns displayed in the spreadsheet.
Hybrid MQL5-Python architecture
To run quantitative reviews on the portfolio's trade distribution, the Portfolio Analyzer dashboard implements a hybrid MQL5-Python architecture. While MetaTrader 5 provides the WebRequest() function for HTTP communication, it restricts connections strictly to ports 80 and 443, and requires manual URL whitelisting by the user. This strict sandboxing prevents direct communication with local offline AI servers (which utilize custom ports like 11434) and complicates dynamic API routing. The hybrid architecture bypasses these terminal restrictions by exporting the active portfolio's trades to a temporary CSV file via ExportTempCSV(). The system then launches the automatically generated Python script, portfolio_reviewer.py, using the Windows API ShellExecuteW() function. Finally, the dashboard reads the results from a local text file generated by the external process.
To bridge the sandboxed terminal environment with the Windows operating system, the Expert Advisor imports external DLL functions from user32.dll and shell32.dll. These imports declare the function pointers for terminal window search, message posting, and command execution, alongside their required constant flags:
//+------------------------------------------------------------------+
//| DLL Imports for window management and execution                  |
//+------------------------------------------------------------------+
#import "user32.dll"
long  GetAncestor(long hWnd, int gaFlags);
bool PostMessageW(long hWnd, int Msg, int wParam, int lParam);
#import

#import "shell32.dll"
long ShellExecuteW(long hwnd, string lpOperation, string lpFile, string lpParameters, string lpDirectory, int nShowCmd);
#import

#define GA_ROOT           2
#define WM_COMMAND        0x0111
#define MT5_CMD_AUTOTRADE 32851
The generated Python script reads the exported trade data, computes risk-adjusted metrics, and prepares a prompt containing quantitative statistics (such as strategy returns, correlation matrix, and trade counts). It submits this prompt to the configured AI provider and writes the returned Risk Parity weights, correlation alerts, and tabbed textual reviews to portfolio_ai_review.txt. The MQL5 Expert Advisor then detects this file, parses the structured text sections, and loads the data into memory for visual dashboard rendering. Because the script relies exclusively on Python's built-in standard library (os, json, and urllib.request), developers do not need to install any external pip packages.
To support multiple large language models without third-party SDKs, the generated script implements a lightweight request router that dynamically configures the payload, headers, and API endpoints based on the selected ENUM_AI_PROVIDER. For Google Gemini, the script formats a nested contents payload and targets the v1beta/models endpoint with the API key as a URL parameter. For OpenAI and OpenRouter, it submits a messages array to the chat completions endpoint using a Bearer token, adding specific HTTP headers for OpenRouter. For Anthropic Claude, it configures standard Anthropic header keys, including the API version. Finally, the Custom Endpoint option allows routing requests to local offline servers (such as Ollama or LM Studio), enabling private quantitative audits directly from the workstation.
TriggerAIReview() executes the command as follows:
   string sandbox_path = ::TerminalInfoString(TERMINAL_DATA_PATH) + "\\MQL5\\Files\\";
   string script_file = "portfolio_reviewer.py";
   string error_log_file = "portfolio_python_error.log";

//--- Try launching with Windows Python launcher 'py' first, fallback to 'python'
   string params = "/c (py -0 >nul 2>&1 && py \"" + sandbox_path + script_file + "\" || python \"" + sandbox_path + script_file + "\") > \"" + sandbox_path + error_log_file + "\" 2>&1";
   long res = ::ShellExecuteW(0, "open", "cmd.exe", params, NULL, 0);
To trigger Python execution, the Portfolio Analyzer dashboard constructs a command string that attempts to run the script using the Windows Python launcher (py) first, falling back to the standard Python interpreter (python) if the launcher is unavailable. The output is redirected to a temporary error log file to facilitate debugging.
External API requests can take several seconds. Waiting synchronously would freeze the MetaTrader 5 terminal. To prevent this, the architecture implements a non-blocking state machine. TriggerAIReview() launches the script asynchronously via Windows and immediately frees the main thread, allowing the UI to display a responsive "Processing" overlay. The Expert Advisor then uses the OnTimer() event to poll the local directory using FileIsExist(). When the AI review file appears, the dashboard parses it and updates the modal. It then calls FileDelete() to remove the temporary CSV and the Python script.
The underlying mechanism is outlined below, omitting the string-parsing routines to focus solely on the asynchronous CheckAIReviewResponse() logic:
//+------------------------------------------------------------------+
//| Check if the external AI review file has been generated          |
//+------------------------------------------------------------------+
void CPortfolioAnalyzer::CheckAIReviewResponse(void)
  {
   if(!m_aiReviewPending)
      return;

   if(::FileIsExist("portfolio_ai_review.txt"))
     {
      int file_handle = ::FileOpen("portfolio_ai_review.txt", FILE_READ | FILE_TXT | FILE_ANSI);
      if(file_handle != INVALID_HANDLE)
        {
         string file_content = "";
         while(!::FileIsEnding(file_handle))
           {
            file_content += ::FileReadString(file_handle) + "\n";
           }
         ::FileClose(file_handle);

         ::FileDelete("PortfolioReport_Temp.csv");
         ::FileDelete("portfolio_reviewer.py");
         ::FileDelete("portfolio_ai_review.txt");

         m_aiReviewPending = false;
         DrawDashboard();
        }
     }
  }
By relegating the polling process to the OnTimer() event, the Expert Advisor ensures that the terminal remains fully responsive, capable of processing incoming ticks and placing trades while the external Python script executes complex AI reviews in the background.
Integration and visual rendering
Integrating the checking and event loops
To integrate CPortfolioAnalyzer, the global Expert Advisor event handlers delegate operations to the same g_analyzer instance. OnInit() transfers the inputs, loads the initial history, draws the dashboard, and starts the one-second timer. OnTick() performs throttled history checks, OnTrade() checks immediately after a trade event, and OnTimer() evaluates protection thresholds through CheckAlerts(). While an external review is pending, the same timer also polls CheckAIReviewResponse(). OnChartEvent() routes dashboard interaction, while OnDeinit() stops the timer and releases the canvas.
The module route is therefore explicit: reconstructed trades feed the heatmap calculations; CheckAlerts() evaluates the configured drawdown scope and thresholds; PerformMitigation() and PerformPortfolioMitigation() implement the protection actions; the header buttons call the CSV and XML exporters; and the AI button starts the temporary-file workflow polled by OnTimer(). The following global handlers provide this lifecycle:
//+------------------------------------------------------------------+
//| Expert Advisor initialization                                    |
//+------------------------------------------------------------------+
int OnInit()
  {
//--- Configure the analyzer with input parameters
   g_analyzer.SetHideChart(InpHideChart);
   g_analyzer.SetFontName(InpFontName);
   g_analyzer.SetBgColor(InpBgColor);
   g_analyzer.SetPanelColor(InpPanelColor);
   g_analyzer.SetBorderColor(InpBorderColor);
   g_analyzer.SetAccentColor(InpAccentColor);
   g_analyzer.SetProfitColor(InpProfitColor);
   g_analyzer.SetLossColor(InpLossColor);
   g_analyzer.SetTextColor(InpTextColor);
   g_analyzer.SetLabelColor(InpLabelColor);
   g_analyzer.SetTickCheckSec(InpTickCheckSeconds);
   g_analyzer.SetGroupSimilar(InpGroupSimilarComments);

   g_analyzer.SetEnableEmailAlerts(InpEnableEmailAlerts);
   g_analyzer.SetEnablePushAlerts(InpEnablePushAlerts);
   g_analyzer.SetMaxStrategyDrawdown(InpMaxStrategyDrawdown);
   g_analyzer.SetUsePercentageLimit(InpUsePercentageLimit);
   g_analyzer.SetAlertMode(InpAlertMode);
   g_analyzer.SetAlertSpecificName(InpAlertSpecificName);

   g_analyzer.SetEnableMitigation(InpEnableMitigation);
   g_analyzer.SetMitigationAction(InpMitigationAction);

   g_analyzer.SetAIApiProvider(InpAIApiProvider);
   g_analyzer.SetAIApiKey(InpAIApiKey);
   g_analyzer.SetAIModelName(InpAIModelName);
   g_analyzer.SetAICustomEndpoint(InpAICustomEndpoint);
   g_analyzer.SetAITimeoutSeconds(InpAITimeoutSeconds);

//--- Initialize the dashboard
   return g_analyzer.Init();
  }

//+------------------------------------------------------------------+
//| Expert Advisor deinitialization                                  |
//+------------------------------------------------------------------+
void OnDeinit(const int reason)
  {
   g_analyzer.OnDeinit(reason);
  }

//+------------------------------------------------------------------+
//| Expert Advisor tick handler                                      |
//+------------------------------------------------------------------+
void OnTick()
  {
   g_analyzer.OnTick();
  }

//+------------------------------------------------------------------+
//| Expert Advisor trade event handler                               |
//+------------------------------------------------------------------+
void OnTrade()
  {
   g_analyzer.OnTrade();
  }

//+------------------------------------------------------------------+
//| Expert Advisor timer handler                                     |
//+------------------------------------------------------------------+
void OnTimer()
  {
   g_analyzer.OnTimer();
  }

//+------------------------------------------------------------------+
//| Expert Advisor chart event handler                               |
//+------------------------------------------------------------------+
void OnChartEvent(const int id, const long &lparam, const double &dparam,
                  const string &sparam)
  {
   g_analyzer.OnChartEvent(id, lparam, dparam, sparam);
  }
The above reproduces the complete global event handler integration. The full CPortfolioAnalyzer class—containing all drawing, export, alert, and mitigation methods—is included in the attached source file.
Minimal integration steps
- Compile the Portfolio_Analyzer.mq5 source file inside MetaEditor 5.
- Open the terminal settings dialog (Ctrl+O), select the Expert Advisors tab, and enable "Allow DLL imports".
- For the AI review, install Python 3.x and make python.exe available on PATH. No external packages are required because the generated script uses only os, json, and urllib.request from the standard library.
- Attach Portfolio_Analyzer.ex5 to a chart. Set InpHideChart to true for full-screen mode and enter the API key in InpAIApiKey only when using the AI review.
- Use the dashboard tabs to switch among the Equity Curve, Drawdown Timeline Heatmap, and Pearson Correlation Matrix. Use the CSV, XML, and AI buttons to generate the corresponding outputs.
Drawdown Timeline Heatmap rendering
The Drawdown Timeline Heatmap is rendered inside the right panel when the drawdown tab (TAB_INDEX_DRAWDOWN) is active. The method DrawDrawdownChart() draws strategy labels, maximum drawdown levels, current drawdown levels, and individual strategy timelines. Every strategy timeline is represented as a horizontal bar divided into chronological segments. The segment color blends dynamically from the panel background (zero drawdown) to the loss color (maximum drawdown peak) based on the calculated drawdown at each trade exit. Grid divisions and dates are drawn at the bottom axis using m_labelColor to provide chronological context.
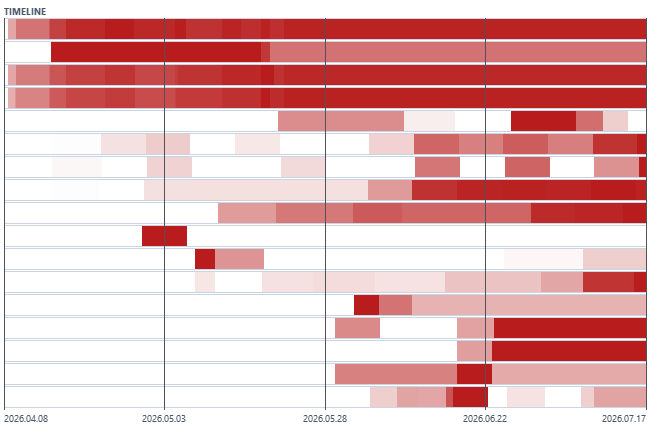
Image 2: Drawdown Timeline Heatmap presenting individual strategy drawdown phases over the selected period.
When active, the heatmap displays multiple strategies, highlighting distinct drawdown clusters. When the number of strategies exceeds the vertical space, the Portfolio Analyzer dashboard enables pagination. The scrolling controls (<- and ->) calculate the active slide window based on the chart height. Users can slide through pages of strategy timelines without visual overlap. Hovering over a strategy row displays detailed drawdown statistics in the panel header.
AI Quant Portfolio Review modal and click prioritization
The AI Quant Portfolio Review modal is rendered as an overlay inside DrawDashboard(). When m_showAiModal is true, the Portfolio Analyzer dashboard draws a translucent background over the entire chart area to focus attention on the modal window. The modal window contains a centered quantitative column on the left and a tabbed textual analysis area on the right. The left column displays optimal Risk Parity weights as horizontal progress bars and lists high strategy correlations. The right column displays the textual reviews returned by the configured AI provider, split into three tabs: SUMMARY, RISK WARNINGS, and ALLOCATION TIPS.
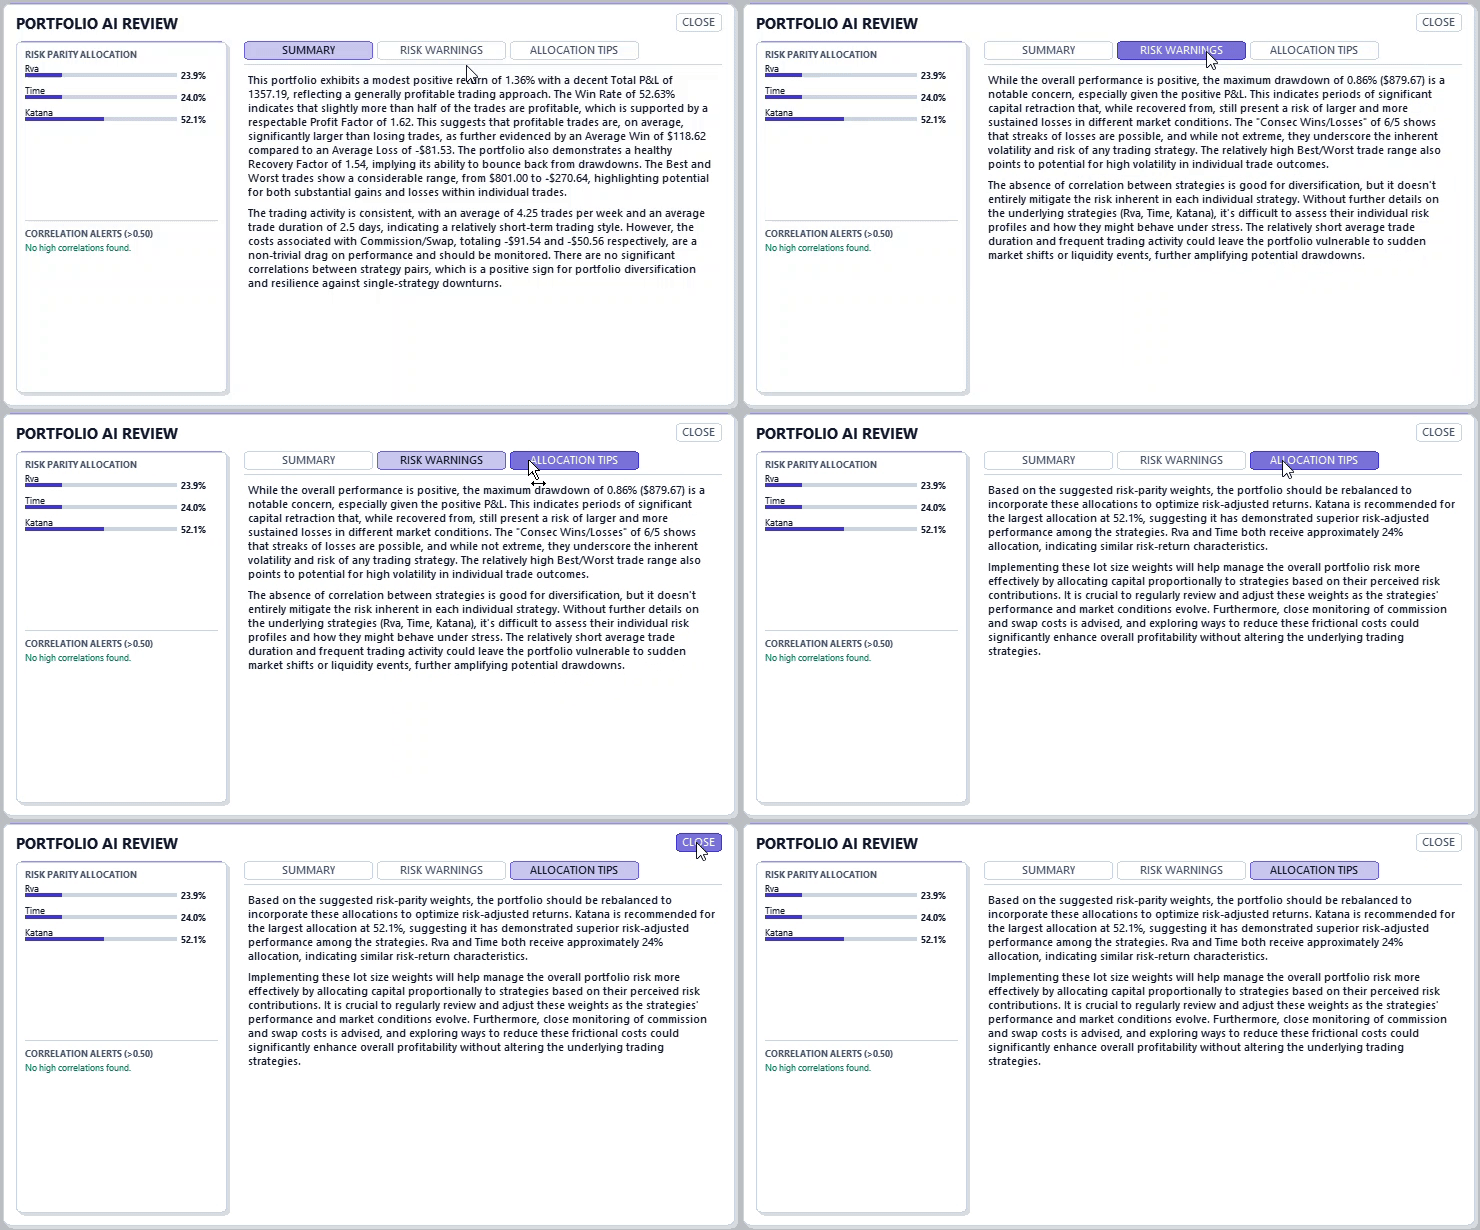
Image 3: AI Quant Portfolio Review modal displaying risk parity allocation, correlation alerts, and tabbed textual analysis.
Because the modal overlay is drawn directly on the main chart, the Portfolio Analyzer dashboard button coordinates overlap with the background controls underneath. To prevent click event conflicts, the coordinate check function GetButtonAt() is updated with an override rule, applying the following prioritized hit-test pattern:
//+------------------------------------------------------------------+
//| Returns the index of the button under the cursor or -1           |
//+------------------------------------------------------------------+
int CPortfolioAnalyzer::GetButtonAt(int mx, int my)
  {
   for(int i = 0; i < ::ArraySize(m_buttons); i++)
     {
      if(mx >= m_buttons[i].x1 && mx <= m_buttons[i].x2 &&
         my >= m_buttons[i].y1 && my <= m_buttons[i].y2)
        {
         if(m_showAiModal)
           {
            if(m_buttons[i].id >= BTN_ID_AI_CLOSE && m_buttons[i].id <= BTN_ID_AI_TAB_REC)
              {
               return i;
              }
           }
         else
           {
            if(m_buttons[i].id >= BTN_ID_AI_CLOSE && m_buttons[i].id <= BTN_ID_AI_TAB_REC)
              {
               continue;
              }
            return i;
           }
        }
     }
   return -1;
  }
When the modal is open (m_showAiModal is true), the function filters out all buttons whose identifiers do not belong to the modal window (BTN_ID_AI_CLOSE to BTN_ID_AI_TAB_REC), allowing only modal controls to respond to mouse clicks. When the modal is closed, these IDs are ignored and only background Portfolio Analyzer dashboard buttons are checked.
Limitations and safeguards
The completed Portfolio Analyzer dashboard operates with specific constraints that developers must understand before deployment. The Active Risk Mitigation Engine relies on the terminal's global AutoTrading setting to block automated order entry terminal-wide. While effective, this action disables trading for all Expert Advisors running on the terminal, not just the one that breached the drawdown limit. If selective mitigation is required, developers should use the global variable method (ACTION_BLOCK_GV) and update their trading Expert Advisors to check for these variables before opening positions.
The hybrid MQL5-Python architecture relies on Windows API DLL imports (user32.dll and shell32.dll), which limits the dashboard's execution to Windows environments. The Portfolio Analyzer dashboard cannot run on Linux, macOS, or terminal VPS servers where DLL execution is restricted. Spawning external processes via ShellExecuteW() introduces a small latency (usually 1-3 seconds depending on local system load) to load the Python environment, retrieve the AI API response, and generate the output file. The Portfolio Analyzer dashboard is designed to run this analysis asynchronously, preventing the Expert Advisor chart thread from blocking while waiting for Python execution. Users should ensure their API keys are stored securely inside the inputs block and that DLL imports are enabled in MetaTrader 5 settings.
Conclusion
We converted the Portfolio Analyzer from a historical visual overlay into a reproducible monitoring, protection, and reporting control panel. The single Portfolio_Analyzer.mq5 Expert Advisor now delivers four integrated capabilities: a Drawdown Timeline Heatmap for per-strategy chronological drawdowns, an Active Risk Mitigation Engine that can close positions, set Global Variable blocks, or toggle terminal-wide AutoTrading, native CSV and formatted multi-worksheet Excel XML exports, and a hybrid MQL5-Python AI review that runs asynchronously and returns quantitative audits to the chart modal.
After compiling and running the Expert Advisor:
- Visual outputs: Equity curve, per-strategy heatmap, Pearson matrix, and AI review modal.
- File outputs: Timestamped CSV, formatted multi-worksheet Excel XML, and portfolio_ai_review.txt generated through PortfolioReport_Temp.csv and portfolio_reviewer.py.
- Automated behaviors: OnTick() and OnTrade() refresh the trade history, OnTimer() checks drawdown thresholds and polls the asynchronous AI state, and the mitigation engine closes positions or deletes orders before applying the selected protection rule.
Important constraints and operational notes:
- Requires Windows with "Allow DLL imports" enabled because user32.dll and shell32.dll are used.
- Python 3.x must be available on PATH for the AI reviewer; the generated script uses only the standard library.
- ACTION_DISABLE_GLOBAL affects all Expert Advisors in the terminal. ACTION_BLOCK_GV provides selective blocking only when the trading Expert Advisors check the generated flags.
This modular framework provides a deployable, production-ready toolset for multi-strategy portfolio monitoring, defensive automation, formatted reporting, and asynchronous AI-assisted audits directly inside MetaTrader 5.
Warning: All rights to these materials are reserved by MetaQuotes Ltd. Copying or reprinting of these materials in whole or in part is prohibited.
This article was written by a user of the site and reflects their personal views. MetaQuotes Ltd is not responsible for the accuracy of the information presented, nor for any consequences resulting from the use of the solutions, strategies or recommendations described.

 Building a Dynamic ATR-Based Trend Channel Indicator in MQL5
 CSV Data Analysis (Part 8): Building an SQLite Strategy Registry from Accumulated CSV Exports
 Building a Crosshair Volume Profile Indicator in MQL5
 Market Heat Map Indicator Based on Prime-Number Density

- Free trading apps
- Over 8,000 signals for copying
- Economic news for exploring financial markets
You agree to website policy and terms of use