

Building a Swing-Based Volume Profile Indicator in MQL5
 247
247
 0
0

Introduction
MetaTrader 5 includes a Market Profile indicator (Navigator → Indicators → Free Indicators → MarketProfile). However, it does not organize volume distribution by individual market swings. Traders who want to analyze volume within specific high-to-low and low-to-high movements therefore need a swing-based approach. In this article, we develop a Swing-Based Volume Profile indicator using OHLC data and tick volume. It identifies confirmed swing points, builds high-to-low and low-to-high legs, splits each leg into ATR(200)-adaptive price bins, and assigns each bar's tick volume to a bin based on the closing price.
The indicator then displays the resulting volume profile and identifies the highest-volume bin as the Point of Control (POC). The indicator is designed to help traders study volume concentration within individual market swings and compare it with price structure. It uses platform-provided tick volume and does not represent exchange-level order-flow data.
Project Overview and Implementation Plan
Before implementing the indicator in MQL5, it is important to understand its structure and development process. In this section, we will outline the steps for detecting swing points, defining high-to-low and low-to-high swing legs, distributing tick volume across price bins, identifying the Point of Control, and displaying the resulting volume profiles.
What We Are Building
In this project, we will build a Swing-Based Volume Profile indicator for MetaTrader 5 that identifies confirmed market swings, draws a ZigZag structure between them, and displays tick volume distribution within each completed swing leg. The indicator will use a configurable swing length to determine potential swing highs and lows before confirming them.
A swing point will not be drawn immediately when an extreme is detected. For example, with a swing length of 5, if a bar forms the highest high within the selected five-bar window, it becomes a potential swing high. The indicator then waits for the next bar after the candidate extreme. If that bar fails to make a higher high, the previous bar is confirmed as the swing high. The same process applies to a swing low: when a bar forms the lowest low within the selected window and the next bar after the candidate extreme fails to make a lower low, that bar is confirmed as the swing low.
After confirmed swing points are available, the indicator tracks the direction of the market. A direction change completes either a high-to-low or low-to-high swing leg. The two confirmed swing points are then connected with a ZigZag line, while the price range between them is used to construct the volume profile.
For each completed leg, the indicator uses half of ATR(200) to determine the initial price-bin size and distributes the tick volume of the bars within the leg across those bins according to their closing prices. The bin with the highest accumulated tick volume becomes the Point of Control (POC), while the remaining bins are displayed as profile bars with widths proportional to their relative volume. This allows the volume distribution of each high-to-low and low-to-high movement to be analyzed alongside its ZigZag structure.
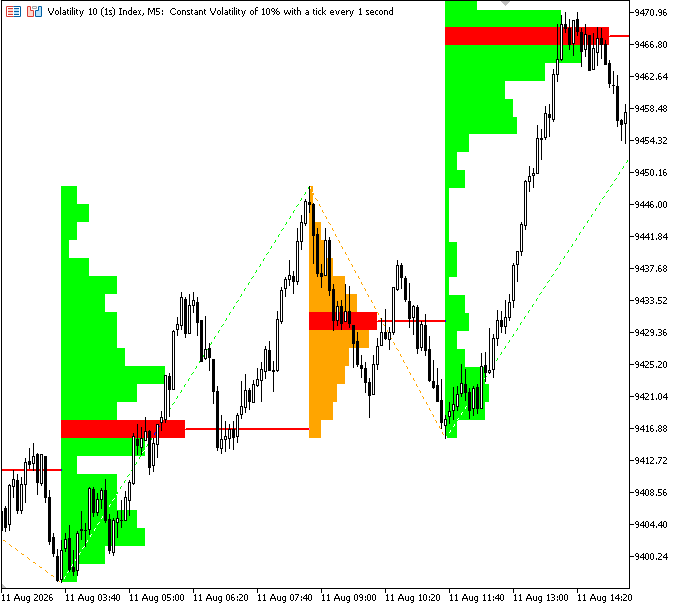
Figure 1. Swing Profile
Implementation Plan
In this section, we will outline the development plan that will be followed in MQL5 before moving into the actual implementation.
1. Detecting and Confirming Swing Points
Before constructing the volume profile, the indicator first identifies the swing points that will define each market movement. These points form the basis for the high-to-low and low-to-high swing legs analyzed later in the process. A newly detected high or low is not immediately treated as a confirmed swing. Instead, the indicator evaluates its position relative to a configurable number of previous bars and waits for subsequent price action to confirm that the extreme has held.
In this step, the indicator:
- declares inputs for swing detection, lookback range, swing colors, ZigZag visibility, volume-profile visibility, and Point of Control display settings;
- checks that sufficient historical data is available for swing analysis;
- uses the selected swing length to evaluate recent price extremes;
- identifies potential swing highs and swing lows from the highest high and lowest low within the selected range;
- confirms a swing high when the next bar after the candidate extreme fails to exceed the potential high;
- confirms a swing low when the next bar after the candidate extreme fails to break below the potential low;
- stores the confirmed swing points for subsequent leg construction;
2. Managing Chart Objects and Drawing the ZigZag Structure
After confirming the swing points and detecting a direction change, the indicator creates the chart objects needed to display the completed swing leg.
In this step, the indicator:
- creates a function to create trend lines between two price points;
- creates a function to delete chart objects using the indicator's object prefix;
- removes the indicator's chart objects during deinitialization;
- detects a change in swing direction and confirms the completion of a new swing leg;
- assigns a unique identifier and color to each completed leg;
- determines the earlier and later swing points;
- connects the confirmed swing high and swing low with a dotted ZigZag line when enabled;
- redraws the chart when a new ZigZag object is created.
3. Defining the Volume Profile Bins
After a swing leg has been completed, the indicator determines the price range that will contain the volume profile and divides that range into multiple price bins. The bin size is adjusted according to market volatility using ATR(200).
In this step, the indicator:
- calculates the lower and upper price boundaries of the swing leg;
- calculates the total price range between the confirmed swing points;
- determines the initial bin size using half of the ATR(200) value;
- calculates the number of bins required to cover the swing range;
- validates that the bin size and swing range are suitable for creating the profile;
- recalculates the bin step so the bins fit the complete swing range;
4. Distributing Tick Volume and Identifying the POC
After defining the profile bins, the indicator distributes the tick volume from each bar within the completed swing leg into the appropriate price bin. It then compares the accumulated volume across all bins to identify the bin with the highest volume.
In this step, the indicator:
- loops through all bars between the two confirmed swing points;
- obtains each bar's closing price and tick volume;
- determines the appropriate price bin for each bar based on its closing price;
- accumulates the bar's tick volume into the selected bin;
- searches all bins to determine the maximum accumulated volume;
- calculates each bin's volume ratio relative to the highest-volume bin;
- uses the volume ratio to determine the width of each profile bar;
- identifies the highest-volume bin as the Point of Control (POC);
- calculates the midpoint price of the POC bin;
- creates a horizontal POC line from the profile edge or swing-leg starting point to the end of the swing leg;
- applies the configured POC color and line width to the POC line.
5. Drawing the Volume Profile
After calculating the volume distribution and identifying the POC, the indicator displays the profile directly on the chart using rectangle objects. Each rectangle represents a price bin, with its width determined by the relative tick volume accumulated in that bin.
In this step, the indicator:
- creates a function to draw filled rectangles for the profile bins;
- assigns each bin a color based on its volume ratio and POC status;
- draws each profile bin only when the volume-profile display is enabled;
- uses the calculated volume ratio to determine the horizontal width of each bin;
- highlights the Point of Control using the configured POC color;
- redraws the chart when new profile objects are created.
Implementation in MQL5
With the project requirements and implementation strategy clearly defined, we can proceed to the implementation phase. The Swing-Based Volume Profile indicator will be developed in stages, with each section of the design translated into functional code and its underlying logic explained throughout the process.
Detecting and Confirming Swing Points
This step establishes the conditions for identifying completed swing legs. First, we declare the inputs, check for sufficient bars, and identify confirmed swing highs and lows for high-to-low and low-to-high legs.
Example:
#property indicator_chart_window
#property indicator_buffers 0
#property indicator_plots   0

//--- INPUTS
input int                  InpSwingLen     = 50;           // Swing Length
input int                  InpLookback     = 1000;         // Lookback Bars (0 = all history)
input color                InpColorUp      = clrLime;      // Swing Up Color
input color                InpColorDown    = clrOrange;    // Swing Down Color
input bool                 InpShowZigZag   = true;         // Show ZigZag
input bool                 InpShowProfile  = true;         // Show Profile
input bool                 InpShowPOC      = true;         // Show POC
input int                  InpPOCWidth     = 2;            // POC Width
input color                InpPOCColor     = clrRed;       // P0C Color

//--- atr handle
int g_atrHandle;                         // handle for ATR(200), used to size volume-profile bins

//+------------------------------------------------------------------+
//| Custom indicator initialization function                         |
//+------------------------------------------------------------------+
int OnInit()
  {
//--- indicator buffers mapping
//--- ATR(200) drives the profile's bin size (see priceBinSize in OnCalculate)
   g_atrHandle = iATR(_Symbol, _Period, 200);
   if(g_atrHandle == INVALID_HANDLE)
     {
      Print("SwingProfile: failed to create ATR(200) handle");
      return(INIT_FAILED);
     }

   IndicatorSetString(INDICATOR_SHORTNAME, "Swing Profile");

//---
   return(INIT_SUCCEEDED);
  }

//+------------------------------------------------------------------+
//| Custom indicator deinitialization function                       |
//+------------------------------------------------------------------+
void OnDeinit(const int reason)
  {

  }

//+------------------------------------------------------------------+
//| Custom indicator iteration function                              |
//+------------------------------------------------------------------+
int OnCalculate(const int rates_total,
                const int prev_calculated,
                const datetime &time[],
                const double &open[],
                const double &high[],
                const double &low[],
                const double &close[],
                const long &tick_volume[],
                const long &volume[],
                const int &spread[])
  {
//--- need enough bars for swing length + ATR(200) warm-up
   if(rates_total < InpSwingLen + 205)
      return 0;

//--- ATR(200) series, aligned to series indexing (0 = most recent bar)
   double atrArr[];
   ArraySetAsSeries(atrArr, true);
   if(CopyBuffer(g_atrHandle, 0, 0, rates_total, atrArr) <= 0)
      return prev_calculated;

//--- return value of prev_calculated for next call
   return(rates_total);
  }
//+------------------------------------------------------------------+
Explanation:
The input section defines parameters for swing detection and chart display. InpSwingLen sets the evaluation window, and InpLookback limits the processed history. Separate inputs control colors and the visibility of ZigZag, the profile, and the POC. Before processing the data, the indicator checks that enough historical bars are available for the selected swing length and the ATR(200) warm-up period. It then retrieves the ATR values using CopyBuffer() and stores them in an array configured as a time series. This ensures that sufficient swing and volatility data is available before the profile calculations begin. With inputs set and ATR data loaded, the indicator loops through bars to confirm swing highs and swing lows. These points form the completed swing legs.
Example:
//--- calculation state
int         g_lastClosed  = -1;          // index of the last fully processed (closed) bar

//--- STRUCTS & GLOBALS
struct SwingPoint
  {
   double            price;              // price level of the swing point
   int               index;              // bar index where the swing point occurred
  };

//--- active swing point tracking
SwingPoint highSwing;                    // most recently confirmed swing high
SwingPoint lowSwing;                     // most recently confirmed swing low

//+------------------------------------------------------------------+
//| Highest high over the trailing 'len' bars ending at idx           |
//+------------------------------------------------------------------+
double HighestOf(const double &h[], int idx, int len)
  {
//--- clamp the window start so it never reads before index 0
   int start = MathMax(0, idx - len + 1);
   double m = h[start];
//--- scan the window and keep the maximum high
   for(int j = start + 1; j <= idx; j++)
      if(h[j] > m)
         m = h[j];
   return m;
  }

//+------------------------------------------------------------------+
//| Lowest low over the trailing 'len' bars ending at idx             |
//+------------------------------------------------------------------+
double LowestOf(const double &l[], int idx, int len)
  {
//--- clamp the window start so it never reads before index 0
   int start = MathMax(0, idx - len + 1);
   double m = l[start];
//--- scan the window and keep the minimum low
   for(int j = start + 1; j <= idx; j++)
      if(l[j] < m)
         m = l[j];
   return m;
  }
//--- ATR(200) series, aligned to series indexing (0 = most recent bar)
double atrArr[];
ArraySetAsSeries(atrArr, true);
if(CopyBuffer(g_atrHandle, 0, 0, rates_total, atrArr) <= 0)
   return prev_calculated;

int calcStart;
if(prev_calculated == 0)
  {

   g_lastClosed = -1;

   highSwing.index = -1;
   lowSwing.index  = -1;

//--- respect InpLookback, but never start before the ATR/swing warm-up point
   calcStart = (InpLookback > 0) ? MathMax(0, rates_total - InpLookback) : 0;
   calcStart = MathMax(calcStart, 205); // ensure ATR(200) + swing warm-up is available

  }
else
  {
//--- incremental update: resume right after the last bar we fully processed
   calcStart = g_lastClosed + 1;
  }

//--- process fully closed bars permanently (stop at rates total - 2 to process only fully closed bars (excluding the current bar))
for(int i = calcStart; i <= rates_total - 2; i++)
  {
//--- rolling extremes over the trailing InpSwingLen bars, used to detect confirmed pivots
   double   highestSwingHigh = HighestOf(high, i, InpSwingLen);
   double   lowestSwingLow   = LowestOf(low, i, InpSwingLen);

   if(i > 0)
     {
      //--- same rolling extremes but one bar earlier, used to confirm bar i-1 as the pivot
      double   highestPrev = HighestOf(high, i - 1, InpSwingLen);
      double   lowestPrev  = LowestOf(low, i - 1, InpSwingLen);

      //--- bar i-1 was the highest in its own window, and bar i failed to exceed it -> confirmed swing high
      if(high[i - 1] == highestPrev && high[i] < highestSwingHigh)
        {
         highSwing.index = i - 1;
         highSwing.price = high[i - 1];

        }
      //--- bar i-1 was the lowest in its own window, and bar i failed to undercut it -> confirmed swing low
      if(low[i - 1] == lowestPrev && low[i] > lowestSwingLow)
        {
         lowSwing.index = i - 1;
         lowSwing.price = low[i - 1];
        }
     }

  }

//--- mark the last bar we fully processed, so the next call resumes from here
g_lastClosed = rates_total - 2;
Explanation:
The calculation state uses g_lastClosed to store the index of the last fully processed candle, while the SwingPoint structure stores both the price and bar index of a confirmed swing. The highSwing and lowSwing variables keep the most recently confirmed swing high and swing low. This is necessary because the indicator needs to remember these points so they can later be connected to form a completed high-to-low or low-to-high swing leg.
The HighestOf() and LowestOf() functions determine the highest high and lowest low within a specified trailing window. HighestOf() scans the selected bars and returns the highest high, while LowestOf() returns the lowest low. These functions are needed because the indicator uses rolling price extremes to determine whether a bar qualifies as a potential swing point according to the selected swing length. The calculation start point is determined based on whether this is the first calculation or an incremental update. During the first calculation, the swing states are reset, and calcStart is positioned according to InpLookback, while ensuring processing does not begin before the 205-bar warm-up period.
On subsequent calculations, calcStart resumes from the bar after g_lastClosed. This prevents unnecessary recalculation of already processed historical bars while ensuring the required ATR and swing data is available. The indicator then loops through the fully closed bars, stopping at rates_total - 2 so the currently forming candle is excluded. For each bar, the rolling highest high and lowest low are calculated, along with the corresponding extremes one bar earlier.
A swing high is confirmed when the previous bar was the highest within its window, but the current bar fails to make a higher high. Similarly, a swing low is confirmed when the previous bar was the lowest within its window but the current bar fails to make a lower low. The confirmation step is important because it prevents the indicator from treating an unconfirmed extreme as a completed swing. Once confirmed, the swing price and index are stored for later leg construction. Finally, g_lastClosed records the last processed bar so the next calculation can continue from the correct position.
Managing Chart Objects and Drawing the ZigZag Structure
Next, create the chart objects needed to connect confirmed swing points and display the ZigZag swing legs.
Example:
//--- obj prefix
string PFX = "SP_";                      // object name prefix
int    g_legId       = 0;                // increments each time a new swing leg (high-to-low or low-to-high) is confirmed

//--- direction tracking
bool isDown;                             // current swing direction: true = last confirmed extreme was a high (trend now down)
bool prevDown;                           // isDown value from the previous bar, used to detect a direction flip

//--- current leg bar range
int  prevIdx;                            // bar index of the earlier swing point in the current leg
int  lastIdx;                            // bar index of the later swing point in the current leg

//+------------------------------------------------------------------+
//| Create a trendline                                               |
//+------------------------------------------------------------------+
bool DrawTrend(const string name,
               datetime x1t, double x1,
               datetime x2t, double x2,
               color mainColor, ENUM_LINE_STYLE  lineStyle,
               bool obj_propback, int width)
  {
   bool created = false;

//--- Create object only if it does not exist (avoids re-creating/flickering on every tick)
   if(ObjectFind(0, name) < 0)
     {
      ObjectCreate(0, name, OBJ_TREND, 0, x1t, x1, x2t, x2);
      ObjectSetInteger(0, name, OBJPROP_COLOR, mainColor);
      ObjectSetInteger(0, name, OBJPROP_STYLE, lineStyle);
      ObjectSetInteger(0, name, OBJPROP_RAY_RIGHT, false);   // don't extend the line to the right edge of the chart
      ObjectSetInteger(0, name, OBJPROP_BACK, obj_propback);
      ObjectSetInteger(0, name, OBJPROP_WIDTH, width);

      created = true;
     }

   return created;
  }

//+-------------------------------------------------------------------+
//| Delete every chart object whose name starts with the given prefix |
//+-------------------------------------------------------------------+
void DeleteByPrefix(string prefix)
  {
   ObjectsDeleteAll(0, prefix);
  }

//+------------------------------------------------------------------+
//| Custom indicator deinitialization function                       |
//+------------------------------------------------------------------+
void OnDeinit(const int reason)
  {

//--- clean up all drawn objects and release the ATR handle
   ObjectsDeleteAll(0, PFX);
   if(g_atrHandle != INVALID_HANDLE)
      IndicatorRelease(g_atrHandle);
  }
int calcStart;
if(prev_calculated == 0)
  {
//--- first run (or full recalculation): reset all state and wipe old drawings
   DeleteByPrefix(PFX);
   g_legId      = 0;
   g_lastClosed = -1;

   highSwing.index = -1;
   lowSwing.index  = -1;

//--- respect InpLookback, but never start before the ATR/swing warm-up point
   calcStart = (InpLookback > 0) ? MathMax(0, rates_total - InpLookback) : 0;
   calcStart = MathMax(calcStart, 205); // ensure ATR(200) + swing warm-up is available
  }
else
  {
//--- incremental update: resume right after the last bar we fully processed
   calcStart = g_lastClosed + 1;
  }

bool need_redraw = false; // tracks whether any new object was drawn this pass

//--- process fully closed bars permanently (stop at rates total - 2 to process only fully closed bars (excluding the current bar))
for(int i = calcStart; i <= rates_total - 2; i++)
  {
//--- rolling extremes over the trailing InpSwingLen bars, used to detect confirmed pivots
   double   highestSwingHigh = HighestOf(high, i, InpSwingLen);
   double   lowestSwingLow   = LowestOf(low, i, InpSwingLen);

   if(i > 0)
     {
      //--- same rolling extremes but one bar earlier, used to confirm bar i-1 as the pivot
      double   highestPrev = HighestOf(high, i - 1, InpSwingLen);
      double   lowestPrev  = LowestOf(low, i - 1, InpSwingLen);

      //--- bar i-1 was the highest in its own window, and bar i failed to exceed it -> confirmed swing high
      if(high[i - 1] == highestPrev && high[i] < highestSwingHigh)
        {
         highSwing.index = i - 1;
         highSwing.price = high[i - 1];

        }
      //--- bar i-1 was the lowest in its own window, and bar i failed to undercut it -> confirmed swing low
      if(low[i - 1] == lowestPrev && low[i] > lowestSwingLow)
        {
         lowSwing.index = i - 1;
         lowSwing.price = low[i - 1];
        }
     }

//--- flip direction flag whenever the current bar sets a fresh rolling extreme
   if(high[i] == highestSwingHigh)
      isDown = true;    // fresh high -> we're now looking for a swing down leg
   if(low[i]  == lowestSwingLow)
      isDown = false;   // fresh low -> we're now looking for a swing up leg
//--- direction just flipped and we have both a confirmed high and low -> a new leg is complete
   if(i > 0 && isDown != prevDown && highSwing.index >= 0 && lowSwing.index >= 0)
     {
      g_legId++;

      //--- select swing color
      color mainColor = isDown ? InpColorDown : InpColorUp;

      //--- create unique object prefix for this leg
      string objPfx = PFX + "L" + IntegerToString(g_legId) + "_";

      //--- determine the two swing points (earlier index = prevIdx, later = lastIdx)
      prevIdx = MathMin(highSwing.index, lowSwing.index);
      lastIdx = MathMax(highSwing.index, lowSwing.index);

      if(prevIdx > 0 && lastIdx > 0 && lastIdx >= prevIdx)
        {
         //-- ZIGZAG: connect the two swing points with a dotted line
         if(InpShowZigZag)
           {
            string zz = objPfx + "ZZ";

            if(DrawTrend(zz, time[highSwing.index], highSwing.price, time[lowSwing.index], lowSwing.price, mainColor, STYLE_DOT, true,0))
              {
               need_redraw = true;
              }
           }
        }
     }
   prevDown = isDown;
  }

//--- mark the last bar we fully processed, so the next call resumes from here
g_lastClosed = rates_total - 2;

//--- Redraw the chart only if at least one new object was created
if(need_redraw)
   ChartRedraw(0);
Output:
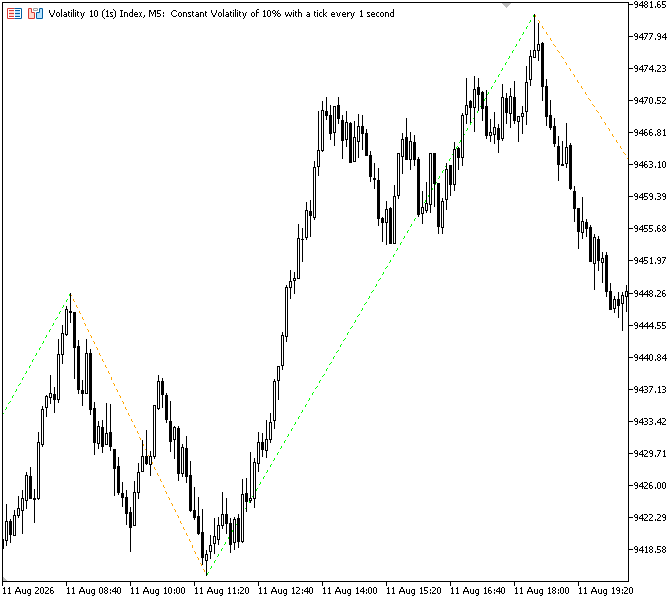
Figure 2. ZigZag Line
Explanation:
These variables provide the state information required to track and visualize each completed swing leg. PFX is used as the common prefix for chart objects, while g_legId uniquely identifies every completed high-to-low and low-to-high leg. The isDown variable represents the current direction, whereas prevDown retains the previous direction so a new leg can be detected when the direction changes. prevIdx and lastIdx identify the earlier and later swing-point bars and are used to determine the range of the completed leg.
The DrawTrend() function creates a trendline object between two specified time and price coordinates and applies its color, style, width, and background settings. It first checks whether the object already exists to avoid duplicate objects and unnecessary redrawing. The DeleteByPrefix() function removes all chart objects whose names begin with the specified prefix, allowing the indicator to clean up only its own objects.
During OnDeinit(), ObjectsDeleteAll() removes all objects belonging to the indicator using PFX, while IndicatorRelease() releases the ATR handle. This ensures that the chart is cleaned when the indicator is removed or reinitialized and that the ATR resource is properly released. When prev_calculated is zero, DeleteByPrefix() is called to remove old drawings before a full recalculation begins. During swing processing, isDown changes to true when a fresh rolling high is detected and to false when a fresh rolling low is detected.
The indicator compares isDown with prevDown to determine whether the direction has changed. When a direction change occurs and both a confirmed swing high and swing low exist, g_legId is increased, the appropriate swing color is selected, and a unique object name is created. prevIdx and lastIdx then identify the earlier and later swing points, while DrawTrend() connects the two confirmed points with a dotted ZigZag line when enabled. Finally, prevDown is updated to the current direction so the next bar can be checked for another direction change.
Defining the Volume Profile Bins
Next, define the price range and bin structure required to distribute tick volume across the completed swing leg.
Example:
//-- ZIGZAG: connect the two swing points with a dotted line
if(InpShowZigZag)
  {
   string zz = objPfx + "ZZ";

   if(DrawTrend(zz, time[highSwing.index], highSwing.price, time[lowSwing.index], lowSwing.price, mainColor, STYLE_DOT, true,0))
     {
      need_redraw = true;
     }
  }

//--- leg price range, used as the vertical extent of the volume profile
double swingBottom  = MathMin(highSwing.price, lowSwing.price);
double swingTop     = MathMax(highSwing.price, lowSwing.price);
double range        = MathAbs(highSwing.price - lowSwing.price);

//--- bin size scales with volatility: half of ATR(200) at the leg's completion bar
double priceBinSize = atrArr[rates_total - 1 - i] * 0.5;
int binCount = (int)(range / priceBinSize);

if(priceBinSize > 0 && range > 0 && binCount >= 1)
  {
//--- recompute binStep so binCount bins fit the range exactly (avoids leftover fractional bin)
   double binStep = range / binCount;
  }
Explanation:
The indicator first determines the complete price range covered by the confirmed swing leg. swingBottom identifies the lower price between the confirmed swing high and swing low, while swingTop identifies the higher price. The range variable then calculates the absolute difference between the two swing prices. For example, if a high-to-low swing moves from 1.1200 to 1.1000, swingTop is 1.1200, swingBottom is 1.1000, and the total range is 0.0200. These values define the upper and lower boundaries within which the volume profile will be constructed. The swingTop value represents the highest boundary of the profile, while swingBottom represents the lowest boundary. The indicator then determines the initial size of each volume-profile bin using half of the ATR(200) at the bar where the swing leg is completed.
ATR measures the market's recent volatility, so using it to determine the bin size allows the profile resolution to adapt to the instrument's current price movement. For example, if the ATR(200) value is 0.0100, half of it produces an initial bin size of 0.0050. The binCount variable then divides the complete swing range by this bin size to estimate how many price bins are needed. Therefore, a larger ATR produces larger bins and fewer profile levels, while a smaller ATR produces smaller bins and potentially more detailed profile levels.
The indicator then checks that the calculated priceBinSize and range are greater than zero and that at least one bin can be created. Once these conditions are satisfied, binStep is calculated by dividing the complete swing range by the number of bins. Although the initial bin size is based on ATR, binStep becomes the actual width of each bin. The recalculated binStep makes the selected number of bins fit precisely within the confirmed swing range. For instance, with a 0.0200 swing range and four bins, each bin receives a 0.0050 price interval. As a result, the bins collectively extend from swingBottom all the way to swingTop without leaving a gap between the profile boundaries.
Distributing Tick Volume and Identifying the POC
Next, distribute tick volume across the defined price bins and identify the highest-volume bin as the Point of Control (POC).
Example:
//--- bin size scales with volatility: half of ATR(200) at the leg's completion bar
double priceBinSize = atrArr[rates_total - 1 - i] * 0.5;
int binCount = (int)(range / priceBinSize);

if(priceBinSize > 0 && range > 0 && binCount >= 1)
  {
//--- recompute binStep so binCount bins fit the range exactly (avoids leftover fractional bin)
   double binStep = range / binCount;

   double volBins[];   // buyBins/sellBins reserved but not yet populated
   ArrayResize(volBins, binCount);

//--- accumulate volume per bin across the leg's bar range
   for(int i = prevIdx; i <= lastIdx; i++)
     {
      double cClose = close[i];
      double cOpen  = open[i];
      double cVol   = (double)tick_volume[i];

      //--- assign this bar's volume to whichever bin its close price falls into
      for(int k = 0; k < binCount; k++)
        {
         double binMid = swingBottom + (k * binStep) + (binStep / 2.0);
         if(MathAbs(binMid - cClose) < binStep)
           {
            volBins[k] += cVol;
           }
        }
     }

//--- find the bin with the most volume (used to normalize bar widths and locate the POC)
   double maxVol = 0.0;

   for(int k = 0; k < binCount; k++)
     {
      if(volBins[k] > maxVol)
         maxVol = volBins[k];
     }

   if(maxVol > 0)
     {
      for(int k = 0; k < binCount; k++)
        {
         double binLow  = swingBottom + (k * binStep);
         double binHigh = binLow + binStep;
         double ratio    = volBins[k] / maxVol;   // 0..1, this bin's volume relative to the busiest bin
         //--- histogram bar width is proportional to ratio, capped at half the leg's bar span
         int    width    = (int)(ratio * ((lastIdx - prevIdx) / 2.0));

         int leftIdx  = prevIdx + width;   // how far the bin's bar extends to the right
         int rightIdx = prevIdx;           // bin bars all anchor at the leg's start
         bool isPOCBin = (ratio >= 0.999999 && InpShowPOC);   // this is the point-of-control (highest volume) bin

         //--- POC line at the highest-volume bin
         if(isPOCBin)
           {
            string poc = objPfx + "POC";
            double pocPrice = (binLow + binHigh) / 2.0;
            //--- start the POC line at the edge of the profile bars if shown, otherwise at the leg start
            int pocLeft = InpShowProfile ? prevIdx + width : prevIdx;

            if(DrawTrend(poc, time[pocLeft], pocPrice, time[lastIdx], pocPrice,InpPOCColor,STYLE_SOLID,true,InpPOCWidth))
              {
               need_redraw = true;
              }
           }
        }
Output:
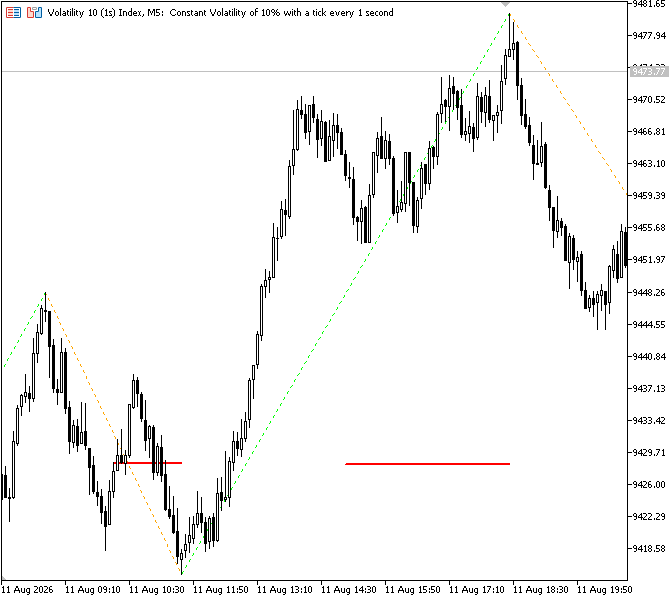
Figure 3. POC Line
Explanation:
The indicator first creates the volBins array and sizes it according to the calculated number of price bins. It then loops through every bar between prevIdx and lastIdx, representing the completed swing leg, and obtains the bar's closing price and tick volume. For each bar, the indicator checks every bin by calculating its midpoint and comparing that midpoint with the bar's closing price. When the closing price falls within the bin's range, the bar's tick volume is added to that bin. This allows the indicator to build a price-based distribution of tick volume across the entire swing leg, showing where trading activity was most concentrated.
After all bar volumes have been distributed, the indicator searches through volBins to find the largest accumulated volume and stores it in maxVol. This value represents the highest volume recorded among all price bins and provides the reference point needed to compare the relative strength of every other bin and identify the Point of Control.
When maxVol exceeds zero, the indicator processes each bin and determines its lower and upper price boundaries using binLow and binHigh. The ratio compares the bin's accumulated volume with maxVol, producing a value between 0 and 1. This ratio determines the visual width of the profile bar, so bins with greater tick volume extend farther from the swing's starting point. leftIdx and rightIdx define the horizontal position of each profile bar, while isPOCBin identifies the bin containing the highest volume when POC display is enabled. This converts the numerical volume distribution into a proportional visual profile and clearly distinguishes the most active price area.
When the bin is identified as the POC, the indicator calculates pocPrice using the midpoint between the bin's lower and upper boundaries. It then determines where the POC line should begin and uses DrawTrend() to draw a horizontal line from that position to the later swing point using the configured POC color and width. The POC line provides a clear visual reference for the price level where the greatest concentration of tick volume occurred during the completed swing leg, helping traders identify the dominant activity level within that movement.
Drawing the Volume Profile
Next, draw the calculated volume-profile bins on the chart using rectangles whose widths reflect their relative tick volume.
Example:
//+--------------------------------------------------------------------------------------+
//| Linear RGB interpolation                                                             |
//+--------------------------------------------------------------------------------------+
color ColorGradient(double ratio, color colA, color colB)
  {
//--- keep ratio inside 0..1 so we never extrapolate past either color
   ratio = MathMax(0.0, MathMin(1.0, ratio));
//--- unpack each color into its R/G/B components (MQL5 color is stored as 0x00BBGGRR)
   int r1 = (int)colA & 0xFF,        g1 = ((int)colA >> 8) & 0xFF,  b1 = ((int)colA >> 16) & 0xFF;
   int r2 = (int)colB & 0xFF,        g2 = ((int)colB >> 8) & 0xFF,  b2 = ((int)colB >> 16) & 0xFF;
//--- interpolate each channel independently
   int r  = (int)(r1 + (r2 - r1) * ratio);
   int g  = (int)(g1 + (g2 - g1) * ratio);
   int b  = (int)(b1 + (b2 - b1) * ratio);
   return (color)(r | (g << 8) | (b << 16));
  }

//+------------------------------------------------------------------+
//| Create a rectangle                                               |
//+------------------------------------------------------------------+
bool DrawRectangle(const string name,
                   datetime x1t, double x1,
                   datetime x2t, double x2,
                   color mainColor, bool obj_propback,
                   double ratio, bool isPOCBin)
  {
   bool created = false;

//--- Create object only if it does not exist (avoids re-creating/flickering on every tick)
   if(ObjectFind(0, name) < 0)
     {
      ObjectCreate(0, name, OBJ_RECTANGLE, 0, x1t, x1, x2t, x2);
      //--- blend toward the POC color as volume ratio rises, so the highest-volume bin stands out
      color fillColor = ColorGradient(ratio, mainColor, isPOCBin ? InpPOCColor : mainColor);
      ObjectSetInteger(0, name, OBJPROP_COLOR, fillColor);
      ObjectSetInteger(0, name, OBJPROP_FILL, true);
      ObjectSetInteger(0, name, OBJPROP_BACK, true);

      created = true;
     }

   return created;
  }
if(maxVol > 0)
  {
   for(int k = 0; k < binCount; k++)
     {
      double binLow  = swingBottom + (k * binStep);
      double binHigh = binLow + binStep;
      double ratio    = volBins[k] / maxVol;   // 0..1, this bin's volume relative to the busiest bin
      //--- histogram bar width is proportional to ratio, capped at half the leg's bar span
      int    width    = (int)(ratio * ((lastIdx - prevIdx) / 2.0));

      int leftIdx  = prevIdx + width;   // how far the bin's bar extends to the right
      int rightIdx = prevIdx;           // bin bars all anchor at the leg's start
      bool isPOCBin = (ratio >= 0.999999 && InpShowPOC);   // this is the point-of-control (highest volume) bin

      //--- POC line at the highest-volume bin
      if(isPOCBin)
        {
         string poc = objPfx + "POC";
         double pocPrice = (binLow + binHigh) / 2.0;
         //--- start the POC line at the edge of the profile bars if shown, otherwise at the leg start
         int pocLeft = InpShowProfile ? prevIdx + width : prevIdx;

         if(DrawTrend(poc, time[pocLeft], pocPrice, time[lastIdx], pocPrice,InpPOCColor,STYLE_SOLID,true,InpPOCWidth))
           {
            need_redraw = true;
           }
        }

      //--- histogram box for this bin
      if(InpShowProfile)
        {
         string bx = objPfx + "B" + IntegerToString(k);
         if(DrawRectangle(bx, time[leftIdx], binHigh, time[rightIdx], binLow, mainColor, true, ratio, isPOCBin))
           {
            need_redraw = true;
           }
        }

     }
  }
Output:
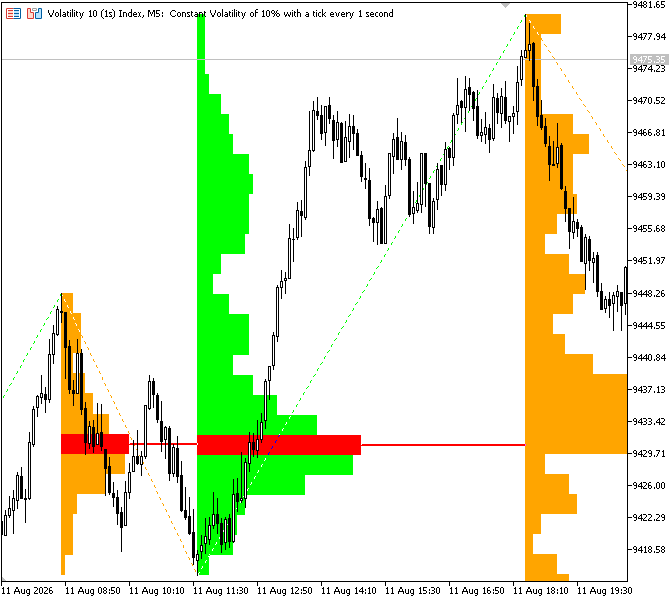
Figure 4. Swing Volume Profile
Explanation:
To make differences in tick volume visible on the chart, the ColorGradient() function calculates a blended color for each profile bin. It keeps the volume ratio within the 0-to-1 range and uses that value to interpolate between the selected main color and the target POC color through their individual RGB components. A lower ratio therefore remains closer to the main color, while a ratio approaching 1 produces a color closer to the POC color. This creates a gradual visual distinction between low- and high-volume areas and helps emphasize the bin containing the greatest volume.
The DrawRectangle() function creates the actual rectangle used to represent a volume-profile bin on the chart. It receives the rectangle's name, two time-price coordinates defining its boundaries, the main swing color, the volume ratio, and information about whether the bin is the POC. Before creating the object, it checks whether an object with the same name already exists, preventing duplicate rectangles. It then uses ColorGradient() to determine the rectangle's fill color, enables the rectangle's filled appearance, and places it behind the main chart. This function converts each calculated price bin and its volume information into a visible profile bar, allowing the trader to see where tick volume was concentrated across the swing leg.
For each price bin, the indicator first checks whether InpShowProfile is enabled. If it is, a unique object name is generated by combining the swing's object prefix with the bin number. This ensures that every bin belonging to a particular swing leg has its own identifiable chart object. The DrawRectangle() function is then called using leftIdx and rightIdx for the horizontal boundaries and binHigh and binLow for the vertical boundaries. The ratio determines the rectangle's width and color intensity, while isPOCBin allows the highest-volume bin to receive the special POC color treatment.
If the rectangle is successfully created, need_redraw is set to true so the chart can be refreshed after the new objects have been added. This final step transforms the calculated volume distribution into the visible histogram, with wider and more prominent rectangles representing areas of greater tick-volume concentration.
Conclusion
By completing this article, we have developed a swing-based volume profile indicator in MQL5 that uses tick volume to analyze volume distribution across completed high-to-low and low-to-high swing legs. The focus was on understanding how confirmed swing points can define meaningful price ranges and how tick volume can be distributed across volatility-adjusted price bins to identify areas of concentrated market activity. Throughout this implementation, we have learned how to:
- detect and confirm swing highs and swing lows using rolling price extremes;
- construct high-to-low and low-to-high swing legs using confirmed swing points;
- use tick volume from each bar within a swing leg;
- calculate volatility-adjusted volume-profile bins using ATR(200);
- distribute tick volume across the defined price bins;
- identify the highest-tick-volume bin as the Point of Control (POC);
- visualize the tick-volume distribution using proportional histogram bars and a POC line; and
- manage chart objects and construct the ZigZag structure in MQL5.
This project combines tick volume with swing structure to build a volume profile per swing leg, rather than for the entire chart. The resulting tool can help traders study areas of concentrated tick-volume activity within completed swings and provide additional context for structural price analysis.
Warning: All rights to these materials are reserved by MetaQuotes Ltd. Copying or reprinting of these materials in whole or in part is prohibited.
This article was written by a user of the site and reflects their personal views. MetaQuotes Ltd is not responsible for the accuracy of the information presented, nor for any consequences resulting from the use of the solutions, strategies or recommendations described.

 Features of Custom Indicators Creation
 Automating Trading Strategies in MQL5 (Part 53): Double Top and Double Bottom Reversal Model
 Features of Experts Advisors
 Did Your Scale Outs Actually Help? A Scale Out Value Analyzer in MQL5

- Free trading apps
- Over 8,000 signals for copying
- Economic news for exploring financial markets
You agree to website policy and terms of use