

Building an Interactive AnchorFlow Volume Profile Indicator (MTF) in MQL5
 3 188
3 188
 1
1

Introduction
Most volume-based traders eventually find themselves needing a multi-timeframe view of volume, yet MetaTrader 5 natively provides only a single-timeframe histogram volume indicator. While this default tool is useful, it lacks anchoring, adaptability, and multi-timeframe context — all of which are essential for serious volume analysis. However, these limitations are not imposed by the platform itself. MQL5 is a powerful, event-driven language, capable of dynamic object rendering, multi-timeframe synchronization, and real-time user interaction, yet most volume indicators fail to exercise its full strength.
In this article, we build an interactive, anchored multi-timeframe volume profile indicator in MQL5 to address these limitations. The indicator draws the current-timeframe volume profile on the main chart and displays higher-timeframe volume data in a dedicated subwindow. It adapts to zooming and scrolling, responds to user input, and highlights volume dominance by synchronizing LTF and HTF profiles. The indicator uses a lightweight keyboard workflow. Double-click "E" to enter edit mode and set the number of bins. Double-click "S" to save and apply the value. When no input is provided, the indicator gracefully falls back to the last valid value stored in memory, ensuring uninterrupted analysis.
To further enhance user experience, the anchor line is normalized to valid chart candle time during drag-and-drop operations, preventing invalid future-time placement and automatically re-centering within the visible range when necessary.
By the end of this article, you will understand how to:
- Implement a drag-and-drop anchor line that controls volume profile construction
- Build interactive, user-controlled volume bins with real-time recalculation
- Render a single indicator simultaneously across multiple chart windows
- Design an object-deletion restoration model for robust user experience
- Construct synchronized multi-timeframe volume profiles
- Apply robust input timeframe validation to ensure consistent and safe indicator behavior
Together, these concepts demonstrate how MQL5 can be leveraged to develop professional-grade volume analysis tools that go far beyond the limitations of native MetaTrader 5 indicators.
Project Overview
Volume is a critical dimension of market analysis, revealing where trading activity concentrates and how participation evolves across price levels and time. Despite its importance, most traders working in MetaTrader 5 remain constrained to a single-timeframe volume histogram, which limits contextual understanding and weakens volume-based decision-making—especially when analysis spans multiple time horizons.
This project designs and implements an interactive, anchored multi-timeframe volume profile indicator in MQL5 to overcome these constraints. The indicator analyzes volume in the visible chart range, draws the current-timeframe profile on the main chart, and renders a user-selected higher-timeframe profile in a dedicated sub-window. Both profiles are synchronized through a shared anchor, enabling precise temporal alignment across timeframes and allowing the user to explicitly define the volume analysis range by dragging the anchor to any point of interest.
Unlike the Viewport SnR Volume Profile framework, this project introduces interactive bin construction. The number of volume bins is not fixed or auto-derived; instead, the user can dynamically type in the desired number of bins at any time. To prevent unintended input capture, edit mode is activated only when the anchor line is explicitly selected, establishing a clear interaction state. A double-click of "E" enables edit mode, allowing numeric input, while a double-click of "S" saves and applies the value instantly. When no input is provided, the indicator safely falls back to the last valid value stored in memory, ensuring uninterrupted analysis and consistent behavior.
The indicator is fully event-driven and viewport-aware, responding to chart zoom, scroll, anchor movement, and user interaction in real time. It employs automatic anchor normalization to a valid chart candle time, object restoration for robustness, and synchronized LTF/HTF volume dominance rendering to visually expose where trading activity is most significant across price levels. Below is a visual model of the indicator described in this project:
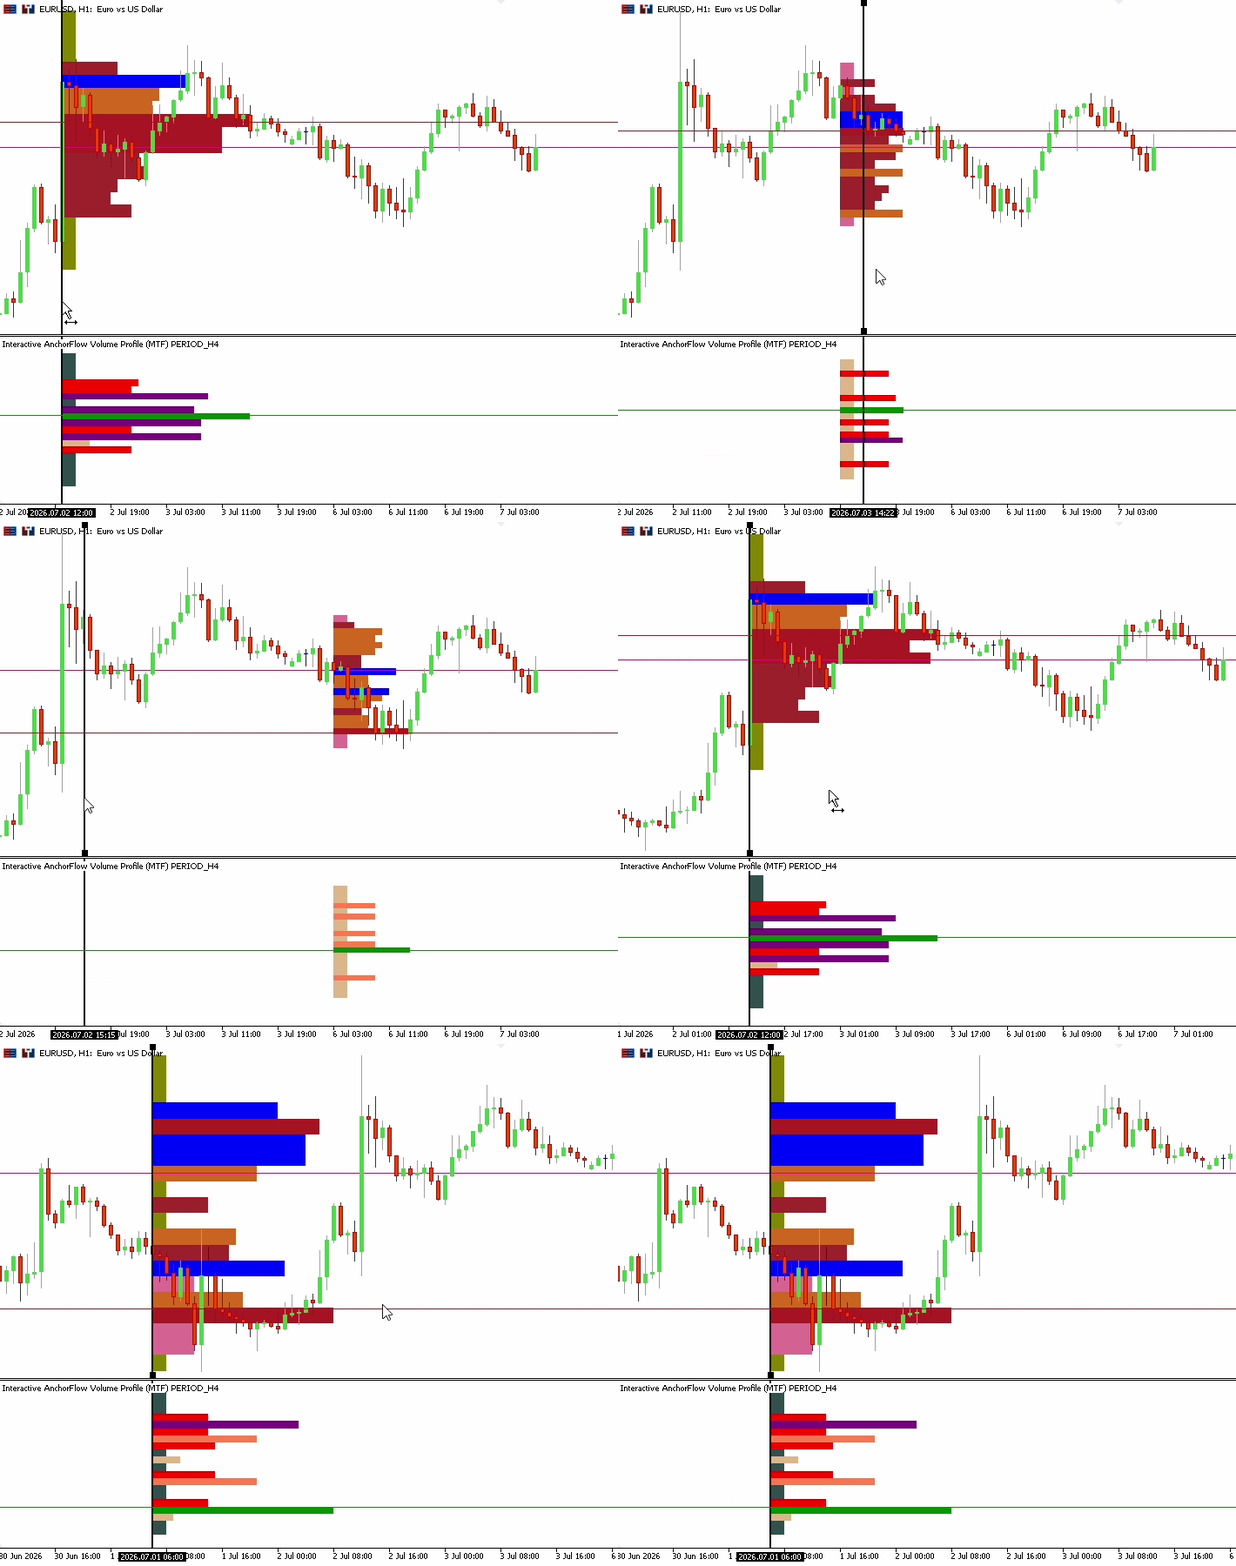
Project Overview
Design Workflow
Before implementation, it is crucial to clearly outline the system workflow. A well-defined workflow simplifies development and ensures predictable behavior under user interaction, chart changes, and multi-timeframe synchronization. This section breaks the design into distinct stages, each responsible for a specific aspect of the indicator’s behavior.
Initialization and Input Validation
The workflow begins during indicator initialization. At this stage, the system presets the number of volume bins to a default value of 20, establishing a stable baseline before any user-driven interaction occurs. This default remains active until the user explicitly modifies it through the interactive edit mechanism. Next, the system validates the selected higher timeframe to ensure it is strictly greater than the current chart timeframe. If the timeframe is invalid, the indicator falls back to the nearest timeframe above the chart timeframe. This preserves alignment and avoids redundant configurations.
Once the timeframe environment is validated, the indicator determines the current viewport boundaries and computes an initial anchor position, typically centered within the visible chart range. This ensures a valid, meaningful starting point for volume analysis and allows the indicator to render coherent volume profiles immediately upon loading.
Anchor Management and Range Scoping
A draggable vertical anchor line acts as the central control mechanism of the system. The anchor defines the starting point of volume analysis, while the rightmost visible candle in the chart viewport automatically serves as the analysis endpoint. Together, these two boundaries give the user explicit control over the volume analysis range without requiring manual range selection. The same user-defined analysis range is reused when constructing the higher timeframe (HTF) volume profile in the sub-window, ensuring that both LTF and HTF profiles remain temporally synchronized and directly comparable.
Once the analysis range is set, the indicators retrieves candlestick data and derives price bounds from the highest high and lowest low in that range. These values define the effective price range over which volume bins are constructed and accumulated. For visual stability, the sub-window range is padded by ±100 points. The padded values are used as the sub-window maximum and minimum levels. This padding prevents profile compression at the edges and preserves visual clarity across different market conditions.
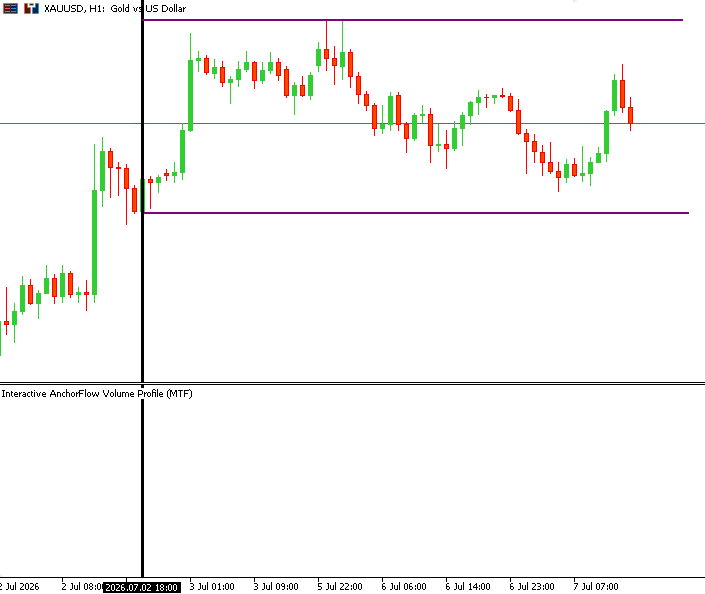
Range Scoping
During drag-and-drop operations, the anchor time is normalized to the nearest valid chart candle to prevent invalid future-time placement. If the anchor is deleted, it is immediately restored, preserving workflow continuity and indicator integrity while ensuring the analysis range remains well-defined at all times.
Interactive Bin Construction
Unlike fixed or auto-scaled bin models, this indicator employs interactive bin construction. The user can specify the number of volume bins only when the anchor line is explicitly selected, establishing a clear interaction state. A double-click of the "E" key activates edit mode, enabling the indicator to capture subsequent numeric input that defines the bin count, while a double-click of the "S" key commits and applies the change. When no input is supplied, the system safely falls back to the last stored value, ensuring stable and uninterrupted behavior.
Volume Accumulation
Once the range and bin structure are defined, the indicator accumulates tick volume or real volume for both the current timeframe (LTF) and the selected higher timeframe (HTF). For each candle within the analysis range, volume is attributed to a bin only when the candle’s close price falls within that bin’s price boundaries. This approach ensures consistent and deterministic bin assignment across timeframes.
Volume accumulation is performed in parallel for lower and higher timeframe candles, using the same user-defined time range and bin structure, thereby preserving temporal alignment between profiles. Accumulated volume values are then normalized to prevent division errors and to support proportional scaling, producing a stable and comparable measure of volume dominance across price levels.
Volume Profile Rendering
Finally, the indicator renders the accumulated volume profiles. Current timeframe profiles are drawn directly on the main chart, while higher timeframe profiles appear in a dedicated sub-window. Profile lengths are scaled proportionally to volume dominance, and color encoding is applied to visually emphasize high-activity price levels. The Point of Control (POC) is highlighted to expose areas of maximum participation.
Event-Driven Update
The OnChartEvent() function coordinates event-driven behavior. It handles anchor selection and dragging, double-click detection for "E" and "S", numeric input, zoom/scroll events, and anchor restoration after deletion. By responding immediately to user and chart events, the indicator maintains synchronized volume profiles and delivers a responsive, intuitive, and professional user experience.
MQL5 Implementation
This section translates the proposed framework into practical MQL5 implementation. We progressively develop the Interactive AnchorFlow Volume Profile by implementing its initialization logic, interactive event handling, anchor management, viewport processing, volume computation, multi-timeframe synchronization, and rendering routines.
Compiler Directives
We begin by establishing the preprocessor directives, which define the compilation behavior and metadata of the MQL5 program. This is then followed by the declaration of key constants that will be referenced throughout the implementation, ensuring consistency and maintainability.//+------------------------------------------------------------------+ //| Interactive AnchorFlow Volume Profile.mq5 | //| © 2026, ChukwuBuikem | //| https://www.mql5.com/en/users/bikeen | //+------------------------------------------------------------------+ #property copyright "© 2026, ChukwuBuikem" #property link "https://www.mql5.com/en/users/bikeen" #define _PROG_NAME "Interactive AnchorFlow Volume Profile (MTF)" #property description _PROG_NAME #property indicator_separate_window #property indicator_plots 0 //--- PROFILE MACROS #define _VP_ANCHOR _PROG_NAME + "VP Anchor" #define _VOLUME_PROFILE _PROG_NAME + "Profile" #define _LTF_VOLUME_PROFILE _VOLUME_PROFILE + "LTF" #define _HTF_VOLUME_PROFILE _VOLUME_PROFILE + "HTF" //--- KEYSTROKE MACROS #define _DBL_CLICK_TIME 500 //MILLISECONDS #define _KEY_E 69 // EDIT #define _KEY_S 83 // SAVE
Explanation:
- Although #property indicator_separate_window creates a dedicated indicator sub-window, it does not prevent rendering objects on the main chart. With #property indicator_plots 0, all visuals are drawn using graphical objects, allowing lower timeframe profiles on the main chart and higher timeframe profiles in the sub-window simultaneously.
- The defined macros provide consistent program identifiers, object names, and keyboard constants, simplifying code maintenance while ensuring uniform naming and interaction behavior throughout the indicator.
Custom Data Structure
Next, we introduce a custom data structure for storing the price level and its accumulated volume, providing the fundamental container used during volume profile computation.
//--- DATA STRUCTURE
struct st_priceVolume
  {
   //---
   double            price;
   long              volume;
   //--- CONSTRUCTOR
                     st_priceVolume(): price(EMPTY_VALUE), volume(0) {}
  };
Indicator Settings
The indicator only requires a single input parameter, allowing users to specify the higher timeframe used for synchronized multi-timeframe volume analysis.
//--- INPUT SETTING
input ENUM_TIMEFRAMES inpHtf = PERIOD_H4;// Higher timeframe
Global Variables
With the input setting in place, we now transition to defining the program's global variables. These variables preserve the indicator's execution state, including the anchor position, validated higher timeframe, interactive bin count, user input buffer, and edit mode state.
//--- GLOBAL STATE VARIABLES
datetime anchorTime;
ENUM_TIMEFRAMES htf = inpHtf;
int indSubWindow = -1;
int interactiveBins = 20;
string inputBuffer = "";
bool editMode = false;
Utility Functions
To improve modularity and maintain clean separation of responsibilities, several utility functions are introduced throughout the implementation. These helper functions encapsulate reusable operations such as candle-state validation, swing analysis, array management, and liquidity sweep event visualization.- Higher Timeframe Detection
This function automatically determines the next valid timeframe higher than the current chart timeframe, ensuring meaningful multi-timeframe analysis. If the user specifies an invalid or equal timeframe, it safely falls back to the nearest available higher timeframe, preventing inconsistent indicator behavior.
//+------------------------------------------------------------------+
//|                   NEXT HIGHER TIMEFRAME DETECTION                |
//+------------------------------------------------------------------+
ENUM_TIMEFRAMES getNextHFT()
  {
//---
   ENUM_TIMEFRAMES timeframes[] = {PERIOD_M1, PERIOD_M2, PERIOD_M3,
                                   PERIOD_M4, PERIOD_M5, PERIOD_M6,
                                   PERIOD_M10, PERIOD_M12, PERIOD_M15,
                                   PERIOD_M20, PERIOD_M30, PERIOD_H1,
                                   PERIOD_H2, PERIOD_H3, PERIOD_H4,
                                   PERIOD_H6, PERIOD_H8, PERIOD_H12,
                                   PERIOD_D1, PERIOD_W1, PERIOD_MN1
                                  };

   int chartSecs = PeriodSeconds();
//--- FIND NEXT HIGHER THAN CHART TF
   for(int w = 0; w < ArraySize(timeframes); w++)
     {
      if(PeriodSeconds(timeframes[w]) > chartSecs)
         return timeframes[w];
     }
//--- FALLBACK
   return timeframes[ArraySize(timeframes) - 1];
  }
- Viewport Detection
Viewport detection determines the currently visible chart range, ensuring that all volume computations are restricted to what the user is actively viewing. The function retrieves the first visible bar and the number of visible bars, derives the corresponding start and end time boundaries, and returns the effective visible bar count. These values establish the dynamic analysis window used throughout the indicator, allowing the volume profiles to automatically adapt as the user scrolls or zooms the chart.
//+------------------------------------------------------------------+
//|                    VIEWPORT DETECTION                            |
//+------------------------------------------------------------------+
int getViewportValues(datetime &start, datetime &end)
  {
//---
   int first = (int) ChartGetInteger(0, CHART_FIRST_VISIBLE_BAR);
   int visibleBars = (int) ChartGetInteger(0, CHART_VISIBLE_BARS);

   int last = first - visibleBars + 2;
   if(last < 0)
      last = 0;

   visibleBars = visibleBars - 2;
   start = iTime(_Symbol, PERIOD_CURRENT, last);
   end = iTime(_Symbol, PERIOD_CURRENT, first);

   return visibleBars;
  }
- Time and Volume Normalization
Reliable volume profiling depends on accurate time alignment and consistent volume scaling. This section introduces the helper functions responsible for normalizing timestamps to valid chart bars and scaling accumulated volume, ensuring robust calculations, synchronized multi-timeframe processing, and stable profile rendering.
//+------------------------------------------------------------------+
//|                      CHART ALIGNMENT                             |
//+------------------------------------------------------------------+
datetime normalizeToChartTime(datetime time, ENUM_TIMEFRAMES tf = PERIOD_CURRENT)
  {
//---
   int shift = iBarShift(_Symbol, tf, time);
   if(shift < 0)
      shift = 0;

   return iTime(_Symbol, tf, shift);
  }
//+------------------------------------------------------------------+
//|                   MIDDLE TIME DETECTION                          |
//+------------------------------------------------------------------+
datetime getMiddleCandleTime(const datetime time1, const datetime time2)
  {
//---
   datetime rawMiddleTime = (time1 + time2) / 2;

   int nearestBar = iBarShift(_Symbol, PERIOD_CURRENT, rawMiddleTime, false);

   if(nearestBar < 0)
      return rawMiddleTime;

   return iTime(_Symbol, PERIOD_CURRENT, nearestBar);// Normalized value
  }
//+------------------------------------------------------------------+
//|                   VOLUME NORMALIZATION                           |
//+------------------------------------------------------------------+
double normalizeMinMax(const long value, const long maxVol, const long minVol)
  {
//---
   if(maxVol <= minVol)
      return 0;

   return (double)(value - minVol) / (maxVol - minVol);
  }
Explanation:
- Chart Alignment
This function aligns an arbitrary timestamp to the nearest valid bar on the specified timeframe, ensuring all time-based operations remain synchronized with available market data. - Middle Time Detection
To initialize the anchor at the center of the visible range, the function computes the midpoint and normalizes it to the nearest valid bar. This also helps prevent unintended future-time placement of the anchor. - Volume Normalization
Here we apply a min-max normalization to accumulated volume, scaling values to the range [0, 1] while preventing division-by-zero errors for stable profile rendering.
- Keystroke Double-Click Detection
We define a function to determine whether two consecutive keystrokes occur within a predefined time interval, enabling reliable double-click detection for keyboard interactions such as activating edit mode (E) and committing user input (S).
//+------------------------------------------------------------------+
//|           KEYSTROKE DOUBLE-CLICK DETECTION                       |
//+------------------------------------------------------------------+
bool isDoubleClick(ulong &lastClick)
  {
//---
   ulong now = GetTickCount();
   bool doubleClick = (now - lastClick <= _DBL_CLICK_TIME);
   lastClick = now;

   return doubleClick;
  }
- Visualization
These helper functions encapsulate the creation of the indicator's graphical objects, including the interactive anchor line, profile boundaries, and volume profile rectangles. Notably, both createHLine() and createRect() accept a sub-window index parameter, allowing the same rendering logic to target either the main chart or the indicator sub-window.
//+------------------------------------------------------------------+
//|                      VERTICAL LINE CREATION                      |
//+------------------------------------------------------------------+
bool createVLine(const string objName, const datetime time,
                 const color clr, const string tooltip = "\n",
                 const bool selected = false)
  {
//---
   if(ObjectCreate(0, objName, OBJ_VLINE, 0, time, 0))
     {
      ObjectSetInteger(0, objName, OBJPROP_COLOR, clr);
      ObjectSetInteger(0, objName, OBJPROP_SELECTABLE, true);
      ObjectSetInteger(0, objName, OBJPROP_SELECTED, selected);
      ObjectSetInteger(0, objName, OBJPROP_WIDTH, 2);
      ObjectSetInteger(0, objName, OBJPROP_HIDDEN, true);
      ObjectSetString(0, objName, OBJPROP_TOOLTIP, tooltip);
      ChartRedraw();
      return true;
     }
   return false;
  }
//+------------------------------------------------------------------+
//|                      HORIZONTAL LINE CREATION                    |
//+------------------------------------------------------------------+
bool createHLine(const string objName, const double price,
                 const int subWind, const color clr, const string tooltip)
  {
//---
   if(ObjectCreate(0, objName, OBJ_HLINE, subWind, 0, price))
     {
      ObjectSetInteger(0, objName, OBJPROP_COLOR, clr);
      ObjectSetInteger(0, objName, OBJPROP_SELECTABLE, false);
      ObjectSetInteger(0, objName, OBJPROP_WIDTH, 1);
      ObjectSetInteger(0, objName, OBJPROP_HIDDEN, true);
      ObjectSetString(0, objName, OBJPROP_TOOLTIP, tooltip);
      return true;
     }
   return false;
  }
//+------------------------------------------------------------------+
//|                      RECTANGLE CREATION                          |
//+------------------------------------------------------------------+
bool createRect(const string objName, const datetime time1, const double price1,
                const datetime time2, const double price2, const int subWind, const color clr)
  {
//---
   if(ObjectCreate(0, objName, OBJ_RECTANGLE, subWind, time1, price1, time2, price2))
     {
      ObjectSetInteger(0, objName, OBJPROP_COLOR, clr);
      ObjectSetInteger(0, objName, OBJPROP_BACK, true);
      ObjectSetInteger(0, objName, OBJPROP_FILL, true);
      ObjectSetInteger(0, objName, OBJPROP_HIDDEN, true);
      ObjectSetInteger(0, objName, OBJPROP_SELECTABLE, false);
      ObjectSetString(0, objName, OBJPROP_TOOLTIP, "\n");
      return true;
     }
   return false;
  }
- Volume Profile Computation
With the required market data available, the next step is to implement the core computational engine of the indicator. Using the user-defined analysis range and interactive bin configuration, it constructs synchronized LTF and HTF volume profiles by accumulating volume, determining volume dominance, and rendering proportional profile blocks together with their corresponding Point of Control (POC) levels.
//+------------------------------------------------------------------+
//|                  HTF VOLUME PROFILE COMPUTATION                  |
//+------------------------------------------------------------------+
void htfVolumeProfile(const datetime vpAnchor, const int maxProfile,
                      const int minProfile)
  {
//---
   datetime  viewStart = 0, viewEnd = 0;
   int count = getViewportValues(viewStart, viewEnd);
   viewStart = normalizeToChartTime(viewStart, htf);
   viewEnd =  normalizeToChartTime(vpAnchor, htf);

   count = MathAbs(iBarShift(_Symbol, htf, viewStart) -
                   iBarShift(_Symbol, htf, viewEnd)) + 1;

   int firstBar = -1, highestIndex = -1, lowestIndex = -1;
   int numberOfBins = -1;
   bool useRealVol = false;
   double rangeHigh = EMPTY_VALUE, rangeLow = EMPTY_VALUE;
   double binHigh = EMPTY_VALUE,  binLow = EMPTY_VALUE;
   long maxVol = 0, minVol = LONG_MAX;
   int extendBars = 0;
   color clr = clrNONE;
   double dominance = -1;

   MqlRates rates[];
   ArraySetAsSeries(rates, true);
   st_priceVolume bins[];
//--- ENSURE DATA IS SYNCHRONIZED
   while(!SeriesInfoInteger(_Symbol, htf, SERIES_SYNCHRONIZED) && !IsStopped())
     {
      Sleep(100);
     }
//--- CLEAR SUB WINDOW
   ObjectsDeleteAll(0, _HTF_VOLUME_PROFILE);
   ChartRedraw();

   if(CopyRates(_Symbol, htf, viewStart, viewEnd, rates) > 0)
     {
      firstBar = iBarShift(_Symbol, htf, viewStart);
      highestIndex = iHighest(_Symbol, htf, MODE_HIGH, count, firstBar);
      lowestIndex = iLowest(_Symbol, htf, MODE_LOW, count, firstBar);
      //---
      rangeHigh = iHigh(_Symbol, htf, highestIndex);
      rangeLow = iLow(_Symbol, htf, lowestIndex);
      //--- INTERACTIVE BIN CONSTRUCTION
      numberOfBins = interactiveBins;
      double step = (rangeHigh - rangeLow) / numberOfBins;
      ArrayResize(bins, numberOfBins);
      useRealVol = (rates[0].real_volume > 0);
      //--- VOLUME ACCUMULATION
      for(int w = 0; w < numberOfBins; w++)
        {
         binLow = rangeLow + step * w;
         binHigh = binLow + step;
         //---
         for(int c = 0; c < ArraySize(rates); c++)
           {
            if(rates[c].close >= binLow && rates[c].close <= binHigh)
              {
               bins[w].volume += (useRealVol) ? rates[c].real_volume : rates[c].tick_volume;
               bins[w].price = rates[c].close;
              }
           }
         if(bins[w].volume < 1)
            bins[w].volume = 1;
        }
      //--- VOLUME EXTREMES
      for(int b = 0; b < ArraySize(bins); b++)
        {
         if(bins[b].volume > maxVol)
            maxVol = bins[b].volume;

         if(bins[b].volume < minVol)
            minVol = bins[b].volume;
        }
      bool pocDrawn = false;
      //--- PROFILE RENDERING
      for(int p = 0; p < ArraySize(bins); p++)
        {
         binLow = rangeLow + step * p;
         binHigh = binLow + step;

         extendBars = minProfile + (int)MathRound(normalizeMinMax(bins[p].volume, maxVol, minVol) *
                      (maxProfile - minProfile));

         dominance = (double)extendBars / maxProfile;
         clr = (dominance >= 0.85) ? clrGreen :
               (dominance >= 0.65) ? clrPurple :
               (dominance >= 0.45) ? clrCoral :
               (dominance >= 0.25) ? clrRed :
               (dominance >= 0.10) ? clrBurlyWood :
               clrDarkSlateGray;
         createRect(_HTF_VOLUME_PROFILE + (string)p, vpAnchor, binLow, vpAnchor + (PeriodSeconds()*extendBars), binHigh, indSubWindow, clr);
         if(bins[p].volume == maxVol && !pocDrawn)
           {
            //--- DRAW MAXIMUM VOLUME'S POC : ONCE
            createHLine(_HTF_VOLUME_PROFILE + "POC", bins[p].price, indSubWindow, clr, "HTF POC");
            pocDrawn = true;
           }
        }
     }
  }
//+------------------------------------------------------------------+
//|                 CORE VOLUME PROFILE COMPUTATIONS                 |
//+------------------------------------------------------------------+
void calcVolumeProfile(const datetime vpAnchor, const bool vpSelected)
  {
//---
   datetime  viewStart = 0, viewEnd = 0;
   int count = getViewportValues(viewStart, viewEnd);
   int firstBar = -1, highestIndex = -1, lowestIndex = -1;
   int numberOfBins = -1;
   bool useRealVol = false;
   double rangeHigh = EMPTY_VALUE, rangeLow = EMPTY_VALUE;
   double binHigh = EMPTY_VALUE,  binLow = EMPTY_VALUE;
   long maxVol = 0, minVol = LONG_MAX;
   int extendBars = 0, maxProfileLength = 0, minProfileLength = 0;
   color clr = clrNONE;
   double dominance = -1;

   MqlRates rates[];
   ArraySetAsSeries(rates, true);
   st_priceVolume bins[];

   createVLine(_VP_ANCHOR, vpAnchor, clrBlack, "VP Anchor", vpSelected);

   count = MathAbs(iBarShift(_Symbol, PERIOD_CURRENT, viewStart) -
                   iBarShift(_Symbol, PERIOD_CURRENT, vpAnchor)) + 1;
//--- ENSURE DATA IS SYNCHRONIZED
   while(!SeriesInfoInteger(_Symbol, PERIOD_CURRENT, SERIES_SYNCHRONIZED) && !IsStopped())
     {
      Sleep(100);
     }
//--- CLEAR MAIN CHART
   ObjectsDeleteAll(0, _LTF_VOLUME_PROFILE);
   ChartRedraw();

   if(CopyRates(_Symbol, PERIOD_CURRENT, viewStart, vpAnchor, rates) > 0)
     {
      firstBar = iBarShift(_Symbol, PERIOD_CURRENT, viewStart);
      highestIndex = iHighest(_Symbol, PERIOD_CURRENT, MODE_HIGH, count, firstBar);
      lowestIndex = iLowest(_Symbol, PERIOD_CURRENT, MODE_LOW, count, firstBar);
      //---
      rangeHigh = iHigh(_Symbol, PERIOD_CURRENT, highestIndex);
      rangeLow = iLow(_Symbol, PERIOD_CURRENT, lowestIndex);
      //--- DYNAMIC SUB-WINDOW PRICE SCALING
      IndicatorSetDouble(INDICATOR_MAXIMUM, rangeHigh + (100 * _Point));
      IndicatorSetDouble(INDICATOR_MINIMUM, rangeLow - (100 * _Point));
      //--- INTERACTIVE BIN CONSTRUCTION
      numberOfBins = interactiveBins;
      double step = (rangeHigh - rangeLow) / numberOfBins;
      ArrayResize(bins, numberOfBins);
      useRealVol = (rates[0].real_volume > 0);
      //--- VOLUME ACCUMULATION
      for(int w = 0; w < numberOfBins; w++)
        {
         binLow = rangeLow + step * w;
         binHigh = binLow + step;
         //---
         for(int c = 0; c < ArraySize(rates); c++)
           {
            if(rates[c].close >= binLow && rates[c].close <= binHigh)
              {
               bins[w].volume += (useRealVol) ? rates[c].real_volume : rates[c].tick_volume;
               bins[w].price = rates[c].close;
              }
           }
         if(bins[w].volume < 1)
            bins[w].volume = 1;
        }
      //--- VOLUME EXTREMES
      for(int b = 0; b < ArraySize(bins); b++)
        {
         if(bins[b].volume > maxVol)
            maxVol = bins[b].volume;

         if(bins[b].volume < minVol)
            minVol = bins[b].volume;
        }
      //--- PROFILE SCALING
      maxProfileLength = (int)(count * 0.4);
      maxProfileLength = MathMax(4, maxProfileLength);
      minProfileLength = (int)MathRound(maxProfileLength * 0.05);
      minProfileLength = MathMax(2, minProfileLength);

      bool pocDrawn = false;
      //--- PROFILE RENDERING
      for(int p = 0; p < ArraySize(bins); p++)
        {
         binLow = rangeLow + step * p;
         binHigh = binLow + step;

         extendBars = minProfileLength + (int)MathRound(normalizeMinMax(bins[p].volume, maxVol, minVol) *
                      (maxProfileLength - minProfileLength));

         //--- AVOID ZERO DIVISION ERROR
         if(maxProfileLength > 0)
            dominance = (double)extendBars / maxProfileLength;
         clr = (dominance >= 0.85) ? clrFireBrick :
               (dominance >= 0.65) ? clrBlue :
               (dominance >= 0.45) ? clrChocolate :
               (dominance >= 0.25) ? clrBrown :
               (dominance >= 0.10) ? clrPaleVioletRed :
               clrOlive;
         createRect(_LTF_VOLUME_PROFILE + (string)p, vpAnchor, binLow, vpAnchor + (PeriodSeconds()*extendBars), binHigh, 0, clr);
         if(bins[p].volume == maxVol && !pocDrawn)
           {
            //--- DRAW MAXIMUM VOLUME'S POC : ONCE
            createHLine(_LTF_VOLUME_PROFILE + "POC", bins[p].price, 0, clr, "LTF POC");
            pocDrawn = true;
           }
        }
      htfVolumeProfile(vpAnchor, maxProfileLength, minProfileLength);
      ChartRedraw();
     }
  }
Explanation:
- htfVolumeProfile()
Computes the Higher Timeframe (HTF) volume profile by synchronizing higher timeframe data with the user-defined analysis range, accumulating volume across interactive bins, scaling profile lengths based on normalized volume dominance, and rendering the resulting profile together with its HTF POC in the indicator sub-window.
- calcVolumeProfile()
Performs the primary orchestration routine of the indicator. It establishes the analysis range, computes the LTF volume profile, dynamically scales the sub-window, renders the LTF profile and POC on the main chart, and finally invokes the HTF computation to produce synchronized multi-timeframe volume profiles.
Initialization Logic (OnInit)
Having established the supporting helper functions, we now implement the standard MQL5 event handlers, beginning with the OnInit() handler. During initialization, the indicator validates the higher timeframe, configures the chart environment, determines the initial viewport and anchor position, and renders the first synchronized volume profile, establishing the runtime state for subsequent user interaction.
//+------------------------------------------------------------------+
//|                  INITIALIZATION FUNCTION                         |
//+------------------------------------------------------------------+
int OnInit()
  {
//--- ROBUST INPUT TIMEFRAME VALIDATION
   if(htf <= _Period)
      htf = getNextHFT();
//--- CHART AND INDICATOR SETUP
   ChartSetInteger(0, CHART_EVENT_OBJECT_DELETE, true);
   IndicatorSetString(INDICATOR_SHORTNAME, _PROG_NAME + " " + EnumToString(htf));
   indSubWindow = ChartWindowFind(0, _PROG_NAME + " " + EnumToString(htf));
//--- RENDER VOLUME PROFILE
   datetime start, end;
   getViewportValues(start, end);
   anchorTime = getMiddleCandleTime(start, end);
   calcVolumeProfile(anchorTime, false);

   return(INIT_SUCCEEDED);
  }
Cleanup (OnDeinit)
When the indicator is removed, OnDeinit() restores modified chart settings, deletes all program-generated objects, and refreshes the chart, ensuring a clean and consistent shutdown.
//+------------------------------------------------------------------+
//|                  DEINITIALIZATION FUNCTION                       |
//+------------------------------------------------------------------+
void OnDeinit(const int32_t reason)
  {
//--- CHART SETTING RESTORATION AND CLEAN UP
   ChartSetInteger(0, CHART_EVENT_OBJECT_DELETE, false);
   ObjectsDeleteAll(0, _PROG_NAME);
   ChartRedraw();
  }
Core Indicator Function
The OnCalculate() function monitors the arrival of new market data and recalculates the volume profiles only when a new bar is formed, preserving the current anchor selection state while avoiding unnecessary computations.//+------------------------------------------------------------------+ //| ITERATION FUNCTION | //+------------------------------------------------------------------+ int OnCalculate(const int32_t rates_total, const int32_t prev_calculated, const datetime &time[], const double &open[], const double &high[], const double &low[], const double &close[], const long &tick_volume[], const long &volume[], const int32_t &spread[]) { //--- if(prev_calculated > 0 && rates_total != prev_calculated) { bool isSelected = (bool) ObjectGetInteger(0, _VP_ANCHOR, OBJPROP_SELECTED); calcVolumeProfile(anchorTime, isSelected); } return(rates_total); }
Interactive Engine
The interactive engine is implemented within OnChartEvent(), enabling the indicator to respond to user interactions and chart events in real time. It coordinates anchor management, interactive bin editing, viewport synchronization, and automatic object restoration to deliver a responsive user experience.
//+------------------------------------------------------------------+
//|                   CHARTEVENT FUNCTION                            |
//+------------------------------------------------------------------+
void OnChartEvent(const int32_t id,
                  const long &lparam,
                  const double &dparam,
                  const string &sparam)
  {
//--- CHART CHANGE
   if(id == CHARTEVENT_CHART_CHANGE)
     {
      bool isSelected = (bool) ObjectGetInteger(0, _VP_ANCHOR, OBJPROP_SELECTED);
      //--- OTHER SUB-INDICATOR DELETION, CHART SCROLL, AND ZOOM
      calcVolumeProfile(anchorTime, isSelected);
      //--- UPDATE INDICATOR SUB WINDOW
      indSubWindow = ChartWindowFind(0, _PROG_NAME + " " + EnumToString(htf));
     }
//--- INTERACTIVE BIN EDITING
   if(id == CHARTEVENT_KEYDOWN)
     {
      int key = (int)lparam;
      static ulong lastEClick = 0;
      static ulong lastSClick = 0;

      if((bool)ObjectGetInteger(0, _VP_ANCHOR, OBJPROP_SELECTED))
        {
         //--- EDIT-SAVE MECHANISM
         if(key == _KEY_E || key == _KEY_S)
           {
            switch(key)
              {
               //--- EDIT MODE
               case _KEY_E:
                  if(isDoubleClick(lastEClick))
                    {
                     inputBuffer = "";
                     editMode = true;
                     Print("Edit mode activated");
                    }
                  break;
               //--- SAVE INPUT
               case _KEY_S:
                  if(isDoubleClick(lastSClick))
                    {
                     //--- GET NUMBER OF BINS FROM USER INPUT
                     int temp = (int) StringToInteger(inputBuffer);
                     //--- CLAMP (5 - 100)
                     temp = (temp < 5) ? 5 : (temp > 100) ? 100 : temp;
                     //--- IF NO INPUT, USE LAST VALUE IN MEMORY
                     interactiveBins = (inputBuffer == "") ? interactiveBins : temp;
                     Print("Saved: [", interactiveBins, "]");
                     editMode = false;
                    }
                  break;
              }
           }
         //--- CAPTURE USER INPUTS
         if(editMode)
           {
            //--- NUMERIC INPUTS (0 - 9)
            if(key >= 48 && key <= 57)
              {
               inputBuffer += CharToString((char)key);
              }
           }
        }
     }
//---
   if(sparam != _VP_ANCHOR)
      return;

   switch(id)
     {
      //--- ANCHOR LINE DRAG-AND-DROP
      case CHARTEVENT_OBJECT_DRAG:
        {
         anchorTime = (datetime)ObjectGetInteger(0, _VP_ANCHOR, OBJPROP_TIME);
         anchorTime = normalizeToChartTime(anchorTime);
         //--- ENHANCED USER-EXPERIENCE
         if(anchorTime > iTime(_Symbol, PERIOD_CURRENT, 1))
           {
            datetime start = 0, end = 0;
            getViewportValues(start, end);
            anchorTime = getMiddleCandleTime(start, end);
           }
         calcVolumeProfile(anchorTime, true);
         break;
        }
        //--- ANCHOR RESTORATION
      case CHARTEVENT_OBJECT_DELETE:
        {
         Print("Volume Profile Anchor line deleted. RESTORED");
         //--- RESTORE IMMEDIATELY
         createVLine(_VP_ANCHOR, anchorTime, clrBlack, "VP Anchor", true);
         break;
        }
     }
  }
Explanation:
- Chart Change Handling
Responds to chart zoom, scroll, and viewport changes by recalculating the volume profiles and updating the indicator sub-window reference.
- Interactive Bin Editing
Processes double-clicks of the E and S keys to activate edit mode and save the user-specified bin count, while capturing subsequent numeric keystrokes.
- Anchor Drag Handling
Captures anchor drag-and-drop events, normalizes the anchor to a valid chart bar, prevents future-time placement, and immediately rebuilds the synchronized volume profiles.
- Anchor Restoration
Monitors anchor deletion events and automatically recreates the anchor line, preserving indicator integrity and uninterrupted interaction.
Indicator Testing
Once the indicator compiles successfully without errors, the GIF below demonstrates its interactive behavior in real time. It showcases anchor line-based volume profile construction, robust multi-timeframe validation through automatic higher timeframe fallback, and the synchronized updating of both LTF and HTF volume profiles as the anchor is moved, validating the correctness and responsiveness of the implementation.
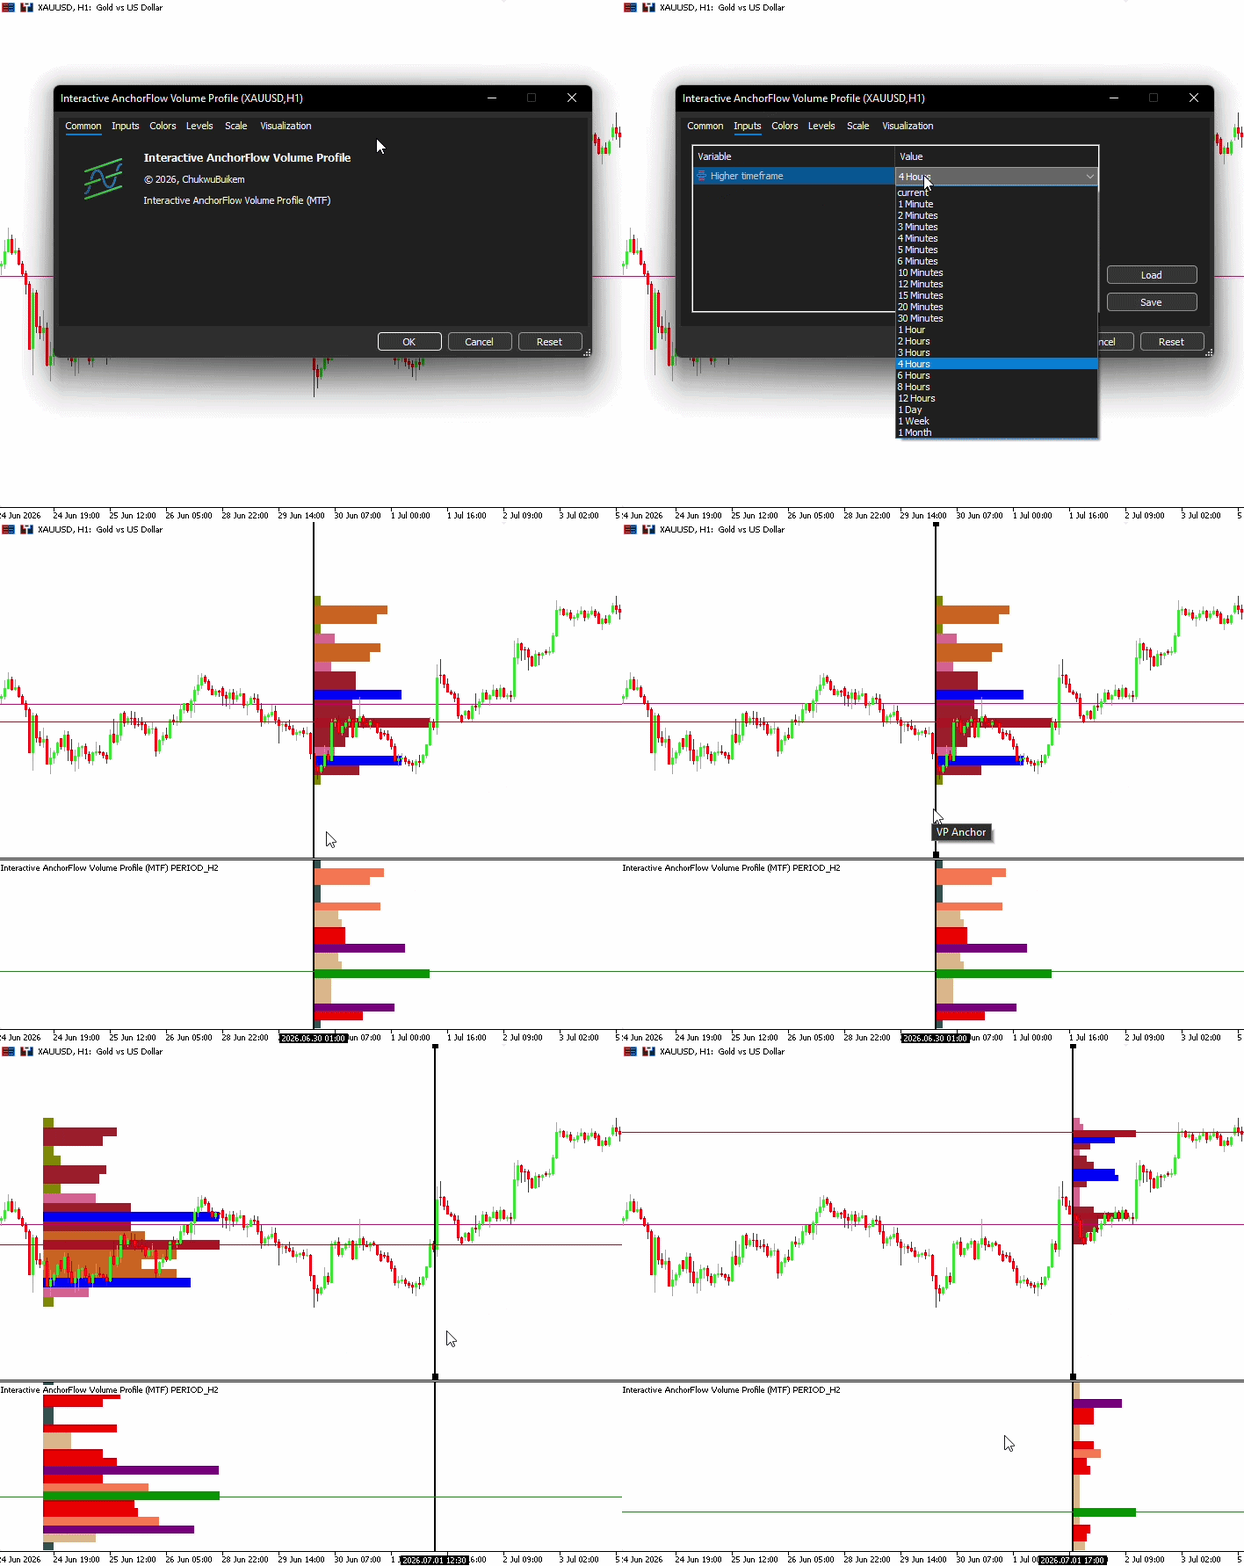
Indicator Testing
Conclusion
In this article, we implemented an interactive multi-timeframe AnchorFlow Volume Profile in MQL5 that extends the capabilities of the native MetaTrader 5 volume indicator through synchronized, event-driven volume analysis. Rather than being limited to a single-timeframe histogram, the framework enables users to interactively define the analysis range, construct synchronized volume profiles across multiple timeframes, and visualize volume participation directly on the chart.
The major implementations include:
- Anchor-based volume construction—a draggable anchor line that defines the start of the analysis range, while the viewport determines the endpoint, giving users complete control over the profiled region.
- Interactive bin construction—a keyboard-driven editing mechanism that allows users to dynamically specify the number of volume bins through E and S double-click interactions, with automatic fallback to the last valid value.
- Robust multi-timeframe validation—automatic detection and selection of the nearest higher timeframe whenever an invalid timeframe is specified, ensuring reliable synchronization.
- Synchronized multi-timeframe volume display—simultaneous rendering of LTF volume profiles on the main chart and HTF volume profiles in a dedicated sub-window, both aligned to the same analysis range.
- Event-driven updates—automatic recalculation during anchor movement, chart zooming, scrolling, object restoration, and new-bar formation, providing a responsive and seamless user experience.
By combining interactive controls, robust timeframe handling, synchronized rendering, and real-time updates, this framework demonstrates how MQL5 can be used to develop professional-grade, multi-timeframe volume analysis tools that extend far beyond the capabilities of the native MetaTrader 5 volume indicator, while serving as a solid foundation for more advanced volume-based analytics and trading systems.
Warning: All rights to these materials are reserved by MetaQuotes Ltd. Copying or reprinting of these materials in whole or in part is prohibited.
This article was written by a user of the site and reflects their personal views. MetaQuotes Ltd is not responsible for the accuracy of the information presented, nor for any consequences resulting from the use of the solutions, strategies or recommendations described.

 MetaTrader 5 Machine Learning Blueprint (Part 19): Bagging Regimes
 Algorithmic Arbitrage Trading Using Graph Theory
 From Basic to Intermediate: Random Access (II)
 Monochronic Trading (Part 1): How to Detect Broker Timezone and DST in MQL5

- Free trading apps
- Over 8,000 signals for copying
- Economic news for exploring financial markets
You agree to website policy and terms of use
For few reasons this is not a legitimate indicator just yet:
1.) Not elligible for real time volume profile
2.) it only work in one timeframe that is h4
IT's a dummy indicator