

Building a Bar Replay Tool in MQL5
 13 624
 2
2

Introduction
After being taken out of a trade, you begin asking yourself questions. "What did I miss? Did I enter too early? At what point did the market begin to show signs that I ignored?"
You scroll back through the chart, hoping to relive the market candle by candle. But there's a problem—the future is already visible. No matter how disciplined you try to be, your eyes eventually drift to the candles ahead. The outcome is no longer a mystery, and your analysis becomes influenced by hindsight. This is something most traders experience, and I was no different. As I reviewed more trades, I realized I didn't need another static chart. I needed a way to replay the market as it unfolded: pause before the next candle forms, make a decision using only the information available, and then reveal the next candle to validate the analysis.
Although MetaTrader 5 provides a powerful Strategy Tester for back-testing automated trading systems, it doesn't offer an interactive chart replay environment for discretionary traders who want to manually study price action, practice execution, or replay historical markets candle by candle. This creates an exciting opportunity for MQL5 developers.
In this article, we build an interactive Bar Replay Tool that replays historical price action by revealing one candle at a time and providing an intuitive interface. The tool operates through an ON/OFF menu button that activates replay mode, a draggable replay anchor used to select the historical replay starting point, a playback button for playing and pausing the replay, and Buy and Sell buttons that allow users to place a single imaginary (paper) trade during replay. Together, these controls create a simple yet practical environment for studying price action and practicing discretionary trading without exposing future market data. By the end of this article, you will understand how to:- Build a custom replay engine using DRAW_COLOR_CANDLES to progressively reveal historical candles.
- Dynamically manage the chart's appearance by seamlessly switching between native and custom-rendered candlesticks.
- Implement a draggable replay anchor that defines the replay starting point while providing intuitive play and pause controls.
- Develop a timer-driven replay engine that simulates a semi-live trading environment by revealing candles one at a time.
- Implement an imaginary replay paper trading system using interactive Buy and Sell controls.
- Maintain a consistent replay viewport by automatically keeping the active replay candle in view throughout playback.
Together, these techniques demonstrate how MQL5's event-driven architecture, custom rendering capabilities, and graphical object framework can be leveraged to build chart replay tools that extend far beyond the native functionality of MetaTrader 5.
Project Overview
In this project, we build an interactive bar replay tool that turns historical data into a semi-live simulation on a MetaTrader 5 chart. Rather than displaying the entire price history at once, it progressively reveals candles one at a time, recreating the experience of watching the market unfold in real time. This allows us to replay historical price action, analyze trading decisions, and practice market reading in a controlled environment without exposing future candles. The tool provides an ON/OFF menu button to activate replay mode. In replay mode, a movable vertical anchor sets the starting point and hides candles to the right. A dashboard then provides Play/Pause controls and Buy/Sell buttons for a single paper trade. Below is a visual model of the tool described in this project:
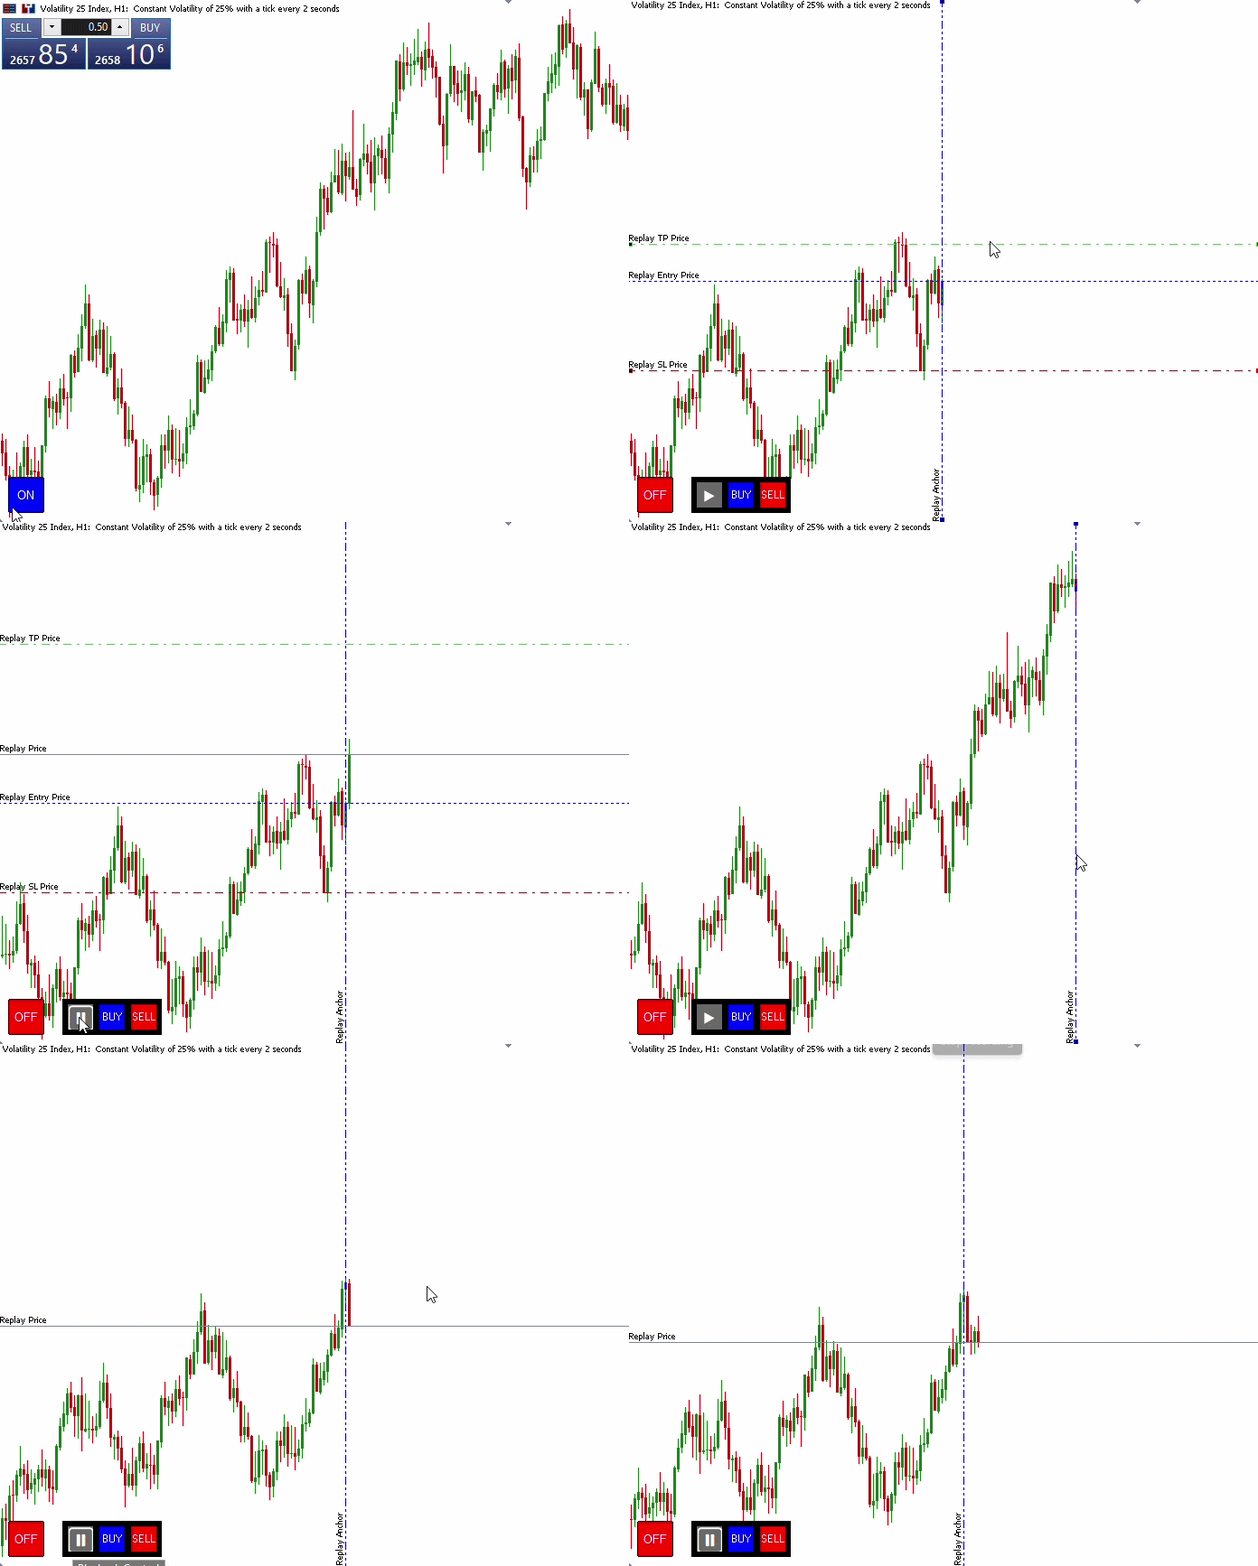
Fig. 1. Project Overview
Design Workflow
Before diving into the implementation, it is important to establish a clear design workflow for the replay system. Breaking the program into well-defined stages simplifies development, makes the implementation easier to follow, and ensures consistent behavior throughout the replay process. From activating replay mode and positioning the replay anchor to progressively revealing historical candles and restoring the chart, each stage is responsible for a specific part of the tool's functionality. Understanding this workflow provides a solid foundation for the implementation that follows.
Initialization
The workflow begins during indicator initialization, where the foundation of the replay system is established. First, the program stores the chart's current visual properties—including bullish and bearish candle colors, bar colors, chart line color, and bid/ask colors—so they can be restored once replay mode is disabled. Next, it creates an ON/OFF menu button that serves as the entry point for activating and deactivating the replay tool. Finally, the indicator initializes its candle buffers and starts a two-second timer, which will later drive the replay engine by progressively revealing historical candles during playback.
Replay Mode Activation
Replay mode begins when the user clicks the ON/OFF menu button, placing the tool into replay mode. Before any replay data is displayed, the program performs a series of initialization steps to prepare both the chart and the replay environment. First, the program enables the chart object deletion event, allowing it to detect if the replay anchor is accidentally removed. If the anchor is deleted, it is automatically recreated to ensure that replay can continue without interruption.
Next, the program determines the current chart viewport and positions a vertical replay anchor at its center. This provides a convenient default replay starting point while allowing the user to reposition the anchor to any historical candle before replay begins. Once the replay anchor has been created, the program displays a compact replay dashboard containing a Play/Pause button for controlling playback, together with Buy and Sell buttons that allow the user to place a single imaginary (paper) trade during replay.
With the replay controls in place, the chart is prepared for custom rendering. The program first hides MetaTrader 5's native candlesticks before drawing its own custom candle representation. Only the candles up to the replay anchor are rendered, while every candle to the right of the anchor remains hidden. This establishes a clean replay starting point, ensuring that no future market information is visible before playback begins.
Replay Paper Trading
To simulate a live trading experience during replay, the tool allows users to place a single imaginary (paper) trade by clicking either the Buy or Sell button. When a trade is opened, the program creates three horizontal lines representing the Entry, Stop Loss (SL), and Take Profit (TP) levels. If another Buy or Sell button is clicked while a replay position is already active, the existing position is automatically replaced with the newly created one.
As the replay progresses, the imaginary position is continuously monitored against each newly revealed candle. Once either the Stop Loss or Take Profit level is reached, the replay position is automatically closed by removing its graphical objects from the chart.
Event-Driven Replay Control
The replay tool adopts an event-driven architecture, with all user interactions managed through the OnChartEvent() function. This central event handler responds to menu button clicks, replay dashboard controls, replay anchor selection, drag-and-drop operations, and chart object deletion events. Whenever the replay anchor is repositioned, the replay view is immediately recalculated so that only candles up to the selected point remain visible.
Timer-Based Candle Replay
Once replay begins, the timer event becomes the driving force behind the replay engine. Triggered every two seconds, it checks whether replay mode is active and then deselects the replay anchor to indicate playback. The next historical candle is revealed by updating the custom candle buffers, while a horizontal price line is simultaneously repositioned to the candle's closing price, creating the effect of a live market unfolding one candle at a time. This process continues until playback is paused or all replay candles have been displayed.
Replay Deactivation
The replay workflow concludes when the user deactivates the system through the ON/OFF menu button. At this point, the program gracefully restores the chart to its original state. It first disables the chart object deletion event, then removes the replay anchor and other replay-related objects. Next, the native MetaTrader 5 candles are restored across the entire chart, while the custom replay candles are cleared, ensuring the chart returns to its normal appearance and behavior.
MQL5 Implementation
Having established the design workflow, we can now translate each stage into a practical MQL5 implementation. We progressively implement its core components, including initialization, menu activation, event-driven interaction, timer-based replay, and replay deactivation.
Compiler Directives
We begin by defining the compiler directives that configure the indicator and its rendering behavior. The #property directives specify the program metadata and configure the DRAW_COLOR_CANDLES plot used for the replay candles.
Next, the #define directives declare constant names for the replay objects, ensuring consistency and easier maintenance throughout the program. Finally, the playback controls use Unicode symbols (▶ and ⏸) to provide intuitive Play and Pause button icons.
//+------------------------------------------------------------------+
//|                                              Bar Replay Tool.mq5 |
//|                                             © 2026, ChukwuBuikem |
//|                             https://www.mql5.com/en/users/bikeen |
//+------------------------------------------------------------------+
#property copyright "© 2026, ChukwuBuikem"
#property link      "https://www.mql5.com/en/users/bikeen"
#property indicator_chart_window
#property indicator_plots 1
#property indicator_buffers 5
#property indicator_type1 DRAW_COLOR_CANDLES
#property indicator_color1 clrGreen,clrRed,clrNONE;
#property indicator_width1 2
#property indicator_label1 "REPLAY: OPEN;REPLAY: HIGH;REPLAY: LOW;REPLAY: CLOSE"

#define _PROG_NAME "Bar Replay Tool"
#define _MENU_BUTTON _PROG_NAME + "MENU_BUTTON"
#define _REPLAY_ANCHORLINE _PROG_NAME + "REPLAY_VLINE"
#define _REPLAY_PRICE _PROG_NAME + "REPLAY_PRICE"
#define _REPLAY_PLAY_BUTTON _PROG_NAME + "REPLAY_PLAY_BUTTON"
#define _REPLAY_DASHBOARD _PROG_NAME + "REPLAY_DASHBOARD"
//--- PLAY AND PAUSE UNICODE SYMBOLS
#define _PLAY_SYMBOL ShortToString(0X25B6)
#define _PAUSE_SYMBOL ShortToString(0X23F8)
//--- REPLAY TRADE MACROS
#define _REPLAY_BUY_BUTTON _PROG_NAME + "REPLAY_BUY_BUTTON"
#define _REPLAY_SELL_BUTTON _PROG_NAME + "REPLAY_SELL_BUTTON"
#define _REPLAY_POSITION_ENTRY _PROG_NAME + "REPLAY_POSITION_ENTRY"
#define _REPLAY_POSITION_TP _PROG_NAME + "REPLAY_POSITION_TP"
#define _REPLAY_POSITION_SL _PROG_NAME + "REPLAY_POSITION_SL"
Custom Data Structure
To simplify chart customization, we begin by defining a custom data structure that stores the chart's original color settings. Its constructor automatically retrieves these properties when the structure is initialized, allowing them to be restored later after replay mode is disabled. The member functions responsible for customizing, restoring, and retrieving chart properties are declared here and will be implemented in subsequent sections.//--- CUSTOM DATA STRUCTURE struct st_ChartInfo { private: color barUpClr; color barDownClr; color bullClr; color bearClr; color lineClr; color askClr; color bidClr; public: //--- st_ChartInfo() { barUpClr = (color)ChartGetInteger(0, CHART_COLOR_CHART_UP); barDownClr = (color)ChartGetInteger(0, CHART_COLOR_CHART_DOWN); bullClr = (color)ChartGetInteger(0, CHART_COLOR_CANDLE_BULL); bearClr = (color)ChartGetInteger(0, CHART_COLOR_CANDLE_BEAR); lineClr = (color)ChartGetInteger(0, CHART_COLOR_CHART_LINE); askClr = (color)ChartGetInteger(0, CHART_COLOR_ASK); bidClr = (color)ChartGetInteger(0, CHART_COLOR_BID); } //--- FUNCTIONS void customize(); void restore(); color getPriceColor(); } chartState;
Global Variables
Next, we declare the global variables that maintain the replay tool's state throughout its execution. These include the custom candle buffers, historical price data, replay status flags, replay anchor information, playback progress, and the variables required to manage the imaginary replay trade.//--- GLOBAL VARIABLES MqlRates myRates[]; double openBuffer[], highBuffer[]; double lowBuffer[], closeBuffer[], colorBuffer[]; bool isPositionOpen = false; bool replayMode = false; bool isPlay = false; datetime vlineTime = 0; int stopBar = INT_MIN; int bars = INT_MIN; int lastCalculated = 0; ENUM_POSITION_TYPE positionType = POSITION_TYPE_BUY; double entryPrice = EMPTY_VALUE, tpPrice = EMPTY_VALUE, slPrice = EMPTY_VALUE; double lastPrice = EMPTY_VALUE;
Helper Functions
To keep the implementation organized and modular, the replay tool is divided into several helper functions, each responsible for a specific task. These functions handle chart configuration, viewport detection, visualization, replay controls, and custom candle rendering.- Chart Configuration
We begin by implementing the member functions declared earlier in the custom data structure. These functions are responsible for customizing the chart during replay, restoring its original appearance when replay ends, and retrieving the chart's original Ask/Bid price color for rendering the replay price line.
//+------------------------------------------------------------------+
//|                     CUSTOMIZE CHART                              |
//+------------------------------------------------------------------+
void st_ChartInfo::customize(void)
  {
//---
   ChartSetInteger(0, CHART_COLOR_CANDLE_BULL, clrNONE);
   ChartSetInteger(0, CHART_COLOR_CANDLE_BEAR, clrNONE);
   ChartSetInteger(0, CHART_COLOR_CHART_UP, clrNONE);
   ChartSetInteger(0, CHART_COLOR_CHART_DOWN, clrNONE);
   ChartSetInteger(0, CHART_COLOR_CHART_LINE, clrNONE);
   ChartSetInteger(0, CHART_COLOR_ASK, clrNONE);
   ChartSetInteger(0, CHART_COLOR_BID, clrNONE);
   ChartRedraw();
  }
//+------------------------------------------------------------------+
//|                        RESTORE CHART SETTINGS                    |
//+------------------------------------------------------------------+
void st_ChartInfo::restore(void)
  {
//---
   ChartSetInteger(0, CHART_COLOR_CANDLE_BULL, bullClr);
   ChartSetInteger(0, CHART_COLOR_CANDLE_BEAR, bearClr);
   ChartSetInteger(0, CHART_COLOR_CHART_UP, barUpClr);
   ChartSetInteger(0, CHART_COLOR_CHART_DOWN, barDownClr);
   ChartSetInteger(0, CHART_COLOR_CHART_LINE, lineClr);
   ChartSetInteger(0, CHART_COLOR_ASK, askClr);
   ChartSetInteger(0, CHART_COLOR_BID, bidClr);
   ChartRedraw();
  }
//+------------------------------------------------------------------+
//|                      OBTAIN PRICE COLOR                          |
//+------------------------------------------------------------------+
color st_ChartInfo::getPriceColor(void)
  {
//---
   return bidClr;
  }
- Viewport Detection
The below function first determines the chart's current viewport. It then calculates the viewport's midpoint and returns the time of the nearest candle, ensuring the result is normalized to a valid candle time that can be used as the default replay starting point.
//+------------------------------------------------------------------+
//|                    VIEWPORT DETECTION                            |
//+------------------------------------------------------------------+
datetime getViewportMiddleTime(void)
  {
//---
   datetime start = 0, end = 0;
   int first = (int) ChartGetInteger(0, CHART_FIRST_VISIBLE_BAR);
   int visibleBars = (int) ChartGetInteger(0, CHART_VISIBLE_BARS);

   int last = first - visibleBars + 2;
   if(last < 0)
      last = 0;

   start = iTime(_Symbol, PERIOD_CURRENT, last);
   end = iTime(_Symbol, PERIOD_CURRENT, first);

   datetime rawMiddleTime = (start + end) / 2;
   int nearestBar = iBarShift(_Symbol, PERIOD_CURRENT, rawMiddleTime, false);
   if(nearestBar < 0)
      return 0;

   return iTime(_Symbol, PERIOD_CURRENT, nearestBar);
  }
- Visualization
The replay interface is constructed using a collection of visualization utility functions that create the program's graphical objects, including the dashboard, control buttons, the interactive anchor line, and the imaginary trade levels. When a Buy or Sell trade is initiated, the program creates the Entry, Stop Loss, and Take Profit levels, with the TP and SL initialized to ±10,000 points from the entry price, providing default trade management levels that can be adjusted by the user.
//+------------------------------------------------------------------+
//|                      BUTTON CREATION                             |
//+------------------------------------------------------------------+
void createButton(const string objName, const int xDistance, const int yDistance,
                  const int xSize, const int ySize, const ENUM_BASE_CORNER corner,
                  const color clr, const color bgClr, const color bdClr, const int fontsize,
                  const string tooltip, const string display, const string font = "Arial")
  {
//---
   if(ObjectFind(0, objName) != -1)
      ObjectDelete(0, objName);

   ObjectCreate(0, objName, OBJ_BUTTON, 0, 0, 0);
   ObjectSetInteger(0, objName, OBJPROP_CORNER, corner);
   ObjectSetInteger(0, objName, OBJPROP_XDISTANCE, xDistance);
   ObjectSetInteger(0, objName, OBJPROP_YDISTANCE, yDistance);
   ObjectSetInteger(0, objName, OBJPROP_XSIZE, xSize);
   ObjectSetInteger(0, objName, OBJPROP_YSIZE, ySize);
   ChartRedraw();
  }
//+------------------------------------------------------------------+
//|                                                                  |
//+------------------------------------------------------------------+
void createDashboard(void)
  {
//---
   if(ObjectCreate(0, _REPLAY_DASHBOARD, OBJ_RECTANGLE_LABEL, 0, 0, 0))
     {
      ObjectSetInteger(0, _REPLAY_DASHBOARD, OBJPROP_XDISTANCE, 70);
      ObjectSetInteger(0, _REPLAY_DASHBOARD, OBJPROP_YDISTANCE, 50);
      ObjectSetInteger(0, _REPLAY_DASHBOARD, OBJPROP_XSIZE, 110);
      ObjectSetInteger(0, _REPLAY_DASHBOARD, OBJPROP_YSIZE, 40);
      //--- CREATE PLAYBACK, BUY, AND SELL BUTTONS
      createButton(_REPLAY_PLAY_BUTTON, 75, 45, 30, 30, CORNER_LEFT_LOWER,
                   clrWhite, clrDimGray, clrBlack, 20, "Playback Control", _PLAY_SYMBOL, "Segoe UI");
      createButton(_REPLAY_BUY_BUTTON, 110, 45, 30, 30, CORNER_LEFT_LOWER,
                   clrWhite, clrBlue, clrBlack, 8, "BUY", "BUY", "Bold");
      createButton(_REPLAY_SELL_BUTTON, 145, 45, 30, 30, CORNER_LEFT_LOWER,
                   clrWhite, clrRed, clrBlack, 8, "SELL", "SELL", "Bold");
      ChartRedraw();
     }
  }
//+------------------------------------------------------------------+
//|                   HORIZONTAL LINE CREATION                       |
//+------------------------------------------------------------------+
void createHLine(const string objName, const double price1, const color clr,
                 const string toolTip = "\n", const bool selected = true,
                 const ENUM_LINE_STYLE style = STYLE_SOLID)
  {
//---
   if(ObjectFind(0, objName) != -1)
      ObjectDelete(0, objName);

   if(ObjectCreate(0, objName, OBJ_HLINE, 0, 0, price1))
     {
      ObjectSetInteger(0, objName, OBJPROP_COLOR, clr);
      ObjectSetInteger(0, objName, OBJPROP_WIDTH, 1);
      ObjectSetInteger(0, objName, OBJPROP_HIDDEN, true);
      ObjectSetInteger(0, objName, OBJPROP_SELECTABLE, true);
      ChartRedraw();
     }
  }
//+------------------------------------------------------------------+
//|                      ANCHOR LINE CREATION                        |
//+------------------------------------------------------------------+
void drawAnchorLine(const string objName, const datetime vTime,
                    const string tooltip = "\n")
  {
//---
   if(ObjectFind(0, objName) != -1)
      ObjectDelete(0, objName);

   if(ObjectCreate(0, objName, OBJ_VLINE, 0, vTime, 0))
     {
      ObjectSetInteger(0, objName, OBJPROP_COLOR, clrBlue);
      ObjectSetInteger(0, objName, OBJPROP_WIDTH, 1);
      ObjectSetInteger(0, objName, OBJPROP_HIDDEN, true);
      ObjectSetInteger(0, objName, OBJPROP_SELECTABLE, true);
      ChartRedraw();
     }
  }
//+------------------------------------------------------------------+
//|                  IMAGINARY REPLAY PAPER TRADE                    |
//+------------------------------------------------------------------+
void showPosition(const double entry, const bool isBuy)
  {
//---
   if(isBuy)
     {
      entryPrice = entry;
      slPrice = entry - (10000 * _Point);
      tpPrice = entry + (10000 * _Point);
      createHLine(_REPLAY_POSITION_ENTRY, entryPrice, clrBlue,
                  "Replay Entry Price", false, STYLE_DOT);
      createHLine(_REPLAY_POSITION_SL, slPrice, clrRed,
                  "Replay SL Price", true, STYLE_DASHDOT);
      createHLine(_REPLAY_POSITION_TP, tpPrice, clrLimeGreen,
                  "Replay TP Price", true, STYLE_DASHDOT);
      positionType = POSITION_TYPE_BUY;
     }
   else
     {
      entryPrice = entry;
      slPrice = entry + (10000 * _Point);
      tpPrice = entry - (10000 * _Point);
      createHLine(_REPLAY_POSITION_ENTRY, entryPrice, clrBlue,
                  "Replay Entry Price", false, STYLE_DOT);
      createHLine(_REPLAY_POSITION_SL, slPrice, clrRed,
                  "Replay SL Price", true, STYLE_DASHDOT);
      createHLine(_REPLAY_POSITION_TP, tpPrice, clrLimeGreen,
                  "Replay TP Price", true, STYLE_DASHDOT);
      positionType = POSITION_TYPE_SELL;
     }
   ChartRedraw();
  }
NOTE: For brevity, the code examples in this section show only the key object properties relevant to the visualization. The remaining properties and complete object configurations are available in the full source code accompanying this article.
- Button Toggle System
The replay workflow is coordinated through two toggle functions that manage the tool's operating states. The menu button enables or disables replay mode by configuring the chart, creating or removing the replay interface, and switching between the native and custom chart appearance. The playback button controls replay execution by toggling between Play and Pause states, while also locking or unlocking the replay anchor and starting or stopping the replay engine.
//+------------------------------------------------------------------+
//|                     TOGGLE MENU BUTTON                           |
//+------------------------------------------------------------------+
void toggleMenuButton(void)
  {
//---
   static bool isMenuOn = false;
   isMenuOn = !isMenuOn;
   if(!isMenuOn)
     {
      ObjectSetInteger(0, _MENU_BUTTON, OBJPROP_BGCOLOR, clrBlue);
      ObjectSetString(0, _MENU_BUTTON, OBJPROP_TEXT, "ON");
      ObjectSetInteger(0, _MENU_BUTTON, OBJPROP_STATE, false);
      //--- RESTORE CHART SETTINGS
      ChartSetInteger(0, CHART_EVENT_OBJECT_DELETE, false);
      ChartSetInteger(0, CHART_SHOW_ONE_CLICK, true);
      ChartSetInteger(0, CHART_SHOW_OBJECT_DESCR, false);
      //--- CLEAR AND RESTORE DEFAULT CANDLE SETTINGS
      ObjectsDeleteAll(0, _PROG_NAME + "REPLAY_");
      customCandles(true, iTime(_Symbol, PERIOD_CURRENT, 0));
      chartState.restore();
      isPositionOpen = false;
      replayMode = false;
     }
   else
     {
      ObjectSetInteger(0, _MENU_BUTTON, OBJPROP_BGCOLOR, clrRed);
      ObjectSetString(0, _MENU_BUTTON, OBJPROP_TEXT, "OFF");
      ObjectSetInteger(0, _MENU_BUTTON, OBJPROP_STATE, false);
      //--- CUSTOMIZE CHART SETTINGS
      ChartSetInteger(0, CHART_EVENT_OBJECT_DELETE, true);
      ChartSetInteger(0, CHART_SHOW_ONE_CLICK, false);
      ChartSetInteger(0, CHART_SHOW_OBJECT_DESCR, true);
      vlineTime = getViewportMiddleTime();
      drawAnchorLine(_REPLAY_ANCHORLINE, vlineTime, "Replay Anchor");
      createDashboard();
      customCandles(true, iTime(_Symbol, PERIOD_CURRENT, 0));
      ChartRedraw();
      //--- CUSTOMIZE CHART
      customCandles(false, vlineTime);
      chartState.customize();
     }
   ChartRedraw();
  }
//+------------------------------------------------------------------+
//|                 TOGGLE PLAYBACK BUTTON                           |
//+------------------------------------------------------------------+
void togglePlayButton(void)
  {
//---
   isPlay = !isPlay;
   if(!isPlay)
     {
      ObjectSetString(0, _REPLAY_PLAY_BUTTON, OBJPROP_TEXT, _PLAY_SYMBOL);
      ObjectSetInteger(0, _REPLAY_PLAY_BUTTON, OBJPROP_STATE, false);
      ObjectSetInteger(0, _REPLAY_ANCHORLINE, OBJPROP_SELECTED, true);
      replayMode = false;
     }
   else
     {
      ObjectSetString(0, _REPLAY_PLAY_BUTTON, OBJPROP_TEXT, _PAUSE_SYMBOL);
      ObjectSetInteger(0, _REPLAY_PLAY_BUTTON, OBJPROP_STATE, false);
      ObjectSetInteger(0, _REPLAY_ANCHORLINE, OBJPROP_SELECTED, false);
      if(ObjectFind(0, _REPLAY_POSITION_ENTRY) != -1)
        {
         //--- DESELECT TP AND SL LEVEL
         ObjectSetInteger(0, _REPLAY_POSITION_SL, OBJPROP_SELECTED, false);
         ObjectSetInteger(0, _REPLAY_POSITION_TP, OBJPROP_SELECTED, false);
        }
      replayMode = true;
     }
   ChartRedraw();
  }
- Custom Replay Candles
At the core of the replay engine is a custom candle rendering system built with DRAW_COLOR_CANDLES. Instead of relying on MetaTrader 5's native candlesticks, the indicator controls exactly which candles are displayed, allowing historical price action to be progressively revealed while future candles remain hidden.
//+------------------------------------------------------------------+
//|                  SHOW OR HIDE CUSTOM REPLAY CANDLES              |
//+------------------------------------------------------------------+
void customCandles(const bool isRemove, const datetime anchorTime)
  {
//---
   static datetime time = 0;
   bars = iBars(_Symbol, PERIOD_CURRENT);
   stopBar = iBarShift(_Symbol, PERIOD_CURRENT, anchorTime);
   if(CopyRates(_Symbol, PERIOD_CURRENT, 0, bars, myRates) > 0)
     {
      for(int w = 0; w < (lastCalculated = ArraySize(myRates) - (stopBar)) && !IsStopped(); w++)
        {
         openBuffer[w] = EMPTY_VALUE;
         highBuffer[w] = EMPTY_VALUE;
         lowBuffer[w] = EMPTY_VALUE;
         closeBuffer[w] = EMPTY_VALUE;
         colorBuffer[w] = 3;

         if(!isRemove)
           {
            openBuffer[w] = myRates[w].open;
            highBuffer[w] = myRates[w].high;
            lowBuffer[w] = myRates[w].low;
            closeBuffer[w] = myRates[w].close;
            colorBuffer[w] = (closeBuffer[w] > openBuffer[w]) ? 0 : 1;
            lastPrice = closeBuffer[w];
           }
        }
      if(!isRemove)
        {
         //--- CREATE REPLAY PRICE LINE
         createHLine(_REPLAY_PRICE, 0, chartState.getPriceColor(), "Replay Price", false);
         ChartRedraw();
        }
     }
  }
//+------------------------------------------------------------------+
//|              REVEAL ONE CUSTOM REPLAY CANDLE                     |
//+------------------------------------------------------------------+
void revealOneCandle(const int prevCalculated)
  {
//---
   if(CopyRates(_Symbol, PERIOD_CURRENT, 0, bars, myRates) > 0)
     {
      openBuffer[prevCalculated] = myRates[prevCalculated].open;
      highBuffer[prevCalculated] = myRates[prevCalculated].high;
      lowBuffer[prevCalculated] = myRates[prevCalculated].low;
      closeBuffer[prevCalculated] = myRates[prevCalculated].close;
      colorBuffer[prevCalculated] = (closeBuffer[prevCalculated] > openBuffer[prevCalculated]) ? 0 : 1;
      lastPrice = closeBuffer[prevCalculated];
      //--- MONITOR REPLAY TRADE SL AND TP HIT
      if(isPositionOpen)
        {
         switch(positionType)
           {
            case POSITION_TYPE_BUY:
               if(highBuffer[prevCalculated] >= tpPrice || lowBuffer[prevCalculated] <= slPrice)
                 {
                  ObjectsDeleteAll(0, _PROG_NAME + "REPLAY_POSITION");
                  Print("Replay buy position closed");
                  PlaySound("ok.wav");
                  isPositionOpen = false;
                 }
               ChartRedraw();
               break;
            case POSITION_TYPE_SELL:
               if(highBuffer[prevCalculated] >= slPrice || lowBuffer[prevCalculated] <= tpPrice)
                 {
                  ObjectsDeleteAll(0, _PROG_NAME + "REPLAY_POSITION");
                  PlaySound("ok.wav");
                  Print("Replay sell position closed");
                  isPositionOpen = false;
                 }
               ChartRedraw();
               break;
           }
        }
      //--- ENSURE REPLAY BAR IS IN VIEW
      int replayBar = iBarShift(_Symbol, PERIOD_CURRENT, myRates[prevCalculated].time);
      int visible = (int)ChartGetInteger(0, CHART_VISIBLE_BARS);
      ChartNavigate(0, CHART_END, -(replayBar - (visible / 4)));
      //--- UPDATE REPLAY PRICE
      ObjectMove(0, _REPLAY_PRICE, 0, 0, closeBuffer[prevCalculated]);
      ChartRedraw();
     }
  }
Explanation:
- customCandle()
This function initializes the replay candles. It copies the chart's historical price data, determines the replay stopping point from the selected anchor, and either displays or hides the custom candles depending on the replay state. Since the indicator buffers are initially filled with EMPTY_VALUE, the function populates them with actual price data up to the anchor replay time when isRemove is set to false, while the buffers beyond the anchor remain EMPTY_VALUE and therefore hidden from view. When replay mode is enabled, it also creates the replay price line used to track the latest replayed closing price. - revealOneCandle()
During playback, this function serves as the core of the replay engine by revealing exactly one new candle at a time. It does this by populating the previously empty indicator-buffer slots with the candle’s price data, making the new candle visible on the chart. In addition to updating the custom candle buffers, it monitors the imaginary replay trade for Take Profit and Stop Loss hits, automatically closes the position when either level is reached, keeps the active replay candle within the visible chart viewport, and updates the replay price line to the latest closing price.
Initialization Logic (OnInit)
With the supporting helper functions in place, we can now implement the standard MQL5 event handlers, beginning with OnInit(). During initialization, the indicator creates the ON/OFF menu button, registers the custom candle buffers, initializes them with empty values, configures the indicator precision, and starts a 2-second timer that drives the replay engine.
//+------------------------------------------------------------------+
//|                      INITIALIZATION FUNCTION                     |
//+------------------------------------------------------------------+
int OnInit()
  {
//---
   createButton(_MENU_BUTTON, 10, 50, 40, 40, CORNER_LEFT_LOWER,
                clrWhite, clrBlue, clrBlack, 10, "Menu Button", "ON");
//--- SET INDICATOR BUFFERS
   SetIndexBuffer(0, openBuffer, INDICATOR_DATA);
   SetIndexBuffer(1, highBuffer, INDICATOR_DATA);
   SetIndexBuffer(2, lowBuffer, INDICATOR_DATA);
   SetIndexBuffer(3, closeBuffer, INDICATOR_DATA);
   SetIndexBuffer(4, colorBuffer, INDICATOR_COLOR_INDEX);

   ArrayInitialize(openBuffer, EMPTY_VALUE);
   ArrayInitialize(highBuffer, EMPTY_VALUE);
   ArrayInitialize(lowBuffer, EMPTY_VALUE);
   ArrayInitialize(closeBuffer, EMPTY_VALUE);

   IndicatorSetInteger(INDICATOR_DIGITS, _Digits);
   EventSetTimer(2);// TWO SECONDS TIMER
   return(INIT_SUCCEEDED);
  }
Cleanup (OnDeinit)
When the indicator is removed from the chart, the OnDeinit() handler performs the necessary cleanup. It stops the replay timer, disables object deletion events, removes all replay-related objects, and restores the chart to its original appearance.
//+------------------------------------------------------------------+
//|                    DEINITIALIZATION FUNCTION                     |
//+------------------------------------------------------------------+
void OnDeinit(const int32_t reason)
  {
//--- KILL TIMER AND RESTORE CHART SETTINGS
   EventKillTimer();
   ChartSetInteger(0, CHART_EVENT_OBJECT_DELETE, false);
   ChartSetInteger(0, CHART_SHOW_ONE_CLICK, true);
   ChartSetInteger(0, CHART_SHOW_OBJECT_DESCR, false);
   ObjectsDeleteAll(0, _PROG_NAME);
   chartState.restore();
   ChartRedraw();
  }
Core Iteration Function
Since the replay tool is driven entirely by OnChartEvent() and OnTimer(), the OnCalculate() function performs no processing and simply returns the total number of available candles.
//+------------------------------------------------------------------+
//|                         ITERATION FUNCTION                       |
//+------------------------------------------------------------------+
int OnCalculate(const int32_t rates_total,
                const int32_t prev_calculated,
                const datetime &time[],
                const double &open[],
                const double &high[],
                const double &low[],
                const double &close[],
                const long &tick_volume[],
                const long &volume[],
                const int32_t &spread[])
  {
//--- NO OPERATION REQUIRED
   return(rates_total);
  }
Interactive Engine
The replay tool is built around the OnChartEvent() handler, which serves as the core interaction engine of the application. It processes every user interaction with the replay interface, including button clicks, drag-and-drop operations, and object deletion events, ensuring that the replay environment responds immediately to user actions while maintaining a consistent replay state.//+------------------------------------------------------------------+ //| CHART EVENT HANDLER | //+------------------------------------------------------------------+ void OnChartEvent(const int32_t id, const long &lparam, const double &dparam, const string &sparam) { //--- switch(id) { //--- OBJECT CLICK (BUTTONS) case CHARTEVENT_OBJECT_CLICK: //--- TOGGLE MENU BUTTON if(sparam == _MENU_BUTTON) { toggleMenuButton(); break; } //--- TOGGLE PLAY BUTTON if(sparam == _REPLAY_PLAY_BUTTON) { togglePlayButton(); break; } //--- BUY BUTTON if(sparam == _REPLAY_BUY_BUTTON) { ObjectSetInteger(0, _REPLAY_BUY_BUTTON, OBJPROP_STATE, false); //--- OPEN REPLAY BUY POSITION showPosition(lastPrice, true); PlaySound("ok.wav"); isPositionOpen = true; ChartRedraw(); break; } //--- SELL BUTTON if(sparam == _REPLAY_SELL_BUTTON) { ObjectSetInteger(0, _REPLAY_SELL_BUTTON, OBJPROP_STATE, false); //--- OPEN REPLAY SELL POSITION showPosition(lastPrice, false); PlaySound("ok.wav"); isPositionOpen = true; ChartRedraw(); break; } //--- DISABLE ANCHOR DESELECTION WHEN IN PLAY MODE if(!ObjectGetInteger(0, _REPLAY_ANCHORLINE, OBJPROP_SELECTED)) { if(ObjectGetString(0, _REPLAY_PLAY_BUTTON, OBJPROP_TEXT) == _PLAY_SYMBOL) ObjectSetInteger(0, _REPLAY_ANCHORLINE, OBJPROP_SELECTED, true); ChartRedraw(); } break; //--- DRAG-AND-DROP OPERATION case CHARTEVENT_OBJECT_DRAG: if(sparam == _REPLAY_ANCHORLINE) { //--- CLEAR CHART ObjectsDeleteAll(0, _PROG_NAME + "REPLAY_POSITION"); customCandles(true, iTime(_Symbol, PERIOD_CURRENT, 0)); vlineTime = (datetime)ObjectGetInteger(0, _REPLAY_ANCHORLINE, OBJPROP_TIME); vlineTime = (vlineTime > iTime(_Symbol, PERIOD_CURRENT, 1)) ? iTime(_Symbol, PERIOD_CURRENT, 1) : vlineTime; ObjectSetInteger(0, _REPLAY_ANCHORLINE, OBJPROP_TIME, vlineTime); //--- SHOW CUSTOM REPLAY CANDLES customCandles(false, vlineTime); isPlay = true; togglePlayButton(); ChartRedraw(); break; } //--- ENSURE REPLAY POSITION SL LEVEL IS PLACED CORRECTLY if(sparam == _REPLAY_POSITION_SL) { if(positionType == POSITION_TYPE_BUY) { if(ObjectGetDouble(0, _REPLAY_POSITION_SL, OBJPROP_PRICE) >= entryPrice) ObjectMove(0, _REPLAY_POSITION_SL, 0, 0, entryPrice - (10000 * _Point)); ChartRedraw(); } else { if(ObjectGetDouble(0, _REPLAY_POSITION_SL, OBJPROP_PRICE) <= entryPrice) ObjectMove(0, _REPLAY_POSITION_SL, 0, 0, entryPrice + (10000 * _Point)); ChartRedraw(); } slPrice = ObjectGetDouble(0, _REPLAY_POSITION_SL, OBJPROP_PRICE); break; } //--- ENSURE REPLAY POSITION TP LEVEL IS PLACED CORRECTLY if(sparam == _REPLAY_POSITION_TP) { if(positionType == POSITION_TYPE_BUY) { if(ObjectGetDouble(0, _REPLAY_POSITION_TP, OBJPROP_PRICE) <= entryPrice) ObjectMove(0, _REPLAY_POSITION_TP, 0, 0, entryPrice + (10000 * _Point)); ChartRedraw(); } else { if(ObjectGetDouble(0, _REPLAY_POSITION_TP, OBJPROP_PRICE) >= entryPrice) ObjectMove(0, _REPLAY_POSITION_TP, 0, 0, entryPrice - (10000 * _Point)); ChartRedraw(); } tpPrice = ObjectGetDouble(0, _REPLAY_POSITION_TP, OBJPROP_PRICE); } break; //--- OBJECT DELETION RESTORATION case CHARTEVENT_OBJECT_DELETE: if(sparam == _REPLAY_ANCHORLINE) { Print("Replay Anchor line deleted. RESTORED"); drawAnchorLine(_REPLAY_ANCHORLINE, vlineTime, "Replay Anchor"); } ChartRedraw(); break; } }
Explanation:
- Button Clicks
The first event handled is CHARTEVENT_OBJECT_CLICK, which processes all button interactions. Clicking the ON/OFF menu button calls toggleMenuButton(), which enables or disables replay mode. When turned ON, it configures the chart for replay, creates the replay anchor line, hides the native MT5 candles, and displays custom candles up to the replay anchor point. When turned OFF, the replay-specific chart configuration is removed and the normal chart view is restored. The Play/Pause button starts or pauses the replay engine. The Buy and Sell buttons create a new imaginary replay trade at the current replay price, automatically replacing any existing replay position before initializing a new one. To preserve the replay workflow, the handler also prevents the replay anchor from being deselected while playback is paused.
- Drag-And-Drop Operations
The CHARTEVENT_OBJECT_DRAG event handles every draggable replay object. When the replay anchor is moved, the program clears the current replay state, recalculates the replay starting point, and redraws the custom replay candles so that only historical candles up to the new anchor remain visible. The same event also manages the Stop Loss and Take Profit levels of the imaginary replay trade, ensuring they cannot be positioned on the wrong side of the entry price while updating their corresponding price values.
-
Object Deletion Restoration
Finally, the CHARTEVENT_OBJECT_DELETE event provides fault tolerance for the replay interface. If the replay anchor is accidentally deleted, the program immediately recreates it at its previous position, ensuring that the replay workflow remains uninterrupted.
is called to add the actual price data to the buffer slot corresponding to the lastCalculated variable. Once the candle is revealed, lastCalculated is incremented by one, allowing the next timer tick to reveal the following candle and advance the replay by one bar.
//+------------------------------------------------------------------+
//|                         TIMER EVENT                              |
//+------------------------------------------------------------------+
void OnTimer(void)
  {
//---
   if(replayMode)
     {
      bars = iBars(_Symbol, PERIOD_CURRENT);
      //--- SAFETY BOUNDARY
      if(lastCalculated >= bars - 1)
        {
         replayMode = false;
         return;
        }
      revealOneCandle(lastCalculated);
      lastCalculated++;
     }
  }
NOTE: The lastCalculated index is incremented because the replay data is stored in non-series order, where the oldest bar has index 0 and newer bars have progressively higher indices. Therefore, replay advances from lower to higher indices, making lastCalculated++ the correct direction for revealing the next candle.
Indicator Testing
Once the program compiles successfully without errors, it is ready for testing. The GIFs below demonstrate the completed Bar Replay Tool in action, highlighting selected features such as anchor movement, paper trade management, multiple play/pause operations, and chart restoration. Together, these examples demonstrate that the replay workflow and its interactive features function as intended. 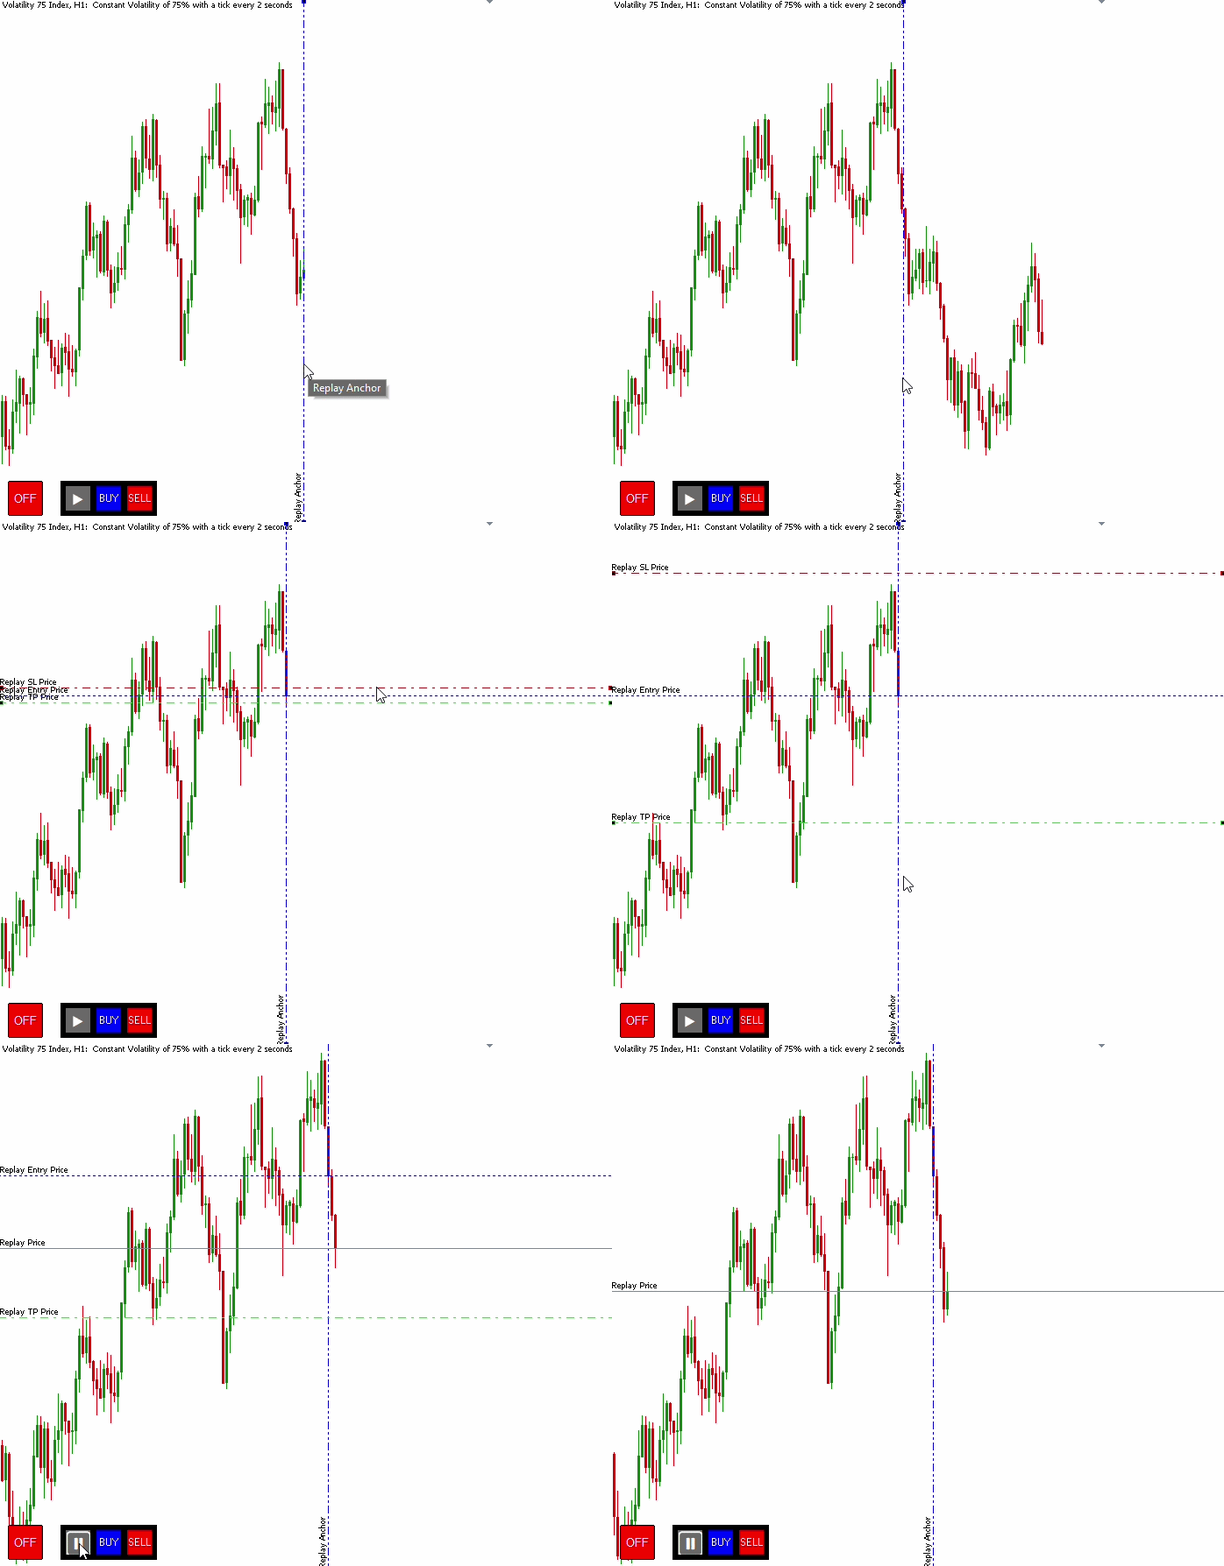
Fig. 2. Test for Anchor Movement and Paper Trade Management
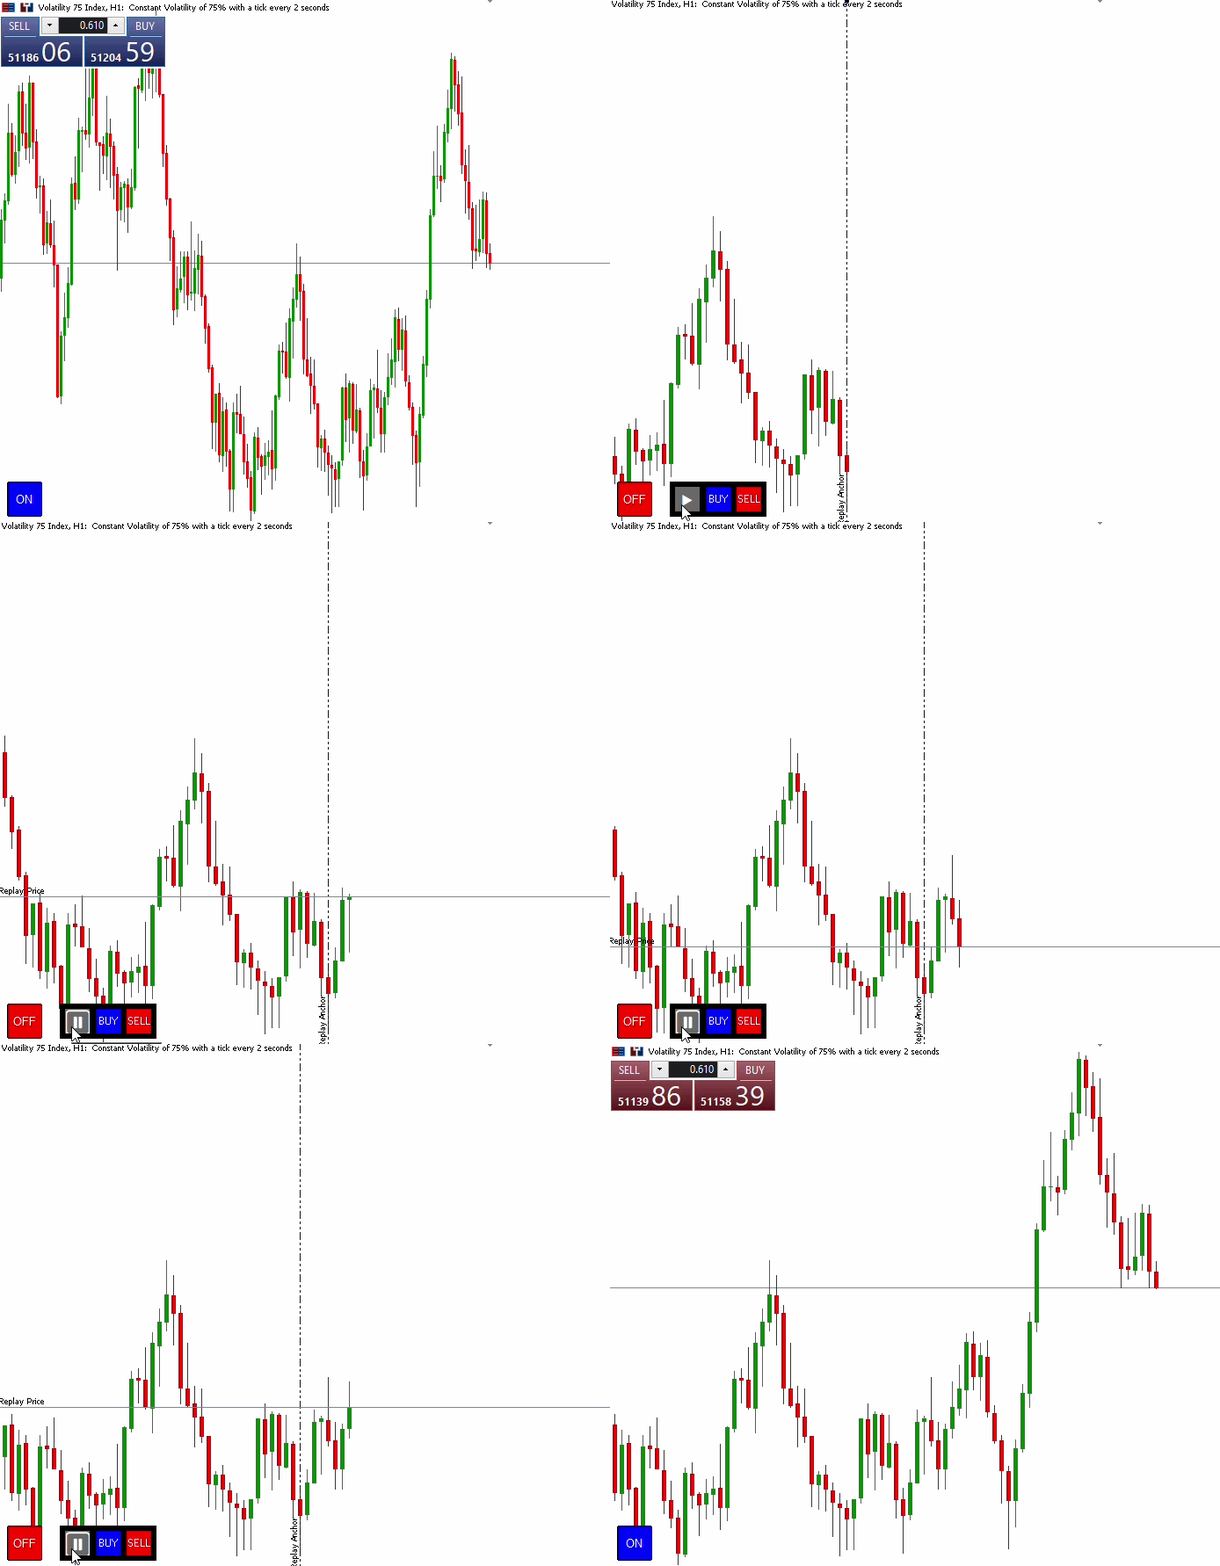
Fig. 3. Test for Multiple Pause/Play and Chart Restoration
Conclusion
We implemented a practical Bar Replay Tool in MQL5 that converts historical price data into a controlled, semi-live simulation on the MetaTrader 5 chart. The indicator demonstrates how to replace native candles with custom DRAW_COLOR_CANDLES rendering, tie a draggable vertical anchor to a replay start point, and drive stepwise playback with OnTimer() while handling all user interactions through OnChartEvent(). The finished artifact is a working indicator that:
- toggles replay mode and reliably restores the chart's original appearance;
- lets the user pick the start candle by dragging an anchor and hides all future candles to the right;
- reveals historical data one candle per timer tick while keeping the active bar visible;
- supports a single paper trade (Buy/Sell) with Entry/SL/TP lines that are monitored and auto‑closed when hit.
Warning: All rights to these materials are reserved by MetaQuotes Ltd. Copying or reprinting of these materials in whole or in part is prohibited.
This article was written by a user of the site and reflects their personal views. MetaQuotes Ltd is not responsible for the accuracy of the information presented, nor for any consequences resulting from the use of the solutions, strategies or recommendations described.

 From Basic to Intermediate: Queues, Lists, and Trees (II)
 Price Action Analysis Toolkit Development (Part 81): Adding Persistent Historical Bookmarks to an MQL5 Navigator
 Market Simulation: Position View (X)
 Market Simulation: Position View (IX)

- Free trading apps
- Over 8,000 signals for copying
- Economic news for exploring financial markets
You agree to website policy and terms of use
Hello Chukwubuikem;
In advance, I have to say thank you for your unique Idea for this article. It is very good but I haven't read all to the end, but the introduction. I first wanted to test it. I dragged the indicator to the chart and the bad point about this indicator is that:
It is obvious that price is going to move in which direction. let me send an screenshot:
It is obvious that the price is going to move up. You should turn off the auto scale of the chart in your indicator, or the user should do that manually.
Hello Chukwubuikem;
It is obvious that the price is going to move up. You should turn off the auto scale of the chart in your indicator, or the user should do that manually.
Thank you for sharing your observation and suggestion. For those who would also like to hide the chart price scale, this can be easily implemented by adding the following lines of code to toggleMenuButton() function presented in the article:
Additionally, add the following line to the deinitialization function to restore the price scale when the indicator is removed: