
Price Action Analysis Toolkit Development (Part 72): Building a Gap Fill Indicator in MQL5

Contents
Introduction
The previous part of this series introduced the weekend gap strategy by mapping the weekly gap zones for future trading reference. Since gap zones are an important part of price action analysis, this provided a useful foundation for understanding how the market behaves around the weekly transition.
This part builds on that foundation by introducing the gap fill signal indicator, which alerts when bullish or bearish gap fills occur and plots arrows on the chart for easy visual reference.
Gap Fill Strategy
What Is a Gap Fill?
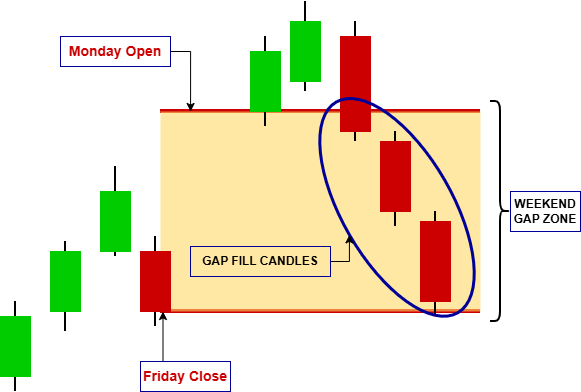
A gap fill occurs when price returns to the unfilled area between Friday’s close and Monday’s open. In simple terms, it represents the market returning to trade through the unbalanced area created at the start of the new trading week.
For this system, gap fills are important because they provide measurable price action events that can be tracked and used for signal generation.
Types of Gap Fills
Gap fills can occur in two main forms depending on the direction of the initial gap:
- Bullish Gap Fill
- Bearish Gap Fill
Bullish Gap Fill
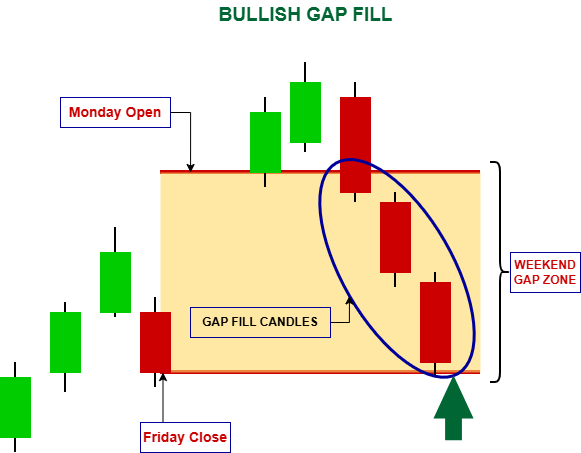
This occurs when the market opens higher and later retraces downward to fill the gap area.
Bearish Gap Fill
This occurs when the market opens lower and later moves upward to close the gap region.
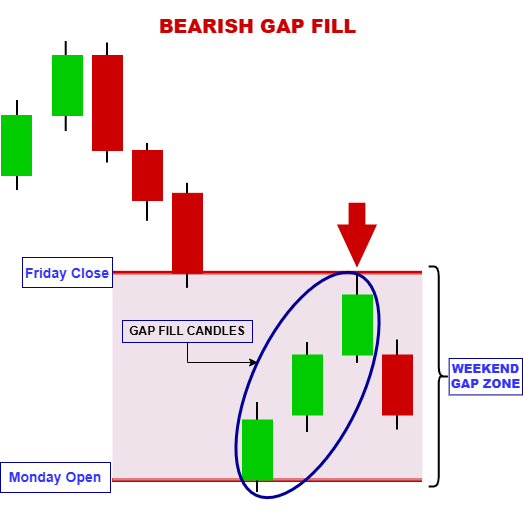
Both scenarios reflect the same underlying concept: price returning to an imbalance created at the weekly open.
Factors Behind Gap Fills
Several market forces can contribute to gap fills:
Market Overreaction
- Weekend news or early-week sentiment can cause exaggerated opening moves. Once liquidity stabilizes, price often corrects part of this initial reaction.
Profit Taking
- Traders who entered positions during the gap move may close trades once targets are reached, creating counter-pressure that pulls price back toward the gap zone.
Technical Levels
- Gaps that form near support or resistance zones tend to attract price reactions. These levels often act as magnets, increasing the likelihood of a retracement into the gap.
Temporary Sentiment Shifts
- If the momentum behind the gap is not sustained, price can lose direction and naturally drift back toward equilibrium.
It is important to understand that gap fills are not guaranteed events. Some gaps fill quickly within a few sessions, while others remain open for extended periods depending on market strength, volatility, and overall trend direction.
Design Overview
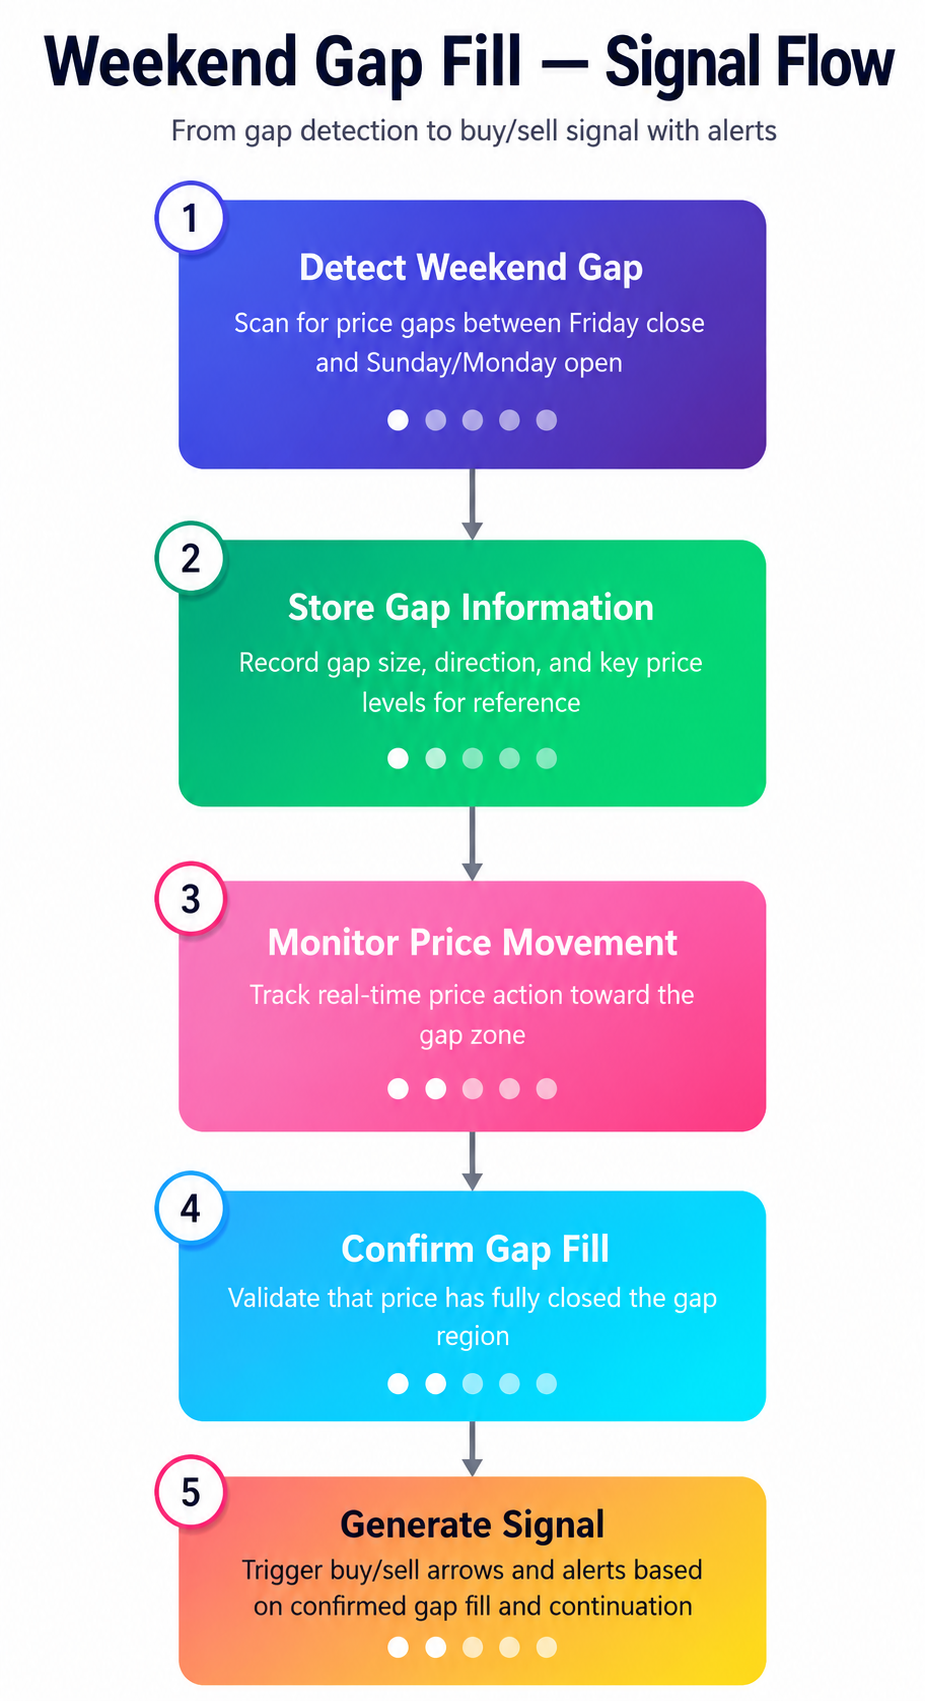
The Gap Fill Signal Indicator follows a workflow that transforms weekend gap activity into actionable trading signals. Each detected gap is tracked until price fully fills the gap, at which point a signal is generated and published through the indicator buffers. Flow Summary
1) Detect Weekend Gap
- Identify price gaps between Friday's close and Monday's open.
- Record the gap boundaries, direction, and tracking status.
- Continuously evaluate price action against the active gap zone.
- Determine when price fully closes the gap and mark it as filled.
- Plot a buy or sell arrow, update indicator buffers, and trigger alerts if enabled.
MQL5 Implementation
In this section, we build the Weekend Gap Signal Indicator from scratch. The indicator detects weekend gaps and tracks their fill status in real time. It outputs clean, non-repainting signals that any Expert Advisor can read via CopyBuffer(). We also add visual feedback (rectangles, state-dependent colors, week separators, and signal arrows). In addition, we add configurable alerts (popup, sound, push, and email). Let us walk through every component in the order they appear in the code.
Indicator Properties and Input Parameters
We begin with the standard #property directives that define the indicator's behavior and appearance. The indicator runs in the chart window and uses four buffers — two for plotting buy/sell arrows and two for auxiliary data. The arrow plots are configured with codes 233 (up) and 234 (down) to give clear visual cues.
//+------------------------------------------------------------------+
//|                                    WeekendGapSignalIndicator.mq5 |
//|                              Copyright 2026, Christian Benjamin. |
//|                           https://www.mql5.com/en/users/lynchris |
//+------------------------------------------------------------------+
#property copyright "Copyright 2026, Christian Benjamin."
#property link      "https://www.mql5.com/en/users/lynchris"
#property version   "1.0"
#property indicator_chart_window
#property indicator_buffers 4
#property indicator_plots   2

//--- Buy arrow plot
#property indicator_label1  "Buy"
#property indicator_type1   DRAW_ARROW
#property indicator_color1  clrDodgerBlue
#property indicator_width1  2

//--- Sell arrow plot
#property indicator_label2  "Sell"
#property indicator_type2   DRAW_ARROW
#property indicator_color2  clrRed
#property indicator_width2  2

//--- arrow codes
#define ARROW_UP   233
#define ARROW_DOWN 234
The input block exposes all configurable options to the user, including whether historical gaps should be displayed, the maximum number of weeks to analyze, and the minimum gap size in pips. It also provides visual customization options such as active and historical gap colors, rectangle fill opacity, font sizes, and arrow sizes, as well as a switch to invert signal logic. In addition, alert settings are included to enable popup notifications, sound alerts, push notifications, and email alerts. All inputs are stored as global variables and referenced throughout the indicator logic to maintain consistency and flexibility.
//--- input parameters
input bool     ShowHistoricalGaps   = true;        // Show historical gaps (visual only)
input int      MaxHistoricalWeeks    = 26;          // Max weeks to look back
input double   MinGapPips            = 0.5;         // Minimum gap size in pips
input bool     ShowDetailedLabels    = true;        // Show extra price labels
input color    ActiveFillColor       = clrGainsboro;
input color    ActiveOutlineColor    = clrDimGray;
input color    ReactionColor         = clrDarkOrange;
input color    MemoryOutlineColor    = clrSilver;
input int      ActiveFillOpacity     = 50;          // Rectangle fill opacity (0-100)
input int      LineWidth             = 2;
input int      FontSize              = 7;
input int      ArrowSize             = 2;
input bool     InvertSignals         = false;       // Invert buy/sell logic

//--- week separator inputs
input bool     DrawWeekSeparators    = true;        // Draw vertical lines between weeks
input color    WeekSeparatorColor    = clrGray;     // Color of week separator lines
input int      WeekSeparatorStyle    = STYLE_DASH;  // Line style

//--- arrow color inputs
input color    BuyArrowColor         = clrDodgerBlue; // Buy arrows (chart objects)
input color    SellArrowColor        = clrRed;        // Sell arrows (chart objects)

//--- alert inputs
input bool     EnableAlerts          = true;        // Enable popup alerts on gap fills
input bool     EnableSound           = false;       // Play sound on fill
input string   SoundFile             = "alert.wav"; // Sound file name
input bool     EnableNotification    = false;       // Send push notification
input bool     EnableEmail           = false;       // Send email
A particularly useful parameter is InvertSignals. Some traders interpret a filled gap as a potential reversal rather than a continuation of the prevailing move. This single switch allows an Expert Advisor to test both interpretations without altering the indicator’s core logic, enabling flexible strategy experimentation and comparison.
EA‑Compatible Buffer Architecture
One of the primary design goals is to ensure the indicator can be safely used by Expert Advisors without repainting. To achieve this, four indicator buffers are declared. BufferBuy and BufferSell store the actual trading signals, specifically the fill price at the bar index where the gap is confirmed as filled. The additional buffers, BufferGapState and BufferFillPrice, serve as auxiliary data sources for more advanced EA logic, allowing access to the gap state enumeration and exact fill price for further filtering or decision-making.
//--- EA signal buffers (exposed via CopyBuffer)
double BufferBuy[];          // Buy signals: fill price at bar index
double BufferSell[];         // Sell signals: fill price at bar index
double BufferGapState[];     // Gap state at bar (for EA, 0..4)
double BufferFillPrice[];    // Fill price at bar (optional)
In OnInit(), the indicator buffers are bound using SetIndexBuffer(). All buffers are then configured with ArraySetAsSeries(..., false), ensuring that index 0 corresponds to the oldest bar. This aligns the buffer indexing with the standard (non-series) data order used in OnCalculate() and helps avoid common off-by-one indexing errors.
Each buffer is subsequently initialized with EMPTY_VALUE to ensure a clean state before calculations begin. The arrow plots are also configured to have no connecting lines by setting clrNONE, and the arrow symbols are assigned using PlotIndexSetInteger() with the appropriate arrow codes.
//+------------------------------------------------------------------+
//| Custom indicator initialization                                  |
//+------------------------------------------------------------------+
int OnInit()
  {
   //--- Set indicator buffers (EA accessible)
   SetIndexBuffer(0, BufferBuy, INDICATOR_DATA);
   SetIndexBuffer(1, BufferSell, INDICATOR_DATA);
   SetIndexBuffer(2, BufferGapState, INDICATOR_CALCULATIONS);
   SetIndexBuffer(3, BufferFillPrice, INDICATOR_CALCULATIONS);

   //--- Arrow plotting properties
   PlotIndexSetInteger(0, PLOT_ARROW, ARROW_UP);
   PlotIndexSetInteger(1, PLOT_ARROW, ARROW_DOWN);
   PlotIndexSetInteger(0, PLOT_LINE_COLOR, clrNONE);
   PlotIndexSetInteger(1, PLOT_LINE_COLOR, clrNONE);

   //--- Set series indexing (oldest at 0)
   ArraySetAsSeries(BufferBuy, false);
   ArraySetAsSeries(BufferSell, false);
   ArraySetAsSeries(BufferGapState, false);
   ArraySetAsSeries(BufferFillPrice, false);

   //--- Initialize buffers to EMPTY_VALUE
   ArrayInitialize(BufferBuy, EMPTY_VALUE);
   ArrayInitialize(BufferSell, EMPTY_VALUE);
   ArrayInitialize(BufferGapState, EMPTY_VALUE);
   ArrayInitialize(BufferFillPrice, EMPTY_VALUE);
Core Data Structures
Two primary structures are used to manage gap tracking.
WeekendGapRecord stores complete information about each detected gap, including the Monday start time, upper and lower gap boundaries, midpoint, a bool indicating whether it is a gap down, the current state (fresh, partial, reaction, filled, or historical), a flag indicating whether the gap belongs to the active week, the fill time and fill price, a signal-published flag to prevent duplicate signals, the bar index at which the fill occurred, and a lastScanBar field used to optimize historical reconstruction. It encapsulates the full lifecycle of a gap, from detection through fill confirmation to final signal generation.
//--- Gap data structure (full record)
struct WeekendGapRecord
  {
   datetime          startTime;
   datetime          endTime;
   double            gapHigh;
   double            gapLow;
   double            midpoint;
   bool              isGapDown;
   ENUM_GAP_STATE    state;
   bool              activeWeek;
   datetime          fillTime;
   double            fillPrice;
   bool              signalPublished;
   int               fillBarIndex;
   int               lastScanBar;
  };
The second structure, ActiveGap, is a lightweight representation used only for gaps that remain unfilled and are actively monitored in real time. It stores the index into the main m_gaps[] array, the last processed bar index to prevent redundant calculations, a bool indicating whether the gap is bullish (gap up), the high and low boundaries, the start time, the current state, and a flag indicating whether a signal has already been published. This streamlined design improves performance by ensuring that only a small subset of gaps is processed on each new bar.
//--- Active gap tracking
struct ActiveGap
  {
   int               gapIndex;
   int               lastUpdateBar;
   bool              isBull;
   double            gapHigh, gapLow;
   datetime          startTime;
   ENUM_GAP_STATE    state;
   bool              signalPublished;
  };
Visual settings are also stored in a global VisualSettings structure, which groups parameters such as colors, opacity, line width, and font size. This design simplifies function interfaces by allowing these settings to be passed as a single structured object, reducing parameter clutter and improving code maintainability.
The Gap State Machine
Before implementing the detection logic, the possible gap states are defined using the ENUM_GAP_STATE enumeration. It includes five values: GAP_FRESH, indicating a newly formed gap with no price interaction; GAP_PARTIAL, where price has entered the gap but has not reached the opposite boundary; GAP_REACTION, where price has moved beyond the opposite edge (for example, above the high of a gap up); GAP_FILLED, indicating that the gap has been fully filled and a trading signal is generated; and GAP_HISTORICAL, used for past gaps that are displayed for reference only and are not actively monitored.
//--- Enum for gap state
enum ENUM_GAP_STATE
  {
   GAP_FRESH = 0,
   GAP_PARTIAL = 1,
   GAP_REACTION = 2,
   GAP_FILLED = 3,
   GAP_HISTORICAL = 4
  };
State transitions are evaluated on every new bar using the closing price. For a gap down, if the current close is above gapHigh, the gap is considered filled; if the price is between gapLow and gapHigh, it is marked as partial; and if it is at or below gapLow, it is classified as a reaction. For a gap up, the logic is reversed. These rules are intentionally simple yet effective, and they can be extended to use high and low prices instead of closes for more sensitive intra-bar detection if required.
Initialization and Cleanup
OnInit() performs more than basic buffer initialization. It copies the user-defined visual parameters into the global m_vis structure and creates an optional ATR handle using iATR() for future enhancements, such as filtering out gaps smaller than a multiple of the current ATR to avoid low-volatility conditions. The handle is stored globally, and INVALID_HANDLE is checked to ensure proper creation; if it fails, a warning is logged without interrupting initialization.
//+------------------------------------------------------------------+
//| initialization                                                   |
//+------------------------------------------------------------------+
int OnInit()
  {
//--- Set indicator buffers (EA accessible)
   SetIndexBuffer(0, BufferBuy, INDICATOR_DATA);
   SetIndexBuffer(1, BufferSell, INDICATOR_DATA);
   SetIndexBuffer(2, BufferGapState, INDICATOR_CALCULATIONS);
   SetIndexBuffer(3, BufferFillPrice, INDICATOR_CALCULATIONS);

//--- Arrow plotting properties
   PlotIndexSetInteger(0, PLOT_ARROW, ARROW_UP);
   PlotIndexSetInteger(1, PLOT_ARROW, ARROW_DOWN);
   PlotIndexSetInteger(0, PLOT_LINE_COLOR, clrNONE);
   PlotIndexSetInteger(1, PLOT_LINE_COLOR, clrNONE);

//--- Set series indexing (oldest at 0)
   ArraySetAsSeries(BufferBuy, false);
   ArraySetAsSeries(BufferSell, false);
   ArraySetAsSeries(BufferGapState, false);
   ArraySetAsSeries(BufferFillPrice, false);

//--- Initialize buffers to EMPTY_VALUE
   ArrayInitialize(BufferBuy, EMPTY_VALUE);
   ArrayInitialize(BufferSell, EMPTY_VALUE);
   ArrayInitialize(BufferGapState, EMPTY_VALUE);
   ArrayInitialize(BufferFillPrice, EMPTY_VALUE);

//--- Visual settings
   m_vis.activeFillColor    = ActiveFillColor;
   m_vis.activeOutlineColor = ActiveOutlineColor;
   m_vis.reactionColor      = ReactionColor;
   m_vis.memoryOutlineColor = MemoryOutlineColor;
   m_vis.activeFillOpacity  = ActiveFillOpacity;
   m_vis.lineWidth          = LineWidth;
   m_vis.fontSize           = FontSize;

//--- Optional ATR handle (for future expansion)
   atrHandle = iATR(_Symbol, PERIOD_CURRENT, 14);
   if(atrHandle == INVALID_HANDLE)
      Print("Warning: ATR handle creation failed");

   m_firstRun = true;
   return INIT_SUCCEEDED;
  }
In OnDeinit(), the ATR handle is released using IndicatorRelease() if it is valid. All chart objects with names starting with "WG_" are removed via a dedicated cleanup function. In addition, the dynamic arrays m_gaps[] and activeGaps[] are freed to prevent memory leaks. This cleanup ensures proper resource management and stable indicator behavior.
//+------------------------------------------------------------------+
//| Deinitialization                                                 |
//+------------------------------------------------------------------+
void OnDeinit(const int reason)
  {
   if(atrHandle != INVALID_HANDLE)
      IndicatorRelease(atrHandle);
   DeleteWGObjects();
   ArrayFree(m_gaps);
   ArrayFree(activeGaps);
  }
The Main Calculation Loop — Two‑Phase Processing
OnCalculate() is the core function of the indicator. It receives price and time arrays for all bars currently loaded on the chart, while the prev_calculated parameter is used to distinguish between the initial run and incremental updates.
Regardless of the execution phase, the first step is to reset the indicator buffers for all bars being recalculated. This is done by iterating from prev_calculated to rates_total - 1 and assigning EMPTY_VALUE to each buffer element. This step is essential for maintaining non-repainting behavior, as it clears any previously calculated values that may have been based on incomplete data before new confirmed values are written.
//+------------------------------------------------------------------+
//| Main calculation loop (EA-compatible)                            |
//+------------------------------------------------------------------+
int OnCalculate(const int rates_total,
                const int prev_calculated,
                const datetime &time[],
                const double &open[],
                const double &high[],
                const double &low[],
                const double &close[],
                const long &tick_volume[],
                const long &volume[],
                const int &spread[])
  {
   if(rates_total < 2)
      return 0;

   //--- For each new bar (from prev_calculated onward), reset buffers to prevent repainting
   for(int i = prev_calculated; i < rates_total; i++)
     {
      BufferBuy[i]       = EMPTY_VALUE;
      BufferSell[i]      = EMPTY_VALUE;
      BufferGapState[i]  = EMPTY_VALUE;
      BufferFillPrice[i] = EMPTY_VALUE;
     }
When prev_calculated == 0, the indicator enters its first-run phase. It begins by calling DetectAllGaps() to scan the available price history and build the m_gaps[] array. Next, ComputeHistoricalFills() reconstructs past gap fill events using only closed historical bars, ensuring non-repainting results. Any gap already marked as filled is then passed to PublishSignal() with the isHistorical flag set to true, allowing the signal to be written to the appropriate buffer at the exact fill bar while suppressing alerts for historical events. The indicator subsequently adds all unfilled gaps to the activeGaps[] array through AddNewGapToActive(). When ShowHistoricalGaps is enabled, it also creates the associated visual objects, including rectangles, labels, and week separators, by calling CreateGapObjects() for each detected gap.
//--- First run: full historical scan, fill reconstruction, and active gap initialization
   if(prev_calculated == 0)
     {
      //--- 1. Detect all historical and current gaps
      DetectAllGaps();

      //--- 2. Reconstruct historical fills (scan past price action)
      ComputeHistoricalFills();

      //--- 3. Publish all historical signals into buffers (for backtesting)
      //--- No alerts for historical fills
      for(int g = 0; g < ArraySize(m_gaps); g++)
        {
         if(m_gaps[g].state == GAP_FILLED &&
            m_gaps[g].fillBarIndex >= 0 &&
            m_gaps[g].fillBarIndex < rates_total)
           {
            PublishSignal(g, m_gaps[g].fillBarIndex, m_gaps[g].fillPrice, true);
           }
        }

      //--- 4. Build active gaps list for those not yet filled
      for(int g = 0; g < ArraySize(m_gaps); g++)
        {
         if(m_gaps[g].state != GAP_FILLED)
            AddNewGapToActive(g);
        }

      //--- 5. Create visual objects (only if needed, EA doesn't rely on them)
      if(ShowHistoricalGaps)
        {
         for(int g = 0; g < ArraySize(m_gaps); g++)
            CreateGapObjects(m_gaps[g], PrefixForIndex(g));
        }

      m_firstRun = false;
      return rates_total;
     }
When prev_calculated > 0, the indicator operates in incremental update mode. The number of newly available bars is calculated as newBars = rates_total - prev_calculated. A value less than or equal to zero indicates that no new bars have arrived, in which case the function returns immediately. Otherwise, each newly formed bar is processed through UpdateActiveGaps() to evaluate state transitions and detect gap fill events. The indicator then scans the most recent section of price history (up to 100 bars) for newly formed weekend gaps. This additional check accounts for situations where a gap may have formed while MetaTrader was closed during a weekend or extended market break. When a previously unknown gap is detected, a new record is created and added to m_gaps[]. Gaps that remain unfilled are also registered in the active monitoring list, and their associated visual objects are created when historical gap display is enabled.
//--- Incremental update: only new bars have arrived
   int newBars = rates_total - prev_calculated;
   if(newBars <= 0)
      return rates_total;

//--- For each newly arrived bar, update active gaps (check fills, state changes)
   for(int bar = prev_calculated; bar < rates_total; bar++)
     {
      UpdateActiveGaps(bar, high, low, close, time);
     }

//--- Also check for newly formed weekend gaps on the latest bar (if Monday open)
   int scanStart = MathMax(0, rates_total - 100);
   for(int i = scanStart; i < rates_total - 1; i++)
     {
      double diffSeconds = (double)(time[i + 1] - time[i]);
      if(diffSeconds >= 172800)
        {
         double fridayClose = close[i];
         double mondayOpen  = open[i + 1];
         double gapPips     = MathAbs(mondayOpen - fridayClose) / PipSize();

         if(gapPips >= MinGapPips)
           {
            bool exists = false;
            for(int g = 0; g < ArraySize(m_gaps); g++)
              {
               if(m_gaps[g].startTime == time[i + 1])
                 {
                  exists = true;
                  break;
                 }
              }

            if(!exists)
              {
               WeekendGapRecord newGap;
               newGap.startTime       = time[i + 1];
               newGap.endTime         = GetNextMondayOpen(time[i + 1]);
               newGap.gapHigh         = MathMax(mondayOpen, fridayClose);
               newGap.gapLow          = MathMin(mondayOpen, fridayClose);
               newGap.midpoint        = (newGap.gapHigh + newGap.gapLow) / 2.0;
               newGap.isGapDown       = (fridayClose > mondayOpen);
               newGap.activeWeek      = (GetWeekMonday(time[i + 1]) == GetWeekMonday(TimeCurrent()));
               newGap.state           = newGap.activeWeek ? GAP_FRESH : GAP_HISTORICAL;
               newGap.fillTime        = 0;
               newGap.fillPrice       = 0;
               newGap.signalPublished = false;
               newGap.fillBarIndex    = -1;
               newGap.lastScanBar     = 0;

               int idx = ArraySize(m_gaps);
               ArrayResize(m_gaps, idx + 1);
               m_gaps[idx] = newGap;

               if(newGap.state != GAP_FILLED)
                  AddNewGapToActive(idx);

               if(ShowHistoricalGaps)
                  CreateGapObjects(m_gaps[idx], PrefixForIndex(idx));
              }
           }
        }
     }

   return rates_total;
  }
Detecting All Gaps
The DetectAllGaps() function begins by copying the time, open, and close arrays from the chart using CopyTime(), CopyOpen(), and CopyClose(). These arrays are configured as series (newest first), making it easier to process the data in descending time order. The function then iterates backward through the available bars, comparing each bar with its predecessor. A weekend gap is detected when the time difference between two consecutive bars is at least 48 hours (172800 seconds). At that point, the Friday close from the older bar and the Monday open from the newer bar are extracted, and the gap size is calculated in pips using PipSize(). Whenever the gap size meets the MinGapPips threshold, a new WeekendGapRecord is created, populated, and appended to the m_gaps[] array. The function also determines whether the gap belongs to the current trading week by comparing its Monday start time with the Monday corresponding to TimeCurrent().
//+------------------------------------------------------------------+
//| Detect all gaps (historical and current)                         |
//+------------------------------------------------------------------+
void DetectAllGaps()
  {
   ArrayResize(m_gaps, 0);
   int bars = Bars(_Symbol, _Period);
   if(bars < 2)
      return;

   datetime timeArr[];
   double openArr[], closeArr[];
   ArraySetAsSeries(timeArr, true);
   ArraySetAsSeries(openArr, true);
   ArraySetAsSeries(closeArr, true);

   if(CopyTime(_Symbol, _Period, 0, bars, timeArr) <= 0)
      return;
   if(CopyOpen(_Symbol, _Period, 0, bars, openArr) <= 0)
      return;
   if(CopyClose(_Symbol, _Period, 0, bars, closeArr) <= 0)
      return;

   double pip = PipSize();
   int limit = MathMin(bars - 1, 10000);
   datetime currentWeek = GetWeekMonday(TimeCurrent());

   for(int i = 1; i < limit; i++)
     {
      double diffSeconds = (double)(timeArr[i - 1] - timeArr[i]);
      if(diffSeconds >= 172800)
        {
         double fridayClose = closeArr[i];
         double mondayOpen  = openArr[i - 1];
         double gapPips     = MathAbs(mondayOpen - fridayClose) / pip;

         if(gapPips >= MinGapPips)
           {
            WeekendGapRecord gap;
            gap.startTime       = timeArr[i - 1];
            gap.endTime         = GetNextMondayOpen(timeArr[i - 1]);
            gap.gapHigh         = MathMax(mondayOpen, fridayClose);
            gap.gapLow          = MathMin(mondayOpen, fridayClose);
            gap.midpoint        = (gap.gapHigh + gap.gapLow) / 2.0;
            gap.isGapDown       = (fridayClose > mondayOpen);
            gap.activeWeek      = (GetWeekMonday(timeArr[i - 1]) == currentWeek);
            gap.state           = gap.activeWeek ? GAP_FRESH : GAP_HISTORICAL;
            gap.fillTime        = 0;
            gap.fillPrice       = 0;
            gap.signalPublished = false;
            gap.fillBarIndex    = -1;
            gap.lastScanBar     = 0;

            int size = ArraySize(m_gaps);
            ArrayResize(m_gaps, size + 1);
            m_gaps[size] = gap;
           }
        }
     }

   Print("Weekend Gap Indicator: Detected ", ArraySize(m_gaps), " gaps.");
  }
During the initial execution, the function performs a comprehensive scan of the available price history. Performance is controlled by limiting the search to a maximum of 10,000 bars.
Reconstructing Historical Fills
Once all gaps have been detected, the next step is to determine which ones were filled historically. The ComputeHistoricalFills() function performs this reconstruction in a non-repainting manner. It processes gaps that remain unfilled and do not belong to the active trading week, meaning they originate from prior weeks. For each gap, the function copies the high, low, and time arrays between the gap’s start time and the current time using CopyHigh(), CopyLow(), and CopyTime(). These arrays are configured in non-series order (oldest first) to support forward scanning through historical data. The scan begins at the gap’s lastScanBar position, providing an optimization that allows processing to resume from the previous stopping point should the function be executed again, although the current implementation calls it only once during initialization.
//+------------------------------------------------------------------+
//| Scan historical price action to find fills for past gaps         |
//+------------------------------------------------------------------+
void ComputeHistoricalFills()
  {
   for(int g = 0; g < ArraySize(m_gaps); g++)
     {
      if(m_gaps[g].state == GAP_FILLED)
         continue;
      if(m_gaps[g].activeWeek)
         continue;

      datetime from = m_gaps[g].startTime;
      datetime to   = TimeCurrent();
      int startBar  = m_gaps[g].lastScanBar;

      double high[], low[];
      datetime timeHist[];
      if(CopyHigh(_Symbol, _Period, from, to, high) <= 0)
         continue;
      if(CopyLow(_Symbol, _Period, from, to, low) <= 0)
         continue;
      if(CopyTime(_Symbol, _Period, from, to, timeHist) <= 0)
         continue;

      ArraySetAsSeries(high, false);
      ArraySetAsSeries(low, false);
      ArraySetAsSeries(timeHist, false);

      for(int i = startBar; i < ArraySize(timeHist); i++)
        {
         if(timeHist[i] < from)
            continue;

         if(m_gaps[g].isGapDown)
           {
            if(high[i] >= m_gaps[g].gapHigh)
              {
               m_gaps[g].state         = GAP_FILLED;
               m_gaps[g].fillTime      = timeHist[i];
               m_gaps[g].fillPrice     = m_gaps[g].gapHigh;
               m_gaps[g].fillBarIndex  = FindBarIndexByTime(timeHist[i], timeHist);
               break;
              }
           }
         else
           {
            if(low[i] <= m_gaps[g].gapLow)
              {
               m_gaps[g].state         = GAP_FILLED;
               m_gaps[g].fillTime      = timeHist[i];
               m_gaps[g].fillPrice     = m_gaps[g].gapLow;
               m_gaps[g].fillBarIndex  = FindBarIndexByTime(timeHist[i], timeHist);
               break;
              }
           }

         m_gaps[g].lastScanBar = i + 1;
        }
     }
  }
For a gap down (isGapDown == true), the function checks whether any bar's high reaches or exceeds gapHigh. Conversely, for a gap up, it verifies whether any bar's low reaches or falls below gapLow. Once a fill condition is detected, the gap state is updated to GAP_FILLED, and the corresponding fill time, fill price (the boundary that was touched), and bar index are recorded using FindBarIndexByTime(). The scan then terminates for that gap because the fill has already been confirmed. Since this reconstruction relies exclusively on historical data that does not change, the results remain deterministic and non-repainting.
Real‑Time Active Gap Monitoring
UpdateActiveGaps() is the core routine executed whenever a new bar becomes available. It processes the activeGaps[] array in reverse order, a common technique that allows elements to be removed safely during iteration. For each entry, the function retrieves the corresponding gap index and accesses the associated record in m_gaps[]. Gaps already marked as filled are removed from the active list and skipped, although such cases are expected to be rare because filled gaps are normally removed immediately after detection. The function also ignores bars whose timestamps precede the gap's start time, as the gap has not yet formed at that point in the price history.
//+------------------------------------------------------------------+
//| Update all active gaps based on new bar data                     |
//+------------------------------------------------------------------+
void UpdateActiveGaps(int newBarIdx, const double &high[], const double &low[], const double &close[], const datetime &time[])
  {
   for(int a = ArraySize(activeGaps) - 1; a >= 0; a--)
     {
      int gapIdx = activeGaps[a].gapIndex;

      if(m_gaps[gapIdx].state == GAP_FILLED)
        {
         RemoveActiveGap(a);
         continue;
        }

      if(time[newBarIdx] < m_gaps[gapIdx].startTime)
         continue;

      double currentPrice = close[newBarIdx];
      bool isGapDown      = m_gaps[gapIdx].isGapDown;
      double gHigh        = m_gaps[gapIdx].gapHigh;
      double gLow         = m_gaps[gapIdx].gapLow;
      ENUM_GAP_STATE newState = m_gaps[gapIdx].state;

      if(isGapDown)
        {
         if(currentPrice > gHigh)
            newState = GAP_FILLED;
         else
            if(currentPrice > gLow && currentPrice <= gHigh)
               newState = (newState == GAP_FRESH || newState == GAP_REACTION) ? GAP_PARTIAL : newState;
            else
               if(currentPrice <= gLow)
                  newState = GAP_REACTION;
        }
      else
        {
         if(currentPrice < gLow)
            newState = GAP_FILLED;
         else
            if(currentPrice >= gLow && currentPrice < gHigh)
               newState = (newState == GAP_FRESH || newState == GAP_REACTION) ? GAP_PARTIAL : newState;
            else
               if(currentPrice >= gHigh)
                  newState = GAP_REACTION;
        }

      if(newState != m_gaps[gapIdx].state)
        {
         m_gaps[gapIdx].state   = newState;
         activeGaps[a].state    = newState;

         if(newState == GAP_FILLED)
           {
            m_gaps[gapIdx].fillTime      = time[newBarIdx];
            m_gaps[gapIdx].fillPrice     = isGapDown ? gHigh : gLow;
            m_gaps[gapIdx].fillBarIndex  = newBarIdx;

            if(!m_gaps[gapIdx].signalPublished)
              {
               PublishSignal(gapIdx, newBarIdx, m_gaps[gapIdx].fillPrice, false);
               m_gaps[gapIdx].signalPublished   = true;
               activeGaps[a].signalPublished    = true;
              }

            RemoveActiveGap(a);
            continue;
           }

         if(ShowHistoricalGaps)
            UpdateGapVisuals(m_gaps[gapIdx], PrefixForIndex(gapIdx));
        }

      activeGaps[a].lastUpdateBar = newBarIdx;
     }
  }
The function then evaluates the state transition using the closing price of the current bar, following the rules defined in the state machine section. Whenever the calculated state differs from the current one, both the gap record and the corresponding active-gap entry are updated. A transition to GAP_FILLED results in the fill time, fill price, and fill bar index being recorded before PublishSignal() is called with isHistorical = false. This publishes the signal to the indicator buffers, triggers any enabled alerts, and logs the event. Once the signal has been processed, the gap is removed from the active list through RemoveActiveGap(), which swaps the element with the final array entry before reducing the array size. For all other state changes, the associated visual objects are refreshed through UpdateGapVisuals() to ensure that the chart reflects the latest gap status.
Publishing Signals and Alerts
PublishSignal() performs three main tasks. It begins by determining the trading direction: by default, a filled gap up generates a buy signal, while a filled gap down generates a sell signal. This behavior is reversed when InvertSignals is enabled. The function then writes the fill price to either BufferBuy or BufferSell, provided that fillBarIdx falls within the valid buffer range. In addition, it stores GAP_FILLED in BufferGapState and records the fill price in BufferFillPrice, allowing Expert Advisors to access supplementary signal information. Finally, real-time fills trigger a call to DoAlert(), while historical fills are written to the buffers without generating notifications.
//+------------------------------------------------------------------+
//| Publish signal into indicator buffers at the given bar index     |
//+------------------------------------------------------------------+
void PublishSignal(int gapIdx, int fillBarIdx, double fillPrice, bool isHistorical)
  {
   bool isGapUp   = !m_gaps[gapIdx].isGapDown;
   bool buySignal = InvertSignals ? !isGapUp : isGapUp;

   if(buySignal)
     {
      if(fillBarIdx < ArraySize(BufferBuy))
        {
         BufferBuy[fillBarIdx]       = fillPrice;
         BufferGapState[fillBarIdx]  = (double)GAP_FILLED;
         BufferFillPrice[fillBarIdx] = fillPrice;
        }
     }
   else
     {
      if(fillBarIdx < ArraySize(BufferSell))
        {
         BufferSell[fillBarIdx]      = fillPrice;
         BufferGapState[fillBarIdx]  = (double)GAP_FILLED;
         BufferFillPrice[fillBarIdx] = fillPrice;
        }
     }

//--- Visual arrow (only if ShowHistoricalGaps is true)
   if(ShowHistoricalGaps)
      DrawSignalArrow(m_gaps[gapIdx], PrefixForIndex(gapIdx));

//--- Alerts & log for real-time fills only
   if(!isHistorical)
     {
      string signalType = buySignal ? "BUY" : "SELL";
      string msg = StringFormat("Weekend Gap %s Signal on %s %s at %s (Price: %.5f)",
                                signalType, _Symbol, EnumToString(Period()),
                                TimeToString(TimeCurrent()), fillPrice);
      DoAlert(msg, EnableSound, EnableNotification, EnableEmail);
      Print(msg);
     }
  }
DoAlert() respects the global EnableAlerts flag and conditionally triggers notifications through Alert(), PlaySound(), SendNotification(), and SendMail() based on the user’s configuration. The alert message includes the symbol, timeframe, signal type, and fill price, providing immediate trading feedback. It also supports external integration through push and email notifications, enabling real-time signal delivery beyond the platform.
//+------------------------------------------------------------------+
//| Send alerts (popup, sound, push, email)                          |
//+------------------------------------------------------------------+
void DoAlert(string msg, bool playSound, bool pushNote, bool sendMail)
  {
   if(!EnableAlerts)
      return;
   Alert(msg);
   if(playSound)
      PlaySound(SoundFile);
   if(pushNote)
      SendNotification(msg);
   if(sendMail)
      SendMail("Weekend Gap Indicator Alert", msg);
  }
Visual Objects: Rectangles, Labels, and Week Separators
When ShowHistoricalGaps is enabled, CreateGapObjects() draws a set of chart objects for each gap. The primary object is a filled rectangle (OBJ_RECTANGLE) that spans from Monday 00:00 to the following Monday 00:00, with its vertical boundaries defined by gapLow and gapHigh. The rectangle is placed behind the price bars (OBJPROP_BACK = true) so that it does not obscure the candlesticks. Its fill color is made semi-transparent through ColorSetAlpha(), which converts the opacity percentage into an alpha channel value (0–255). The outline color and width are taken directly from the visual settings.
The function also draws a dashed midpoint line (OBJ_TREND) to highlight the center of the gap. A primary text label (OBJ_TEXT) is positioned at 25% of the week's width from the left edge and displays both the gap size in pips and the current state. When ShowDetailedLabels is enabled, three additional labels are added to display the Friday close, Monday open, and midpoint values, providing extra information for manual analysis.
Week separators are drawn as vertical lines (OBJ_VLINE) at each Monday 00:00 when DrawWeekSeparators is enabled. To avoid duplicates, the function checks whether a separator already exists before creating a new one, even when multiple gaps share the same weekly boundary. The separator color and line style are fully configurable through the indicator inputs.
//+------------------------------------------------------------------+
//| Create visual objects for a gap (rectangle, text, etc.)          |
//+------------------------------------------------------------------+
void CreateGapObjects(const WeekendGapRecord &gap, string prefix)
  {
   if(!ShowHistoricalGaps)
      return;

   if(DrawWeekSeparators)
     {
      int weekNum = (int)(gap.startTime / 86400 / 7);
      DrawWeekSeparator(gap.startTime, weekNum);
     }

   datetime leftTime   = gap.startTime;
   datetime rightEdge  = GetNextMondayOpen(gap.startTime);
   long     weekLength  = rightEdge - leftTime;
   double   mid         = (gap.gapHigh + gap.gapLow) / 2.0;

//--- Rectangle – placed behind bars
   ObjectCreate(0, prefix + "_RECT", OBJ_RECTANGLE, 0, leftTime, gap.gapHigh, rightEdge, gap.gapLow);
   ObjectSetInteger(0, prefix + "_RECT", OBJPROP_COLOR, m_vis.activeOutlineColor);
   ObjectSetInteger(0, prefix + "_RECT", OBJPROP_WIDTH, m_vis.lineWidth);
   ObjectSetInteger(0, prefix + "_RECT", OBJPROP_FILL, true);
   ObjectSetInteger(0, prefix + "_RECT", OBJPROP_BGCOLOR, ColorSetAlpha(m_vis.activeFillColor, (uchar)(m_vis.activeFillOpacity * 255 / 100)));
   ObjectSetInteger(0, prefix + "_RECT", OBJPROP_BACK, true);

//--- Mid line (also behind)
   ObjectCreate(0, prefix + "_MID", OBJ_TREND, 0, leftTime, mid, rightEdge, mid);
   ObjectSetInteger(0, prefix + "_MID", OBJPROP_COLOR, clrDarkGray);
   ObjectSetInteger(0, prefix + "_MID", OBJPROP_STYLE, STYLE_DASH);
   ObjectSetInteger(0, prefix + "_MID", OBJPROP_BACK, true);

//--- Main label (stays on top)
   double pipDist = (gap.gapHigh - gap.gapLow) / PipSize();
   string text = StringFormat("WG | %.1fp | %s", pipDist, StateToString(gap.state));
   datetime mainLabelTime = (datetime)(leftTime + (long)(weekLength * 0.25));
   ObjectCreate(0, prefix + "_LBL", OBJ_TEXT, 0, mainLabelTime, mid);
   ObjectSetString(0, prefix + "_LBL", OBJPROP_TEXT, text);
   ObjectSetInteger(0, prefix + "_LBL", OBJPROP_FONTSIZE, m_vis.fontSize);
   ObjectSetInteger(0, prefix + "_LBL", OBJPROP_COLOR, clrWhite);
   ObjectSetString(0, prefix + "_LBL", OBJPROP_FONT, "Arial Bold");
   ObjectSetInteger(0, prefix + "_LBL", OBJPROP_ANCHOR, ANCHOR_CENTER);

   if(ShowDetailedLabels)
     {
      datetime detailTime = (datetime)(leftTime + (long)(weekLength * 0.05));
      double gapHeight = gap.gapHigh - gap.gapLow;
      double offset    = gapHeight * 0.1;
      int smallFont    = MathMax(m_vis.fontSize - 1, 6);
      double friPrice  = gap.isGapDown ? gap.gapHigh : gap.gapLow;
      string friText   = StringFormat("Fri Close: %." + IntegerToString(_Digits) + "f", friPrice);
      ObjectCreate(0, prefix + "_TOP", OBJ_TEXT, 0, detailTime, gap.gapHigh - offset);
      ObjectSetString(0, prefix + "_TOP", OBJPROP_TEXT, friText);
      ObjectSetInteger(0, prefix + "_TOP", OBJPROP_FONTSIZE, smallFont);
      ObjectSetInteger(0, prefix + "_TOP", OBJPROP_COLOR, clrWhite);

      double monPrice = gap.isGapDown ? gap.gapLow : gap.gapHigh;
      string monText  = StringFormat("Mon Open: %." + IntegerToString(_Digits) + "f", monPrice);
      ObjectCreate(0, prefix + "_BOT", OBJ_TEXT, 0, detailTime, gap.gapLow + offset);
      ObjectSetString(0, prefix + "_BOT", OBJPROP_TEXT, monText);
      ObjectSetInteger(0, prefix + "_BOT", OBJPROP_FONTSIZE, smallFont);
      ObjectSetInteger(0, prefix + "_BOT", OBJPROP_COLOR, clrWhite);

      string midText = StringFormat("Mid: %." + IntegerToString(_Digits) + "f", gap.midpoint);
      ObjectCreate(0, prefix + "_MIDPRICE", OBJ_TEXT, 0, detailTime, gap.midpoint);
      ObjectSetString(0, prefix + "_MIDPRICE", OBJPROP_TEXT, midText);
      ObjectSetInteger(0, prefix + "_MIDPRICE", OBJPROP_FONTSIZE, smallFont);
      ObjectSetInteger(0, prefix + "_MIDPRICE", OBJPROP_COLOR, clrWhite);
     }
  }
When a gap’s state changes, UpdateGapVisuals() updates the existing chart objects to reflect the new status. For gaps classified as historical (past weeks), the rectangle outline is switched to a dashed style, the line width is reduced, the fill is disabled, and the label styling is downgraded through a less prominent color and font. For active gaps, the original styling is restored, including a solid outline, enabled fill, and bold label formatting. This dynamic visual update provides immediate feedback on which gaps remain relevant for ongoing analysis.
//+------------------------------------------------------------------+
//| Update visual objects based on gap state                         |
//+------------------------------------------------------------------+
void UpdateGapVisuals(const WeekendGapRecord &gap, string prefix)
  {
   if(!ShowHistoricalGaps)
      return;
   if(ObjectFind(0, prefix + "_RECT") < 0)
      return;

   if(!gap.activeWeek || gap.state == GAP_HISTORICAL)
     {
      ObjectSetInteger(0, prefix + "_RECT", OBJPROP_COLOR, m_vis.memoryOutlineColor);
      ObjectSetInteger(0, prefix + "_RECT", OBJPROP_STYLE, STYLE_DASH);
      ObjectSetInteger(0, prefix + "_RECT", OBJPROP_WIDTH, 1);
      ObjectSetInteger(0, prefix + "_RECT", OBJPROP_FILL, false);

      if(ObjectFind(0, prefix + "_LBL") >= 0)
        {
         ObjectSetInteger(0, prefix + "_LBL", OBJPROP_COLOR, clrDimGray);
         ObjectSetString(0, prefix + "_LBL", OBJPROP_FONT, "Arial");
        }
     }
   else
     {
      ObjectSetInteger(0, prefix + "_RECT", OBJPROP_COLOR, m_vis.activeOutlineColor);
      ObjectSetInteger(0, prefix + "_RECT", OBJPROP_STYLE, STYLE_SOLID);
      ObjectSetInteger(0, prefix + "_RECT", OBJPROP_WIDTH, m_vis.lineWidth);
      ObjectSetInteger(0, prefix + "_RECT", OBJPROP_FILL, true);
      ObjectSetInteger(0, prefix + "_RECT", OBJPROP_BGCOLOR, ColorSetAlpha(m_vis.activeFillColor, (uchar)(m_vis.activeFillOpacity * 255 / 100)));

      if(ObjectFind(0, prefix + "_LBL") >= 0)
        {
         ObjectSetInteger(0, prefix + "_LBL", OBJPROP_COLOR, clrWhite);
         ObjectSetString(0, prefix + "_LBL", OBJPROP_FONT, "Arial Bold");
        }
     }

   if(ObjectFind(0, prefix + "_LBL") >= 0)
     {
      double pipDist = (gap.gapHigh - gap.gapLow) / PipSize();
      string text = StringFormat("WG | %.1fp | %s", pipDist, StateToString(gap.state));
      ObjectSetString(0, prefix + "_LBL", OBJPROP_TEXT, text);
     }
  }
Signal Arrows
When a gap is marked as filled, DrawSignalArrow() creates a single OBJ_ARROW object at the corresponding fill time and price. The arrow uses code 233 (up) for buy signals and 234 (down) for sell signals, with colors sourced from BuyArrowColor and SellArrowColor. The anchor position is set to ANCHOR_BOTTOM for buy arrows so the tip touches the fill price from above, and ANCHOR_TOP for sell arrows so the tip touches from below, improving visual clarity on the chart. The InvertSignals parameter is fully respected to ensure the arrow direction aligns with the actual trading logic. Before creation, the function checks for an existing arrow for the same gap to prevent duplicate objects.
//+------------------------------------------------------------------+
//| Draw an arrow on chart when gap fills (visual only)              |
//+------------------------------------------------------------------+
void DrawSignalArrow(const WeekendGapRecord &gap, string prefix)
  {
   if(gap.state != GAP_FILLED || gap.fillTime == 0)
      return;
   if(ObjectFind(0, prefix + "_ARROW") >= 0)
      return;

   bool defaultIsBuy = !gap.isGapDown;
   bool isBuy = InvertSignals ? !defaultIsBuy : defaultIsBuy;

   ObjectCreate(0, prefix + "_ARROW", OBJ_ARROW, 0, gap.fillTime, gap.fillPrice);
   ObjectSetInteger(0, prefix + "_ARROW", OBJPROP_COLOR, isBuy ? BuyArrowColor : SellArrowColor);
   ObjectSetInteger(0, prefix + "_ARROW", OBJPROP_WIDTH, ArrowSize);
   ObjectSetInteger(0, prefix + "_ARROW", OBJPROP_ANCHOR, isBuy ? ANCHOR_BOTTOM : ANCHOR_TOP);
   ObjectSetInteger(0, prefix + "_ARROW", OBJPROP_ARROWCODE, isBuy ? 233 : 234);
  }
Helper Utilities
Several helper functions are used to improve code modularity and maintainability. PipSize() returns the correct pip value based on _Digits, supporting forex pairs (5 or 3 digits), indices (2 digits), and commodities (4 digits). GetWeekMonday(datetime t) computes the Monday 00:00 timestamp for the week containing t, including correct handling of Sunday where day_of_week == 0. GetNextMondayOpen() advances a given Monday timestamp by seven days to obtain the next weekly boundary. ColorSetAlpha() applies an alpha channel to an RGB color, enabling semi-transparent visual elements. StateToString() converts gap state enums into human-readable labels for chart annotations. PrefixForIndex(int idx) generates unique object name prefixes such as "WG_5" to prevent naming collisions. Finally, FindBarIndexByTime() locates the index of a specific timestamp within a time array and is used during historical fill reconstruction.
//+------------------------------------------------------------------+
//| Helper: Convert state to string                                  |
//+------------------------------------------------------------------+
string StateToString(ENUM_GAP_STATE state)
  {
   switch(state)
     {
      case GAP_FRESH:
         return "FRESH";
      case GAP_PARTIAL:
         return "PARTIAL";
      case GAP_REACTION:
         return "REACTION";
      case GAP_FILLED:
         return "FILLED";
      case GAP_HISTORICAL:
         return "HIST";
     }
   return "";
  }

//+------------------------------------------------------------------+
//| Helper: Apply alpha to color (for rectangle fill)                |
//+------------------------------------------------------------------+
color ColorSetAlpha(color clr, uchar alpha)
  {
   return (color)((clr & 0x00FFFFFF) | ((uint)alpha << 24));
  }

//+------------------------------------------------------------------+
//| Helper: Get Monday 00:00 of the week containing t                |
//+------------------------------------------------------------------+
datetime GetWeekMonday(datetime t)
  {
   MqlDateTime dt;
   TimeToStruct(t, dt);
   int daysSinceMonday = (dt.day_of_week == 0) ? 6 : (dt.day_of_week - 1);
   return t - daysSinceMonday * 86400 - (t % 86400);
  }

//+------------------------------------------------------------------+
//| Helper: Pip size based on digits                                 |
//+------------------------------------------------------------------+
double PipSize()
  {
   return (_Digits == 3 || _Digits == 5) ? (_Point * 10.0) : _Point;
  }

//+------------------------------------------------------------------+
//| Helper: Next Monday open time (00:00)                            |
//+------------------------------------------------------------------+
datetime GetNextMondayOpen(datetime thisMondayOpenTime)
  {
   return thisMondayOpenTime + 7 * 86400;
  }

//+------------------------------------------------------------------+
//| Helper: Unique object name prefix for a gap index                |
//+------------------------------------------------------------------+
string PrefixForIndex(int idx)
  {
   return "WG_" + IntegerToString(idx);
  }

//+------------------------------------------------------------------+
//| Delete all indicator-created objects                              |
//+------------------------------------------------------------------+
void DeleteWGObjects()
  {
   const long chart_id = 0;
   int total = ObjectsTotal(chart_id, 0, -1);
   for(int i = total - 1; i >= 0; --i)
     {
      string name = ObjectName(chart_id, i, 0, -1);
      if(StringFind(name, "WG_") == 0)
         ObjectDelete(chart_id, name);
     }
  }

//+------------------------------------------------------------------+
//| Draw a vertical line to separate weeks                           |
//+------------------------------------------------------------------+
void DrawWeekSeparator(datetime lineTime, int weekNumber)
  {
   if(!DrawWeekSeparators)
      return;

   string objName = "WG_WeekSep_" + IntegerToString(weekNumber);
   if(ObjectFind(0, objName) >= 0)
      return;

   ObjectCreate(0, objName, OBJ_VLINE, 0, lineTime, 0);
   ObjectSetInteger(0, objName, OBJPROP_COLOR, WeekSeparatorColor);
   ObjectSetInteger(0, objName, OBJPROP_STYLE, WeekSeparatorStyle);
   ObjectSetInteger(0, objName, OBJPROP_WIDTH, 1);
   ObjectSetInteger(0, objName, OBJPROP_BACK, true);
  }
These utilities are placed at the end of the file and are called wherever needed, keeping the main functions clean and focused.
Outcomes
This section presents the test outcomes obtained from two different environments: live chart testing and Strategy Tester evaluation. In the Strategy Tester, a separate test EA was attached to the indicator in order to confirm that the generated signals could be read correctly and executed by an Expert Advisor.
Live Chart Testing
The GIF below shows the indicator attached to a chart during live operation. As soon as it is loaded, the indicator scans the available price history, detects all qualifying weekend gaps, and draws them directly on the chart. Historical gap fills identified during the lookback process are also marked with signal arrows.
Once the initial scan is complete, the indicator continues monitoring the market in real time. Whenever a new gap fill occurs, an alert is triggered and a new arrow is placed on the chart. This makes both historical and live gap-fill events easy to follow visually.
Strategy Tester Evaluation
To verify that the indicator could be integrated with an Expert Advisor in the Strategy Tester, a dedicated test EA was created. The EA reads the indicator buffers and trades from the generated signals, while the indicator continues to detect, draw, and monitor weekend gaps and gap-fill events during backtesting. The GIF below illustrates this behavior clearly.
As shown, the test EA successfully opened a sell position after a bearish gap-fill signal was generated by the indicator. This confirms that the indicator can communicate with an Expert Advisor through its buffers and that the generated signals are suitable for automated execution.
Important Trading Considerations
While gap-fill signals provide a structured way to identify potential trading opportunities, they should not be interpreted as guarantees that price will reverse or continue in a specific direction. A gap fill simply indicates that price has returned to the gap boundary defined by the indicator.
Market conditions, volatility, liquidity, higher-timeframe structure, and fundamental events can all influence the outcome of a trade after a gap fill occurs. Some gaps fill quickly and produce meaningful reactions, while others may continue moving with little or no reversal.
For this reason, gap-fill signals are best used as one component of a broader trading framework. Traders should apply appropriate risk management, define stop-loss levels before entering a position, and seek additional confirmation when required by their trading methodology.
This indicator is designed to identify and monitor gap-fill events objectively; the final trading decision remains the responsibility of the trader or the Expert Advisor implementing the signal.
Conclusion
In this article, we developed a complete Weekend Gap Fill Signal Indicator for MetaTrader 5. The indicator detects weekend gaps, tracks their fill status, reconstructs historical fills, publishes buy and sell signals through indicator buffers, and provides visual feedback through gap rectangles, state labels, week separators, and signal arrows.
The implementation was designed not only for discretionary analysis but also for integration with automated systems. By exposing non-repainting buy and sell buffers, the indicator allows Expert Advisors to retrieve and trade gap-fill signals through CopyBuffer(), which was verified using the attached test EA during Strategy Tester evaluation.
The final framework provides:
- Weekend gap detection and tracking
- Historical fill reconstruction
- Real-time gap fill monitoring
- Buy and sell signal generation
- Popup, sound, push, and email alerts
- Visual chart objects for gap analysis
- EA-compatible indicator buffers
The complete test EA and indicator source files are attached to this article for reference and further experimentation.
Warning: All rights to these materials are reserved by MetaQuotes Ltd. Copying or reprinting of these materials in whole or in part is prohibited.
This article was written by a user of the site and reflects their personal views. MetaQuotes Ltd is not responsible for the accuracy of the information presented, nor for any consequences resulting from the use of the solutions, strategies or recommendations described.

- Free trading apps
- Over 8,000 signals for copying
- Economic news for exploring financial markets
You agree to website policy and terms of use