
Price Action Analysis Toolkit Development (Part 71): Weekend Gap Structure Mapping in MQL5

Contents
Introduction
Weekend gaps are often revisited after trading resumes, making them useful liquidity reference zones throughout the week. The challenge is that these structures are usually identified manually, and once new price action develops, older zones become difficult to track consistently. For traders, the main challenge is to maintain consistent structural interpretation as new price action develops and older imbalance zones gradually move out of view. For developers, the challenge is to build a chart-based system that detects session discontinuities, preserves structural boundaries over time, and reliably updates the visuals during normal chart operation.
This article develops a weekend gap framework in MQL5 that detects gaps directly from trading-session time discontinuities and renders them as structured chart objects. The indicator draws the gap range, midpoint, and reference labels. It preserves older gaps as historical zones and updates active gaps in real time using the states: fresh, partial, reaction, and filled. The implementation focuses on stable chart visualization, object lifecycle management, and reproducible gap tracking. This framework can later support more advanced interaction analysis and automated weekend-gap trading logic.
Understanding the Concept
What is a Gap
A gap is the empty price space that appears when one candle opens at a noticeably different level from where the previous candle closed. In other words, price does not trade continuously from one bar to the next; it jumps from one level to another, leaving a visible discontinuity on the chart. On candlestick charts, this shows up as a break between neighboring candles.
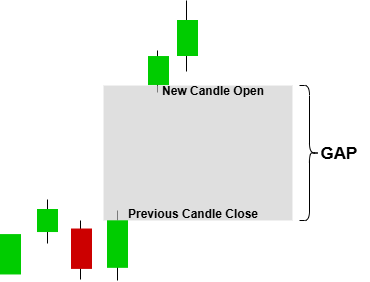
The diagram above illustrates a price gap between two consecutive candles, where the opening price of the new candle does not align with the closing level of the previous one. This creates a visible empty price region between the two bars, showing that no trading occurred within that interval. The result is a discontinuity in price flow, where the market transitions directly from one level to another without intermediate prints.
What Causes Market Gaps
Market gaps form when price is forced to reprice between two consecutive candles without sufficient trading activity to create continuity. Instead of progressing through intermediate price levels, the market reopens at a new equilibrium where orders can immediately be matched.
In practice, gaps are mainly driven by three underlying conditions:
1. Interruptions in continuous trading flowWhen trading is temporarily paused or liquidity is unavailable, new information can accumulate outside active trading periods. Once the market reopens, this information is immediately reflected in price, causing it to open above or below the previous close.
2. Liquidity imbalance and delayed order participation
During periods of uncertainty or low participation, order flow becomes thin. When activity returns, incoming buy or sell orders may overwhelm the available liquidity, forcing price to adjust quickly to levels where matching can occur.
3. Bid–ask imbalance at the reopening price
At the core level, a gap appears when there is a mismatch between bid and ask interest at the next available price. If demand is stronger than supply, price reopens higher; if supply dominates, it reopens lower. The gap is the visual result of this repricing jump.
Together, these conditions explain why gaps are not random chart artifacts, but structured responses to shifts in liquidity and market information flow.
The Weekend Gap
Financial markets can produce several types of gaps, including breakaway gaps, continuation gaps, exhaustion gaps, and common session gaps. However, this article focuses specifically on the weekend gap.
A weekend gap is a specific type of price gap that forms between the close of Friday’s trading session and the opening price when the market resumes on Monday. Because price does not trade continuously during this period, any change in market conditions that occurs over the weekend is reflected instantly at the reopening price, creating a visible discontinuity on the chart.
This type of gap is a direct result of the market being temporarily closed. During this time, price does not update, but information continues to flow. When trading resumes, the market reopens at a level that already incorporates new expectations, causing price to jump away from the last traded Friday level.
From a structural point of view, a weekend gap is identified by comparing two key points:
- Friday’s final closing price
- Monday’s opening price
The difference between these two levels forms the weekend gap zone. On a chart, it appears as an empty vertical space between the last candle of the week and the first candle of the new week.
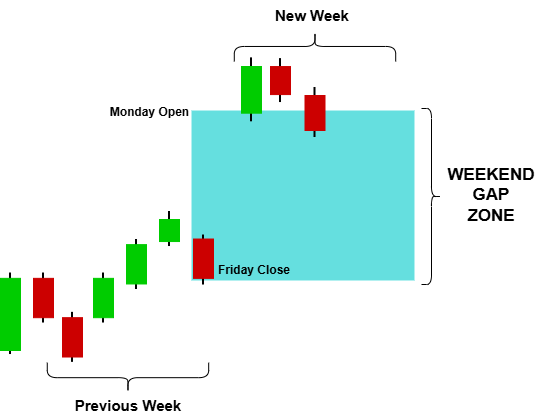
For visualization and analysis purposes, this gap is usually marked as a range rather than a single line, extending from Friday’s close to Monday’s open. This allows traders or systems to track how price interacts with the zone over time—whether it is left untouched, partially traded, or eventually filled.
In practical terms, weekend gaps are driven by information released while the market is closed, such as macroeconomic developments, geopolitical events, or shifts in market sentiment. When the market reopens, this accumulated information is rapidly priced in, producing the jump that defines the gap structure.
Why the Weekend Gap Matters in Forex Trading
A gap is not just a visual discontinuity. It indicates that price revalued without continuous trading between two consecutive candles. This means the market has “reopened” at a level that is different from where it previously closed, leaving an empty price zone between the two bars. This zone often becomes important because price has not traded through it, meaning no transactions occurred inside that range.
In forex trading, weekend gaps matter because they reflect a temporary breakdown in continuous price discovery. While the market is closed, external factors continue to influence sentiment and valuation. When trading resumes, this adjustment is expressed instantly in the opening price.
Weekend gaps are significant for several reasons:
- Liquidity reference zones: The weekend gap zone often acts as a short-term reference region where price may return later.
- Market imbalance marker: It highlights where buy and sell pressure was not matched at equilibrium.
- Reaction zones: Price frequently reacts around the gap edges (Friday close and Monday open levels).
- Mean reversion tendency: In many cases, price partially or fully revisits the gap area over time.
- Structural reference for algorithms: For MQL5 systems, the gap provides a clearly defined, rule-based structure that can be detected and tracked programmatically.
The midpoint of the weekend gap zone is also an important internal reference level. It represents the equilibrium between the two discontinuous price levels and is often used as a secondary reaction zone where price may hesitate, consolidate, or reverse during retracement.
System Overview
To translate this concept into a usable analytical tool, the weekend gap is treated as a structured market zone rather than a simple price break. The objective is to consistently identify, visualize, and track how price interacts with this zone over time.
The system is designed around three core components:
- Gap Detection Layer: identifies the price discontinuity between the previous close and the next open and stores it as a structured range
- Structural Mapping Layer: draws the gap as a visual zone with clear boundaries and a midpoint reference for internal balance
- State Tracking Layer: monitors how price interacts with the zone and classifies its evolution over time (e.g., untouched, partially traded, reacted to, or fully filled), while preserving completed gaps as historical reference zones
This structure allows each gap to behave as a persistent object on the chart rather than a temporary visual mark. Active gaps remain dynamic, while older gaps are retained as contextual reference zones for market structure analysis.
The next section focuses on the MQL5 implementation of this model, where these components are built into a working indicator that detects, draws, and updates weekend gap structures in real time.
MQL5 Implementation
The implementation turns weekend gap structures into graphical objects directly on the chart. Instead of using indicator buffers or a separate window, it draws rectangles, lines, and labels that mark each gap and track its real‑time filling status. This section explains how the indicator detects gaps, maintains a state machine, and positions objects dynamically on the chart.
This design is intentionally object-based rather than buffer-based because each weekend gap must remain visible as a persistent chart structure. Using chart objects allows the indicator to manage multiple visual elements independently, update styles in real time, and preserve older gap zones as historical reference areas. This approach also makes the framework easier to extend later with additional interaction logic, such as reaction highlighting or automated classification of price behavior.
Properties and Indicator Setup
The first step is to define how the indicator will behave within MetaTrader 5. We specify that the indicator should be drawn directly on the main chart window, not in a separate section. Since the goal is to display structured chart objects rather than a traditional line-based indicator, the code does not generate any buffers or plots. Instead, it uses graphical objects such as OBJ_RECTANGLE, OBJ_VLINE, OBJ_TREND, and OBJ_TEXT so that each gap can be rendered, updated, and preserved independently on the chart.
//+------------------------------------------------------------------+
//|                                          WeekendGapIndicator.mq5 |
//|                              Copyright 2026, Christian Benjamin. |
//|                          https://www.mql5.com/en/users/lynnchris |
//+------------------------------------------------------------------+
#property copyright "Copyright 2026, Christian Benjamin."
#property link      "https://www.mql5.com/en/users/lynnchris"
#property version   "1.0"
#property indicator_chart_window
#property indicator_buffers 0
#property indicator_plots   0
This approach makes the display more flexible and visually appealing, allowing us to style the rectangles, lines, and labels exactly as we want – including semi‑transparent fills, dashed outlines, and custom fonts.
User Inputs and Customization Options
Next, we define several input parameters that traders can customize to suit their preferences. These settings control both the visual presentation and the amount of historical structure retained on the chart, allowing the indicator to remain adaptable across different chart themes and trading styles. MinGapPips sets the minimum gap size to consider. The default is 0.5 pips, which filters out micro-gaps. ShowHistoricalGaps and MaxHistoricalWeeks control whether past weeks are drawn and how many. The visual inputs — fill color, outline color, opacity, and font size — allow the framework to adapt cleanly to different chart themes while maintaining readability.
//+------------------------------------------------------------------+
//| INPUTS                                                           |
//+------------------------------------------------------------------+
input bool     ShowHistoricalGaps  = true;          // Show historical gaps
input int      MaxHistoricalWeeks  = 26;            // Maximum historical weeks (visual only)
input double   MinGapPips          = 0.5;           // Minimum gap size in pips
input bool     ShowDetailedLabels  = true;          // Show Fri Close / Mon Open / Mid levels
input color    ActiveFillColor     = clrGainsboro;  // Very light grey fill
input color    ActiveOutlineColor  = clrDimGray;    // Dark grey outline
input color    ReactionColor       = clrDarkOrange; // Reaction state
input color    MemoryOutlineColor  = clrSilver;     // Light silver memory lines
input int      ActiveFillOpacity   = 25;            // Fill opacity (0-100)
input int      LineWidth           = 2;             // Outline width
input int      FontSize            = 7;             // Small professional labels
The ReactionColor is reserved for a future feature – highlighting when price retests the opposite side of a partially filled gap. The ActiveFillOpacity parameter is converted into an alpha channel internally, giving the active gap a modern, semi‑transparent look.
Global Variables and Data Structures
To keep the code organized, we define two structures and several global variables. The ENUM_GAP_STATE enumeration describes the life cycle of each gap, while the WeekendGapRecord structure stores all structural data needed to track one weekend gap across time. The VisualSettings structure groups the appearance parameters so that visual behavior can be managed consistently from one place.
//+------------------------------------------------------------------+
//| ENUMS & STRUCTURES                                               |
//+------------------------------------------------------------------+
enum ENUM_GAP_STATE
  {
   GAP_FRESH,
   GAP_PARTIAL,
   GAP_REACTION,
   GAP_FILLED,
   GAP_HISTORICAL
  };

struct WeekendGapRecord
  {
   datetime          startTime;
   datetime          endTime;
   double            gapHigh;
   double            gapLow;
   double            midpoint;
   bool              isGapDown;
   ENUM_GAP_STATE    state;
   bool              activeWeek;
  };

struct VisualSettings
  {
   color             activeFillColor;
   color             activeOutlineColor;
   color             reactionColor;
   color             memoryOutlineColor;
   int               activeFillOpacity;
   int               lineWidth;
   int               fontSize;
  };

//+------------------------------------------------------------------+
//| GLOBAL VARIABLES                                                 |
//+------------------------------------------------------------------+
WeekendGapRecord   m_gaps[];
VisualSettings     m_vis;
datetime           m_lastBarTime = 0;
bool               m_firstRun = true;
The m_gaps dynamic array stores all detected gaps, both historical and active, so the indicator can manage them as persistent chart entities rather than isolated one-off drawings. m_firstRun ensures that the one‑time gap detection and object creation happen only once.
Initialization (OnInit()): Preparing Data and Visual Settings
When the indicator loads, the OnInit() function prepares the visual settings needed for real-time display. It copies all input parameters into the m_vis structure for easy access and keeps the initialization phase lightweight. The actual gap detection is deferred to the first OnCalculate call so the indicator can finish loading quickly before scanning historical data.
//+------------------------------------------------------------------+
//| EVENT HANDLERS                                                   |
//+------------------------------------------------------------------+
int OnInit()
  {
   m_vis.activeFillColor    = ActiveFillColor;
   m_vis.activeOutlineColor = ActiveOutlineColor;
   m_vis.reactionColor      = ReactionColor;
   m_vis.memoryOutlineColor = MemoryOutlineColor;
   m_vis.activeFillOpacity  = ActiveFillOpacity;
   m_vis.lineWidth          = LineWidth;
   m_vis.fontSize           = FontSize;

   m_firstRun = true;
   return(INIT_SUCCEEDED);
  }
The indicator does not perform historical scanning during initialization. Instead, the m_firstRun flag defers that work to the first calculation cycle, which keeps startup responsive and avoids unnecessary processing during load time.
Cleanup (OnDeinit()): Removing Objects and Freeing Resources
When the indicator is removed or the chart is closed, the OnDeinit() function clears all resources created by the framework. It deletes every graphical object that starts with the prefix "WG_" using ObjectsDeleteAll(), which prevents leftover drawings from remaining on the chart after the indicator is detached. This keeps the chart clean and ensures the indicator does not interfere with other analysis tools.
//+------------------------------------------------------------------+
//| OnDeinit: Clean up objects on deinitialization                   |
//+------------------------------------------------------------------+
void OnDeinit(const int reason)
  {
   ObjectsDeleteAll(0, "WG_");
  }
Because the indicator does not use any technical handles (the gap detection is based purely on price data copied directly from the chart), there is no handle to release. The object deletion is sufficient.
Main Calculation (OnCalculate()): Detecting Gaps and Updating the Display
The core logic happens inside the OnCalculate() function. This function runs each time new market data arrives and updates the display in real time. The implementation is divided into three phases: one-time historical detection, live state management, and week rollover handling. This structure keeps the logic clear, efficient, and easy to maintain.
//+------------------------------------------------------------------+
//| OnCalculate: Main indicator calculation function                 |
//+------------------------------------------------------------------+
int OnCalculate(const int rates_total,
                const int prev_calculated,
                const datetime &time[],
                const double &open[],
                const double &high[],
                const double &low[],
                const double &close[],
                const long &tick_volume[],
                const long &volume[],
                const int &spread[])
  {
   if(rates_total < 2)
      return(0);

   if(m_firstRun)
     {
      DetectAllGaps(time, open, close, rates_total);
      for(int i = 0; i < ArraySize(m_gaps); i++)
         CreateGapObjects(m_gaps[i], PrefixForIndex(i));
      m_firstRun = false;
     }

   UpdateCurrentState();

   datetime currentBarTime = time[0];
   if(currentBarTime != m_lastBarTime)
     {
      m_lastBarTime = currentBarTime;
      datetime barMonday = GetWeekMonday(currentBarTime);
      for(int i = 0; i < ArraySize(m_gaps); i++)
        {
         if(m_gaps[i].activeWeek && m_gaps[i].startTime < barMonday)
           {
            m_gaps[i].activeWeek = false;
            m_gaps[i].state = GAP_HISTORICAL;
            UpdateGapVisuals(m_gaps[i], PrefixForIndex(i));
           }
        }
     }

   return(rates_total);
  }
Phase 1 – One‑time detection
On the very first call, DetectAllGaps() scans historical price data for weekend breaks of 48 hours or more between bars. For each gap that meets the minimum pip threshold, the function creates a WeekendGapRecord and stores it in the m_gaps array. The indicator then calls CreateGapObjects() to draw the rectangle, vertical line, midpoint line, and labels for each gap. Performing this step only once avoids unnecessary rescanning of price history on every incoming tick and keeps the indicator lightweight during live chart operation.
Phase 2 – Real‑time state update
UpdateCurrentState() runs on every tick and evaluates how live price interacts with the active gap range. It compares the current bid price with the stored boundaries and updates the gap state: FRESH , PARTIAL , REACTION , or FILLED. Whenever the state changes, UpdateGapVisuals() updates the object styling and label text so the chart always reflects the current structural condition of the gap.
Phase 3 – Week rollover
The indicator tracks the current bar time to detect new bars without repeated full-history checks. When a new bar appears, it checks whether any gap marked as activeWeek belongs to a previous week. If so, the gap is converted to HISTORICAL, its activeWeek flag is cleared, and its appearance is switched to the historical style. This preserves completed gaps as reference zones while keeping only the current week visually active.
Gap Detection (DetectAllGaps) – Detailed Walkthrough
The detection function is the heart of the indicator. It copies time, open, and close data, then loops through bars looking for a weekend break.
//+------------------------------------------------------------------+
//| DETECT WEEKEND GAPS (time gap)                                   |
//+------------------------------------------------------------------+
void DetectAllGaps(const datetime &time[],
                   const double   &open[],
                   const double   &close[],
                   int             rates_total)
  {
   ArrayResize(m_gaps, 0);
   if(rates_total < 2)
      return;

   datetime timeArr[];
   double   openArr[];
   double   closeArr[];
   ArraySetAsSeries(timeArr, true);
   ArraySetAsSeries(openArr, true);
   ArraySetAsSeries(closeArr, true);
   if(CopyTime(_Symbol, _Period, 0, rates_total, timeArr) < 0)
      return;
   if(CopyOpen(_Symbol, _Period, 0, rates_total, openArr) < 0)
      return;
   if(CopyClose(_Symbol, _Period, 0, rates_total, closeArr) < 0)
      return;

   double pip = PipSize();
   int limit = MathMin(rates_total - 1, 10000);

   for(int i = 1; i < limit; i++)
     {
      double diffSeconds = (double)(timeArr[i-1] - timeArr[i]);
      if(diffSeconds >= 172800)   //--- 48 hours
        {
         double fridayClose = closeArr[i];
         double mondayOpen  = openArr[i-1];
         double gapPips = MathAbs(mondayOpen - fridayClose) / pip;

         if(gapPips >= MinGapPips)
           {
            WeekendGapRecord gap;
            gap.startTime  = timeArr[i-1];
            gap.endTime    = GetNextMondayOpen(timeArr[i-1]);
            gap.gapHigh    = MathMax(mondayOpen, fridayClose);
            gap.gapLow     = MathMin(mondayOpen, fridayClose);
            gap.midpoint   = (gap.gapHigh + gap.gapLow) / 2.0;
            gap.isGapDown  = (fridayClose > mondayOpen);
            gap.activeWeek = (GetWeekMonday(timeArr[i-1]) == GetWeekMonday(TimeCurrent()));
            gap.state      = gap.activeWeek ? GAP_FRESH : GAP_HISTORICAL;

            int size = ArraySize(m_gaps);
            ArrayResize(m_gaps, size + 1);
            m_gaps[size] = gap;
           }
        }
     }

   Print("Weekend Gap Indicator: Detected ", ArraySize(m_gaps), " gaps.");
  }
The arrays are aligned with ArraySetAsSeries (true), so index 0 refers to the newest bar. This makes the loop logic straightforward because i-1 represents the older bar and i represents the newer bar. A weekend break is recognized when the time difference between two adjacent bars reaches 172800 seconds or more. This helps the indicator catch weekend discontinuities even when the broker includes a Sunday session. The gap size in pips is calculated with PipSize(), which automatically adapts to 3- and 5-digit symbols. The activeWeek flag is determined by comparing the Monday of the detected gap with the Monday of the current chart time. All detected gaps are stored in the m_gaps array, allowing the indicator to retain both current and historical structure in one persistent data set.
Creating and Updating Visual Objects
Two main functions manage the graphical objects: CreateGapObjects() draws everything from scratch, and UpdateGapVisuals() modifies existing objects when a gap’s state changes.
CreateGapObjects builds the complete visual representation of a gap in one place. It creates the rectangle, the vertical session marker, the midpoint line, and the text labels that identify the gap state and price levels. Using a single creation function keeps the layout consistent across all detected gaps and makes future style changes easier to manage.
//+------------------------------------------------------------------+
//| CreateGapObjects: Draw rectangle, lines and labels for a gap     |
//+------------------------------------------------------------------+
void CreateGapObjects(const WeekendGapRecord &gap, string prefix)
  {
   datetime leftTime  = gap.startTime;
   datetime rightEdge = GetNextMondayOpen(gap.startTime);
   long     weekLength = rightEdge - leftTime;

//--- Rectangle
   ObjectCreate(0, prefix + "_RECT", OBJ_RECTANGLE, 0,
                leftTime, gap.gapHigh, rightEdge, gap.gapLow);
   ObjectSetInteger(0, prefix + "_RECT", OBJPROP_COLOR, m_vis.activeOutlineColor);
   ObjectSetInteger(0, prefix + "_RECT", OBJPROP_STYLE, STYLE_SOLID);
   ObjectSetInteger(0, prefix + "_RECT", OBJPROP_WIDTH, m_vis.lineWidth);
   ObjectSetInteger(0, prefix + "_RECT", OBJPROP_BACK, false);
   ObjectSetInteger(0, prefix + "_RECT", OBJPROP_FILL, true);
   ObjectSetInteger(0, prefix + "_RECT", OBJPROP_BGCOLOR,
                    ColorSetAlpha(m_vis.activeFillColor, (uchar)(m_vis.activeFillOpacity * 255 / 100)));

//--- Bold black week separator line
   ObjectCreate(0, prefix + "_VMARK", OBJ_VLINE, 0, leftTime, 0);
   ObjectSetInteger(0, prefix + "_VMARK", OBJPROP_COLOR, clrBlack);
   ObjectSetInteger(0, prefix + "_VMARK", OBJPROP_STYLE, STYLE_SOLID);
   ObjectSetInteger(0, prefix + "_VMARK", OBJPROP_WIDTH, 2);
   ObjectSetInteger(0, prefix + "_VMARK", OBJPROP_BACK, false);

//--- Midpoint line
   double mid = (gap.gapHigh + gap.gapLow) / 2.0;
   ObjectCreate(0, prefix + "_MID", OBJ_TREND, 0,
                leftTime, mid, rightEdge, mid);
   ObjectSetInteger(0, prefix + "_MID", OBJPROP_COLOR, clrDarkGray);
   ObjectSetInteger(0, prefix + "_MID", OBJPROP_STYLE, STYLE_DASH);
   ObjectSetInteger(0, prefix + "_MID", OBJPROP_WIDTH, 1);
   ObjectSetInteger(0, prefix + "_MID", OBJPROP_RAY_RIGHT, false);

//--- Main summary label – bold white, placed at 25% of week width
   double pipDist = (gap.gapHigh - gap.gapLow) / PipSize();
   string text = StringFormat("WG | %.1fp | %s", pipDist, StateToString(gap.state));
   datetime mainLabelTime = (datetime)(leftTime + (long)(weekLength * 0.25));
   ObjectCreate(0, prefix + "_LBL", OBJ_TEXT, 0, mainLabelTime, mid);
   ObjectSetString(0, prefix + "_LBL", OBJPROP_TEXT, text);
   ObjectSetInteger(0, prefix + "_LBL", OBJPROP_FONTSIZE, m_vis.fontSize);
   ObjectSetInteger(0, prefix + "_LBL", OBJPROP_COLOR, clrWhite);
   ObjectSetString(0, prefix + "_LBL", OBJPROP_FONT, "Arial Bold");
   ObjectSetInteger(0, prefix + "_LBL", OBJPROP_ANCHOR, ANCHOR_CENTER);

//--- Detailed level labels – inside the rectangle, bold white
   if(ShowDetailedLabels)
     {
      datetime detailTime = (datetime)(leftTime + (long)(weekLength * 0.05));
      double gapHeight = gap.gapHigh - gap.gapLow;
      double offset = gapHeight * 0.1;
      int smallFont = MathMax(m_vis.fontSize - 1, 6);

      //--- Friday close
      double friPrice = gap.isGapDown ? gap.gapHigh : gap.gapLow;
      string friText = StringFormat("Fri Close: %." + IntegerToString(_Digits) + "f", friPrice);
      ObjectCreate(0, prefix + "_TOP", OBJ_TEXT, 0, detailTime, gap.gapHigh - offset);
      ObjectSetString(0, prefix + "_TOP", OBJPROP_TEXT, friText);
      ObjectSetInteger(0, prefix + "_TOP", OBJPROP_FONTSIZE, smallFont);
      ObjectSetInteger(0, prefix + "_TOP", OBJPROP_COLOR, clrWhite);
      ObjectSetString(0, prefix + "_TOP", OBJPROP_FONT, "Arial Bold");
      ObjectSetInteger(0, prefix + "_TOP", OBJPROP_ANCHOR, ANCHOR_LEFT);

      //--- Monday open
      double monPrice = gap.isGapDown ? gap.gapLow : gap.gapHigh;
      string monText = StringFormat("Mon Open: %." + IntegerToString(_Digits) + "f", monPrice);
      ObjectCreate(0, prefix + "_BOT", OBJ_TEXT, 0, detailTime, gap.gapLow + offset);
      ObjectSetString(0, prefix + "_BOT", OBJPROP_TEXT, monText);
      ObjectSetInteger(0, prefix + "_BOT", OBJPROP_FONTSIZE, smallFont);
      ObjectSetInteger(0, prefix + "_BOT", OBJPROP_COLOR, clrWhite);
      ObjectSetString(0, prefix + "_BOT", OBJPROP_FONT, "Arial Bold");
      ObjectSetInteger(0, prefix + "_BOT", OBJPROP_ANCHOR, ANCHOR_LEFT);

      //--- Midpoint price
      string midText = StringFormat("Mid: %." + IntegerToString(_Digits) + "f", gap.midpoint);
      ObjectCreate(0, prefix + "_MIDPRICE", OBJ_TEXT, 0, detailTime, gap.midpoint);
      ObjectSetString(0, prefix + "_MIDPRICE", OBJPROP_TEXT, midText);
      ObjectSetInteger(0, prefix + "_MIDPRICE", OBJPROP_FONTSIZE, smallFont);
      ObjectSetInteger(0, prefix + "_MIDPRICE", OBJPROP_COLOR, clrWhite);
      ObjectSetString(0, prefix + "_MIDPRICE", OBJPROP_FONT, "Arial Bold");
      ObjectSetInteger(0, prefix + "_MIDPRICE", OBJPROP_ANCHOR, ANCHOR_LEFT);
     }
  }
UpdateGapVisuals is called whenever a gap changes state or moves from active to historical. It looks up each object by its prefix and updates only the properties that need to change, such as outline color, line style, fill behavior, font weight, and label text. This selective update approach is more efficient than recreating the objects every time the state changes.
//+------------------------------------------------------------------+
//| UpdateGapVisuals: Change appearance based on state (active/hist) |
//+------------------------------------------------------------------+
void UpdateGapVisuals(const WeekendGapRecord &gap, string prefix)
  {
   if(ObjectFind(0, prefix + "_RECT") < 0)
      return;

   if(!gap.activeWeek || gap.state == GAP_HISTORICAL)
     {
      //--- Historical – faint silver outline, no fill
      ObjectSetInteger(0, prefix + "_RECT", OBJPROP_COLOR, m_vis.memoryOutlineColor);
      ObjectSetInteger(0, prefix + "_RECT", OBJPROP_STYLE, STYLE_DASH);
      ObjectSetInteger(0, prefix + "_RECT", OBJPROP_WIDTH, 1);
      ObjectSetInteger(0, prefix + "_RECT", OBJPROP_BGCOLOR, clrNONE);
      ObjectSetInteger(0, prefix + "_RECT", OBJPROP_FILL, false);

      //--- Main label – dark grey, normal
      if(ObjectFind(0, prefix + "_LBL") >= 0)
        {
         ObjectSetInteger(0, prefix + "_LBL", OBJPROP_COLOR, clrDimGray);
         ObjectSetString(0, prefix + "_LBL", OBJPROP_FONT, "Arial");
        }
      //--- Detailed labels – dim grey, normal
      if(ObjectFind(0, prefix + "_TOP") >= 0)
        {
         ObjectSetInteger(0, prefix + "_TOP", OBJPROP_COLOR, clrDimGray);
         ObjectSetString(0, prefix + "_TOP", OBJPROP_FONT, "Arial");
        }
      if(ObjectFind(0, prefix + "_BOT") >= 0)
        {
         ObjectSetInteger(0, prefix + "_BOT", OBJPROP_COLOR, clrDimGray);
         ObjectSetString(0, prefix + "_BOT", OBJPROP_FONT, "Arial");
        }
      if(ObjectFind(0, prefix + "_MIDPRICE") >= 0)
        {
         ObjectSetInteger(0, prefix + "_MIDPRICE", OBJPROP_COLOR, clrDimGray);
         ObjectSetString(0, prefix + "_MIDPRICE", OBJPROP_FONT, "Arial");
        }
     }
   else
     {
      //--- Active week – solid outline with light fill
      ObjectSetInteger(0, prefix + "_RECT", OBJPROP_COLOR, m_vis.activeOutlineColor);
      ObjectSetInteger(0, prefix + "_RECT", OBJPROP_STYLE, STYLE_SOLID);
      ObjectSetInteger(0, prefix + "_RECT", OBJPROP_WIDTH, m_vis.lineWidth);
      ObjectSetInteger(0, prefix + "_RECT", OBJPROP_FILL, true);
      ObjectSetInteger(0, prefix + "_RECT", OBJPROP_BGCOLOR,
                       ColorSetAlpha(m_vis.activeFillColor, (uchar)(m_vis.activeFillOpacity * 255 / 100)));

      //--- Main label – bold white
      if(ObjectFind(0, prefix + "_LBL") >= 0)
        {
         ObjectSetInteger(0, prefix + "_LBL", OBJPROP_COLOR, clrWhite);
         ObjectSetString(0, prefix + "_LBL", OBJPROP_FONT, "Arial Bold");
        }
      //--- Detailed labels – bold white
      if(ObjectFind(0, prefix + "_TOP") >= 0)
        {
         ObjectSetInteger(0, prefix + "_TOP", OBJPROP_COLOR, clrWhite);
         ObjectSetString(0, prefix + "_TOP", OBJPROP_FONT, "Arial Bold");
        }
      if(ObjectFind(0, prefix + "_BOT") >= 0)
        {
         ObjectSetInteger(0, prefix + "_BOT", OBJPROP_COLOR, clrWhite);
         ObjectSetString(0, prefix + "_BOT", OBJPROP_FONT, "Arial Bold");
        }
      if(ObjectFind(0, prefix + "_MIDPRICE") >= 0)
        {
         ObjectSetInteger(0, prefix + "_MIDPRICE", OBJPROP_COLOR, clrWhite);
         ObjectSetString(0, prefix + "_MIDPRICE", OBJPROP_FONT, "Arial Bold");
        }
     }

//--- Update midpoint visibility
   if(ObjectFind(0, prefix + "_MID") >= 0)
      ObjectSetInteger(0, prefix + "_MID", OBJPROP_TIMEFRAMES,
                       (gap.activeWeek && gap.state != GAP_HISTORICAL) ? OBJ_ALL_PERIODS : OBJ_NO_PERIODS);

//--- Refresh main label text
   if(ObjectFind(0, prefix + "_LBL") >= 0)
     {
      double pipDist = (gap.gapHigh - gap.gapLow) / PipSize();
      string text = StringFormat("WG | %.1fp | %s", pipDist, StateToString(gap.state));
      ObjectSetString(0, prefix + "_LBL", OBJPROP_TEXT, text);
     }
  }
State Machine for Active Gaps (UpdateCurrentState)
The UpdateCurrentState() function defines the state machine that governs how each active gap evolves over time. It runs on every tick and compares the current bid price with the stored high and low boundaries. This allows the indicator to classify price interaction consistently instead of relying on subjective interpretation.
//+------------------------------------------------------------------+
//| STATE UPDATE (active week only)                                  |
//+------------------------------------------------------------------+
void UpdateCurrentState()
  {
   double currentPrice = SymbolInfoDouble(_Symbol, SYMBOL_BID);
   for(int i = 0; i < ArraySize(m_gaps); i++)
     {
      if(!m_gaps[i].activeWeek)
         continue;
      if(m_gaps[i].state == GAP_HISTORICAL || m_gaps[i].state == GAP_FILLED)
         continue;

      bool isGapDown = m_gaps[i].isGapDown;
      double high = m_gaps[i].gapHigh;
      double low  = m_gaps[i].gapLow;
      ENUM_GAP_STATE newState = m_gaps[i].state;

      if(isGapDown)
        {
         if(currentPrice > high)
            newState = GAP_FILLED;
         else
            if(currentPrice > low && currentPrice <= high)
              {
               if(m_gaps[i].state == GAP_FRESH)
                  newState = GAP_PARTIAL;
              }
            else
               if(currentPrice <= low)
                 {
                  if(m_gaps[i].state == GAP_PARTIAL)
                     newState = GAP_REACTION;
                 }
        }
      else
        {
         if(currentPrice < low)
            newState = GAP_FILLED;
         else
            if(currentPrice >= low && currentPrice < high)
              {
               if(m_gaps[i].state == GAP_FRESH)
                  newState = GAP_PARTIAL;
              }
            else
               if(currentPrice >= high)
                 {
                  if(m_gaps[i].state == GAP_PARTIAL)
                     newState = GAP_REACTION;
                 }
        }

      if(newState != m_gaps[i].state)
        {
         m_gaps[i].state = newState;
         UpdateGapVisuals(m_gaps[i], PrefixForIndex(i));
        }
     }
  }
Gap‑down (Friday close above Monday open): The gap area is from low (Monday open) up to high (Friday close).
- Price above high → full fill (GAP_FILLED).
- Price inside the gap → GAP_PARTIAL (only if it was FRESH).
- Price below low after having been PARTIAL → GAP_REACTION (retest of the opposite side).
Gap‑up (Friday close below Monday open): The gap area is from low (Friday close) up to high (Monday open). The logic is mirrored.
State changes trigger UpdateGapVisuals, which updates the rectangle’s outline color and the label text. The ReactionColor input is not yet used but can be integrated later to highlight the rectangle when GAP_REACTION occurs.
Utility Functions – Supporting the Main Logic
Several small helper functions make the code cleaner and more reusable. PipSize() returns the correct pip value for the current symbol, handling 3/5 digit brokers automatically:
double PipSize()
  {
   return (_Digits == 3 || _Digits == 5) ? (_Point * 10.0) : _Point;
  }
GetWeekMonday() returns the datetime of the Monday (00:00) for any given datetime. It handles Sunday correctly (day_of_week == 0) by subtracting 6 days.
datetime GetWeekMonday(datetime t)
  {
   MqlDateTime dt;
   TimeToStruct(t, dt);
   int daysSinceMonday = (dt.day_of_week == 0) ? 6 : (dt.day_of_week - 1);
   return t - daysSinceMonday * 86400 - (t % 86400);
  }
GetNextMondayOpen() simply adds 7 days to a Monday datetime, used to define the right edge of the rectangle.
datetime GetNextMondayOpen(datetime thisMondayOpenTime)
  {
   return thisMondayOpenTime + 7 * 86400;
  }
ColorSetAlpha() applies an alpha channel to an MQL5 color, enabling translucent fills. The ActiveFillOpacity input (0–100) is converted to a 0–255 alpha value.
color ColorSetAlpha(color clr, uchar alpha)
  {
   return (color)((clr & 0x00FFFFFF) | ((uchar)alpha << 24));
  }
StateToString() converts the ENUM_GAP_STATE enumeration to a short string for display in the main label.
string StateToString(ENUM_GAP_STATE state)
  {
   switch(state)
     {
      case GAP_FRESH:     return "FRESH";
      case GAP_PARTIAL:   return "PARTIAL";
      case GAP_REACTION:  return "REACTION";
      case GAP_FILLED:    return "FILLED";
      case GAP_HISTORICAL:return "HIST";
     }
   return "";
  }
These utility functions are short but essential because they isolate recurring calculations and keep the main logic focused on structural behavior. By separating pip handling, time alignment, color transparency, and state-to-text conversion into dedicated helpers, the code becomes easier to maintain, extend, and review.
Outcomes
To test the indicator, download the attached source code file to your computer and compile it in MetaEditor. Then open MetaTrader 5, go to the Indicators section, and drag the indicator onto the chart.
The GIF below shows the results of testing the indicator on EURUSD, H1. Once loaded, the indicator automatically scans historical data and plots all detected weekend gaps from past weeks up to the current market structure.
Each weekend gap structure is visualized using a semi-transparent structural zone, with a midpoint line drawn through the center of the gap. The chart labels display the gap identifier (WG), the measured gap size in pips, and the current structural state of the gap. In most historical cases, the state appears as HIST, indicating that the gap belongs to a completed historical trading week.
The visualization allows historical and current weekend gap zones to remain visible on the chart, creating a structured reference map that can be used to study future price interaction with previously formed imbalance zones.
Notice how completed historical gaps remain visible while the active weekly gap continues updating dynamically as new price data arrives.
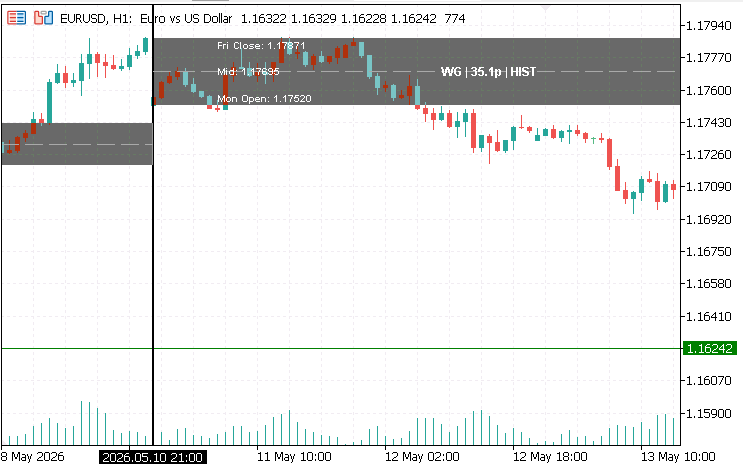
The test results show that weekend gaps frequently become revisitation zones after market reopening. As illustrated in the screenshot above, price often reacts first at the outer boundaries of the weekend gap structure before interacting with the midpoint equilibrium level. This behavior supports the view that weekend gaps can function as short-term liquidity redistribution regions within broader market structure, making them useful for analyzing reversals, continuations, and price rebalancing behavior.
Conclusion
The completed solution transforms weekend gaps from temporary chart breaks into persistent analytical zones. After following the article, the reader has a working MQL5 framework that detects weekend discontinuities, plots the gap range and midpoint, labels each structure with its size and state, and preserves older gaps as historical reference levels. The result is a ready-to-use weekend gap structure that makes price interaction around the gap high, midpoint, and low easier to study. Rather than treating the weekend gap as a one-time event, the trader can now observe how price revisits and reacts to these imbalance regions over time.
It is important to note that this framework does not generate trade entries or automated buy/sell signals. Its purpose is to simplify the visual interpretation of weekend gaps and their interaction with market structure. This implementation establishes the structural foundation required for future weekend-gap interaction models. In later developments, the framework can be extended to classify rejection behavior, midpoint interaction patterns, liquidity sweeps, and eventually automated execution logic through Expert Advisors.
Warning: All rights to these materials are reserved by MetaQuotes Ltd. Copying or reprinting of these materials in whole or in part is prohibited.
This article was written by a user of the site and reflects their personal views. MetaQuotes Ltd is not responsible for the accuracy of the information presented, nor for any consequences resulting from the use of the solutions, strategies or recommendations described.

- Free trading apps
- Over 8,000 signals for copying
- Economic news for exploring financial markets
You agree to website policy and terms of use