
How to Detect and Normalize Chart Objects in MQL5 (Part 2): Collecting and Structuring Data from Complex Analytical Objects

Contents
- Introduction
- Understanding Complex Analytical Objects
- Data Extraction Challenges for Complex Objects
- Manually Inspecting a Pitchfork
- Step 1 – Creating the Base Detector (Part 1) – ChartObjectDetector.mqh
- Step 2 – Creating the Complex Object Data Collector (ComplexObjectDataCollector.mqh)
- Step 3 – Creating the Test Expert Advisor (TestComplexObjectsEA.mq5)
- Testing and Validation
- Attachments and Installation Summary
- Conclusion
Introduction
Part 1 of this series introduced a detector that identifies analytical objects (trendlines, horizontals, rectangles, Fibonacci tools) and returns their basic time‑price coordinates. However, complex objects such as Fibonacci retracements, channels, and Pitchforks carry richer information: multiple levels, slopes, and geometric relationships. The simple coordinate pairs are insufficient for algorithmic strategies that rely on specific retracement ratios, channel boundaries, or median line touches.
This article extends the detector to collect and structure data from complex analytical objects. You will learn how to extract Fibonacci level arrays (ratios and corresponding prices), capture channel anchor points, and parse Pitchfork geometry. The data is normalized into an extended structure that preserves all relevant metrics, enabling rule‑based decisions such as “enter at 0.618 retracement” or “alert when price touches the median line of a Pitchfork.”
The implementation covers OBJ_FIBO (retracement/extensions), OBJ_FIBOTIMES, OBJ_FIBOFAN, OBJ_FIBOARC, OBJ_CHANNEL (equidistant channel), and OBJ_PITCHFORK. The same pattern can be applied to cycles and Gann tools.
You will obtain two files:
- ComplexObjectDataCollector.mqh (a class that inherits from the Part 1 detector and adds complex data extraction) and
- TestComplexObjectsEA.mq5 (a timer‑based test EA that logs actual Fibonacci price levels, channel points, and Pitchfork geometry with real‑time alerts).
Understanding Complex Analytical Objects
Foundations of Fibonacci Analysis
The entire family of Fibonacci tools traces back to the 13th‑century Italian mathematician Leonardo Bonacci, better known as Fibonacci. In his 1202 book “Liber Abaci” (The Book of Calculation), Fibonacci introduced Europe to the Hindu‑Arabic numeral system. He also posed a famous rabbit‑breeding problem that led to the sequence now bearing his name: 0, 1, 1, 2, 3, 5, 8, 13, 21, 34, 55, 89, 144, 233 …
The sequence is defined by the simple recurrence:
![]()
The remarkable property that underpins all Fibonacci‑based financial analysis is the convergence of the ratio of consecutive terms: as n increases, the ratio of consecutive terms approaches the inverse of the golden ratio (approximately 0.618), while the ratio itself approaches φ (approximately 1.618).
This constant φ, also known as the golden ratio or Phi, satisfies the algebraic equation
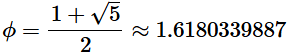 and
and
can be expressed exactly as
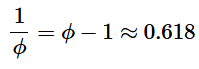
Its inverse equals φ minus one, approximately 0.618. These relationships give rise to the key Fibonacci retracement levels: 23.6% (0.236, derived from one number divided by the number three places to its right), 38.2% (0.382, from division two places to the right), 50% (not a true Fibonacci ratio but a widely used halfway point), and 61.8% (0.618, the inverse of the golden ratio). The 78.6% level is the square root of 0.618. Extension levels such as 161.8%, 261.8%, and 423.6% are obtained by applying these ratios above 100%.
Fibonacci retracements (OBJ_FIBO): mathematical foundation and trading principles
A Fibonacci retracement object is defined by two anchor points: point A (the start of a significant price move) and point B (the end of that move). The vertical price difference is then used to compute the price at each retracement level ratio r as:
![]()
for an upward move, or
![]()
for a downward move.
The standard ratios are r in the set {0.0, 0.236, 0.382, 0.500, 0.618, 0.786, 1.0, 1.272, 1.618, 2.618, 4.236}. The core trading hypothesis, first observed by early technical analysts who applied Fibonacci’s work to financial markets, is that after a strong price movement in one direction, the price often retraces (pulls back) a predictable portion of that move before continuing in the original direction. The most commonly watched levels are 38.2% and 61.8%, as these represent the strongest mathematical resistance from the golden ratio relationships. When the price bounces off these levels, traders interpret it as a validation of the trend continuation; a break through the 61.8% level, however, often signals a potential trend reversal.
Fibonacci fans (OBJ_FIBOFAN): applying ratios to trendline slopes
Fibonacci fans extend the retracement concept from horizontal lines to angled trendlines. The tool first draws a vertical “invisible” line from the second anchor point. The retracement ratios (38.2%, 50%, 61.8%) are then multiplied by the vertical height of the move to determine three points along that vertical line. The construction formula: for an upward move from trough T to peak P, the vertical distance D = P - T.
The fan ratios r in {0.382, 0.5, 0.618} give points at heights
![]()
above T along the vertical line through P.
The fan lines then connect T to each of these points, projecting potential support levels into the future. Finally, trendlines are drawn from the first anchor point through each of those three points, creating a “fan” of lines radiating from the origin. These fan lines are then used to gauge the speed and slope of subsequent price movements. The mathematical principle is that after a strong move, the subsequent corrective move should respect the same proportional ratios when measured at an angle. Fan lines can act as support or resistance and provide signals similar to horizontal Fibonacci levels. They also adapt to the timeframe and market volatility.
Fibonacci arcs (OBJ_FIBOARC): curved support and resistance
Fibonacci arcs use the same retracement ratios but draw circular arcs instead of straight lines. After defining a trendline between two extreme points (e.g., a trough and a peak), three arcs are drawn, centered on the second extreme point, with radii equal to the distances from the center to points on the trendline at the Fibonacci ratios (38.2%, 50%, 61.8%). The arcs then intersect the price chart at potential support or resistance zones. The interpretation is that as price retraces after a strong move, it may encounter these curved arcs as dynamic support or resistance levels. Unlike horizontal retracement lines that consider only price, arcs incorporate both time and price distance, making them more sensitive to the geometry of the chart. A known limitation is that arcs are drawn as true circles. Therefore, their shape and intersection points vary with the chart's time/price scaling.
Fibonacci time zones (OBJ_FIBOTIMES): temporal projections
Fibonacci time zones shift the focus from price to time. Starting from a significant swing high or low, vertical lines are drawn to the right at intervals that increase according to the Fibonacci sequence (0, 1, 1, 2, 3, 5, 8, 13, 21, 34, 55, 89, 144, 233 …)
The sequence is defined by F₁ = 1, F₂ = 1, and for n ≥ 3,
![]()
The time zones are not intended to pinpoint exact turning points, but rather to highlight windows of increased probability for significant price changes. In practice, the early zones (1, 2, 3, 5) are often too clustered to be useful, and traders tend to focus on the later zones starting from 21 periods onward.
Equidistant channel (OBJ_CHANNEL): the foundation of trend channel analysis
The equidistant channel is one of the oldest and most intuitive analytical tools, dating back to the early days of charting. It is defined by three anchor points: the first two (A and B) define the base trendline (the direction and slope of the channel), and the third point (C) defines the width by determining the vertical distance from the base line to the opposite channel boundary. The third point is typically a swing high in a rising channel or a swing low in a falling channel. The channel lines are parallel by construction: once the base line is drawn through points A and B, a parallel line is drawn through point C.
The mathematical condition for parallelism is that the slopes of the two lines are equal:
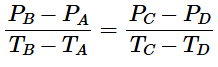
The equidistant channel can be ascending (bullish, higher highs and higher lows) or descending (bearish, lower highs and lower lows). The name “equidistant” refers to the constant perpendicular distance between the two channel lines. Trading with channels is based on the assumption that the market will continue to oscillate between the two parallel boundaries until a breakout occurs. Standard channel trading rules identify entries at the lower boundary (in an uptrend) or the upper boundary (in a downtrend), with stops placed just beyond the opposite channel line and profit targets set at the projected width of the channel.
Andrews pitchfork (OBJ_PITCHFORK): median line analysis
The Andrews pitchfork, also known as median line analysis, was developed by Dr. Alan Andrews (a 20th‑century engineer and economist) and was built upon earlier concepts from economist Roger Babson and cartographer George Marechal from the 1930s. The tool is defined by three points: A (the starting pivot, often a significant swing high or low), B (the first opposing swing), and C (the second swing in the same direction as A).
The construction proceeds as follows: first, compute the midpoint M of points B and C:
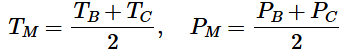 .
.
The median line is then drawn from point A through M, extending forward and backward. This line represents the primary equilibrium of the channel. Second, parallel lines are drawn through points B and C, maintaining the slope of the median line. The median line slope is given by
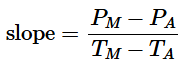
These three lines form a “Pitchfork” shape (hence the name) that projects a channel of potential future price action. The core principle, observed by Andrews after extensive empirical study, is that price tends to return to the median line approximately 80% of the time. When price fails to reach the median, a reversal may be imminent. Additionally, Andrews and his followers identified the “action‑reaction” principle, based on Newton’s third law, stating that the distance the price travels away from the median line on one side will often be matched by an equal reaction on the opposite side. In Part 3 of this series, we will extend the pitchfork extraction to incorporate action and reaction lines, as well as the lattice matrix methodology introduced by Patrick Mikula.
Cycles (OBJ_CYCLES): Hurst’s cyclic theory and spectral analysis
The cycles analytical object represents periodic fluctuations in price data. The modern framework for cycle analysis in financial markets is largely attributed to J.M. Hurst, an American engineer who published “The Profit Magic of Stock Transaction Timing” in the 1970s and claimed a 90% success rate trading on his cyclic theory. Hurst’s central proposition is that all financial market price movements are the composite result of multiple interacting cycles, each with its own period, amplitude, and phase. These cycles are harmonically related: a dominant cycle length is often approximately 2, 4, or 8 times longer than shorter cycles. This leads to the F‑degree scaling model, where each degree of cycle is twice the period of the next lower degree.
The mathematical representation of a single cycle is a sinusoidal wave:
![]() ,
,
where:
- A is amplitude,
- f is frequency (inverse of period),
- t is time, and φ is phase.
Hurst’s method, known as phasing analysis, involves decomposing price into its constituent cycles using digital signal processing techniques such as band‑pass filters and spectral estimation. In modern practice, the Hurst coefficient (H) is used to classify a time series as mean‑reverting (H less than 0.5) or trending (H greater than 0.5), while the discrete Fourier transform (DFT) or maximum entropy spectral analysis (MESA) can identify the dominant cycle length. The practical trading application of cycle analysis is to anticipate turning points when multiple cycles align at their troughs or peaks, creating a strong composite signal. The OBJ_CYCLES chart object allows the trader to draw such anticipated cycle highs and lows forward in time. In this collector, we extract only the cycle object’s anchor points. Full cycle decomposition and spectral analysis are beyond this article's scope and will be revisited later.
Data Extraction Challenges for Complex Objects
Fibonacci objects contain a dynamic number of levels – we use OBJPROP_LEVELS and OBJPROP_LEVELVALUE. Channels and Pitchforks use three anchor points via indexed access. For Pitchforks, additional levels are retrieved with OBJPROP_LEVELVALUE (offset) and OBJPROP_LEVELTEXT (label). The base detector (Part 1) already reads the two main anchor points for trendlines, channels, and rectangles, but for Fibonacci and Pitchfork it leaves them as zeros – the complex detector will add the missing information.
Manually Inspecting a Pitchfork
Before writing code, it is helpful to see exactly where the raw properties of a complex object come from. Let us take an Andrews Pitchfork as an example. You can manually inspect its anchor points and additional levels using MetaTrader’s built‑in object properties dialog.
Step‑by‑step manual inspection:
- Draw a Pitchfork on any chart (Insert → Andrews Pitchfork). Click, hold and drag three times to set the three anchor points (A, B, C).
- Right‑click the pitchfork and select “Properties…” (or double‑click the object). A dialog window appears.
- In the “Parameters” tab, you will see the exact time and price coordinates for all three anchor points under “Coordinates”:
- Point 1 – the handle start (pivot A).
- Point 2 – the first opposing swing (pivot B).
- Point 3 – the second swing (pivot C), which together with B determines the median line.
- If you have added extra levels (e.g., 361.8%, 461.8%), click the “Levels” tab. For each level you will see:
- Value – for a Pitchfork this is a price offset (not a ratio). MetaTrader automatically converts a ratio like 0.618 into the appropriate offset based on the Pitchfork’s geometry.
- Description – a text label, e.g., “361.8”.
The screenshot below shows the Pitchfork properties dialog with the three anchor points highlighted and the additional levels tab visible.
Fig. 1 – Andrews Pitchfork properties: anchor points (Parameters tab) and additional levels (Levels tab).
Every number you see in this dialog – the time and price of Point 1, Point 2, Point 3, and the level values – corresponds exactly to what the MQL5 functions ObjectGetInteger(), ObjectGetDouble(), and ObjectGetString() will read. The complex detector we build later simply collects these same values programmatically. By manually inspecting an object, you can verify that the EA is extracting the correct data.
This same approach works for any analytical object: Fibonacci retracements show their ratios in the Levels tab, channels show three points in the Parameters tab, and trendlines show two points. Understanding where the raw data lives makes it much easier to trust what the EA reports.
Step 1 – Creating the Base Detector (Part 1) – ChartObjectDetector.mqh
1. Prerequisites and Folder SetupBefore writing any code, create the following folder inside your MetaTrader 5 installation directory:
- MQL5/Include/ChartObjectsAlgorithms/ – this will hold the detector include files.
First, we create the file ChartObjectDetector.mqh inside MQL5/Include/ChartObjectsAlgorithms/. This is the detector from Part 1, which we will extend. The base class stores the chart ID in a protected member so that derived classes can access it.
File header and the SChartObjectInfo structure
Every MQL5 file should start with a comment block indicating its name, author, and website, followed by #property directives. The structure SChartObjectInfo holds the basic information that every analytical object shares: name, type, readable type name, and two anchor points (time1/price1 and time2/price2).
//+------------------------------------------------------------------+
//|                                          ChartObjectDetector.mqh |
//|                                 Copyright 2026, Clemence Benjamin|
//|                                               http://www.mql5.com|
//+------------------------------------------------------------------+
#property copyright "Copyright 2026, Clemence Benjamin"
#property link      "https://www.mql5.com"
#property strict

//+------------------------------------------------------------------+
//| Structure to hold normalized object data                         |
//+------------------------------------------------------------------+
struct SChartObjectInfo
  {
   string            name;       // object name as seen on the chart
   int               type;       // ENUM_OBJECT constant (e.g., OBJ_TREND)
   string            type_name;  // human-readable type, e.g., "TREND"
   datetime          time1;      // time coordinate of first anchor point
   datetime          time2;      // time coordinate of second anchor point
   double            price1;     // price coordinate of first anchor point
   double            price2;     // price coordinate of second anchor point
  };
2. Object type to string conversion
This helper function translates the numeric ENUM_OBJECT value into a readable string. It will be used when logging detected objects. The switch statement covers all object types we are interested in, plus a default case for unknown types.
//+------------------------------------------------------------------+
//| Convert Object Type to Readable String                           |
//+------------------------------------------------------------------+
string ObjectTypeToString(int type)
  {
   switch(type)
     {
      case OBJ_TREND:        return("TREND");
      case OBJ_RECTANGLE:    return("RECTANGLE");
      case OBJ_CHANNEL:      return("CHANNEL");
      case OBJ_HLINE:        return("HLINE");
      case OBJ_VLINE:        return("VLINE");
      case OBJ_FIBO:         return("FIBO");
      case OBJ_FIBOTIMES:    return("FIBOTIMES");
      case OBJ_FIBOFAN:      return("FIBOFAN");
      case OBJ_FIBOARC:      return("FIBOARC");
      case OBJ_PITCHFORK:    return("PITCHFORK");
      default:               return("UNKNOWN");
     }
  }
3. The base detector class declaration
The class CChartObjectDetector is declared with a protected member m_chart_id (so derived classes can access it) and public methods: Init() to set the chart ID, Total() to get the object count, and Detect() to populate an array of SChartObjectInfo. The ExtractProperties() method is protected because it will be called by derived classes as well.
//+------------------------------------------------------------------+
//| Chart Object Detection Class                                     |
//+------------------------------------------------------------------+
class CChartObjectDetector
  {
protected:
   long              m_chart_id;               // chart ID (accessible to derived classes)
   void              ExtractProperties(string name, int type, SChartObjectInfo &obj);

public:
   void              Init(long chart_id = 0) { m_chart_id = (chart_id == 0) ? ChartID() : chart_id; }
   int               Total()                { return(ObjectsTotal(m_chart_id)); }
   int               Detect(SChartObjectInfo &out_objects[]);
  };
4. Implementing the Detect method
The Detect method loops over all objects on the chart, retrieves each object’s name and type, and then calls ExtractProperties to fill the basic coordinates. Note that we do not filter by object type in the base class – that will be done in the complex detector. The array is resized at the end to the exact number of objects found.
//+------------------------------------------------------------------+
//| Detects all chart objects (base version)                         |
//+------------------------------------------------------------------+
int CChartObjectDetector::Detect(SChartObjectInfo &out_objects[])
  {
   int total = ObjectsTotal(m_chart_id);
   ArrayResize(out_objects, total);
   int count = 0;

   for(int i = 0; i < total; i++)
     {
      string name = ObjectName(m_chart_id, i);
      if(name == "")
         continue;
      if(ObjectFind(m_chart_id, name) < 0)
         continue;

      int type = (int)ObjectGetInteger(m_chart_id, name, OBJPROP_TYPE);
      SChartObjectInfo obj;
      obj.name      = name;
      obj.type      = type;
      obj.type_name = ObjectTypeToString(type);
      obj.time1 = obj.time2 = 0;
      obj.price1 = obj.price2 = 0.0;

      ExtractProperties(name, type, obj);
      out_objects[count++] = obj;
     }

   ArrayResize(out_objects, count);
   return(count);
  }
5. Extracting the two anchor points (including Fibonacci objects)
The ExtractProperties method uses a switch statement to handle different object types. For trendlines, channels, rectangles, and all Fibonacci objects, we read the two anchor points using indices 0 and 1 with ObjectGetInteger for time and ObjectGetDouble for price. Horizontal and vertical lines are handled separately. This is the critical fix that enables Fibonacci price calculation.
//+------------------------------------------------------------------+
//| Extracts properties for supported object types                   |
//+------------------------------------------------------------------+
void CChartObjectDetector::ExtractProperties(string name, int type, SChartObjectInfo &obj)
  {
   switch(type)
     {
      case OBJ_TREND:
      case OBJ_CHANNEL:
      case OBJ_RECTANGLE:
      case OBJ_FIBO:
      case OBJ_FIBOTIMES:
      case OBJ_FIBOFAN:
      case OBJ_FIBOARC:
        {
         obj.time1  = (datetime)ObjectGetInteger(m_chart_id, name, OBJPROP_TIME, 0);
         obj.price1 = ObjectGetDouble(m_chart_id, name, OBJPROP_PRICE, 0);
         obj.time2  = (datetime)ObjectGetInteger(m_chart_id, name, OBJPROP_TIME, 1);
         obj.price2 = ObjectGetDouble(m_chart_id, name, OBJPROP_PRICE, 1);
         break;
        }
      case OBJ_HLINE:
        {
         obj.price1 = ObjectGetDouble(m_chart_id, name, OBJPROP_PRICE, 0);
         break;
        }
      case OBJ_VLINE:
        {
         obj.time1 = (datetime)ObjectGetInteger(m_chart_id, name, OBJPROP_TIME, 0);
         break;
        }
      default:
        //--- For other types (Pitchfork, etc.) we keep zeros; derived classes will add data.
        break;
     }
  }
Save the file. This completes the base detector.
Step 2 – Creating the Complex Object Data Collector (ComplexObjectDataCollector.mqh)
Now we create ComplexObjectDataCollector.mqh in the same folder. This file includes the base detector, defines a global filter function, extends the structure, and implements the complex extractions.
1. Include and global analytical object filter
We first include the base detector using double quotes because the file is in the same folder (relative path). The function IsAnalyticalObject determines which object types we consider “analytical” – i.e., those we want to process. This function will be used in the Detect method to filter out labels, buttons, and other non‑trading objects.
//+------------------------------------------------------------------+
//|                                   ComplexObjectDataCollector.mqh |
//|                                Copyright 2026, Clemence Benjamin |
//|                                             https://www.mql5.com |
//+------------------------------------------------------------------+
#property copyright "Copyright 2026, Clemence Benjamin"
#property link      "https://www.mql5.com"

#include "ChartObjectDetector.mqh"

//+------------------------------------------------------------------+
//| Helper: Determine if object type is analytical                   |
//+------------------------------------------------------------------+
bool IsAnalyticalObject(int type)
  {
   switch(type)
     {
      case OBJ_FIBO:
      case OBJ_FIBOTIMES:
      case OBJ_FIBOFAN:
      case OBJ_FIBOARC:
      case OBJ_CHANNEL:
      case OBJ_PITCHFORK:
      case OBJ_TREND:
      case OBJ_RECTANGLE:
         return(true);
      default:
         return(false);
     }
  }
2. Extended structure SComplexObjectInfo
This structure inherits from SChartObjectInfo (so it automatically gets the name, type, type_name, time1/price1, time2/price2 fields). It adds dynamic arrays for Fibonacci ratios and prices, fixed arrays for the three channel points, and fields for Pitchfork geometry (handle, median point, and additional levels).
//+------------------------------------------------------------------+
//| Extended structure for complex objects                           |
//+------------------------------------------------------------------+
struct SComplexObjectInfo : public SChartObjectInfo
  {
   //--- Fibonacci specific
   double   fibo_ratios[];      // level ratios (0.236, 0.382, etc.)
   double   fibo_prices[];      // actual price at each ratio
   //--- Channel specific (3 anchor points)
   datetime channel_time[3];
   double   channel_price[3];
   //--- Pitchfork specific
   datetime pitchfork_handle_time[2];
   double   pitchfork_handle_price[2];
   datetime pitchfork_median_time;
   double   pitchfork_median_price;
   //--- Pitchfork additional levels (optional)
   double   pitchfork_level_values[];   // offset from median line (price units)
   string   pitchfork_level_texts[];    // description (e.g., "61.8")
  };
3. Class declaration
The complex detector inherits from the base detector. It overrides the Detect method to return an array of SComplexObjectInfo and adds private methods for extracting the complex data.
//+------------------------------------------------------------------+
//| Complex Object Detector Class                                    |
//+------------------------------------------------------------------+
class CComplexObjectDetector : public CChartObjectDetector
  {
public:
   int Detect(SComplexObjectInfo &out_objects[]);

private:
   void ExtractFibonacciLevels(string name, SComplexObjectInfo &obj);
   void ComputeActualFibonacciPrices(SComplexObjectInfo &obj);
   void ExtractChannelPoints(string name, SComplexObjectInfo &obj);
   void ExtractPitchforkData(string name, SComplexObjectInfo &obj);
  };
4. The main Detect method of the complex detector
This method first calls the base ExtractProperties to fill the two anchor points. Then, depending on the object type, it invokes the appropriate complex extraction functions. Note the use of the global IsAnalyticalObject to filter only relevant objects.
//+------------------------------------------------------------------+
//| Detects all complex analytical objects                           |
//+------------------------------------------------------------------+
int CComplexObjectDetector::Detect(SComplexObjectInfo &out_objects[])
  {
   int total = ObjectsTotal(m_chart_id);
   ArrayResize(out_objects, total);
   int count = 0;

   for(int i = 0; i < total; i++)
     {
      string name = ObjectName(m_chart_id, i);
      if(name == "")
         continue;
      if(ObjectFind(m_chart_id, name) < 0)
         continue;

      int type = (int)ObjectGetInteger(m_chart_id, name, OBJPROP_TYPE);
      if(!IsAnalyticalObject(type))
         continue;

      SComplexObjectInfo obj;
      //--- Initialize base fields
      obj.name      = name;
      obj.type      = type;
      obj.type_name = ObjectTypeToString(type);
      obj.time1 = obj.time2 = 0;
      obj.price1 = obj.price2 = 0.0;

      //--- Extract base two points (using protected base method)
      ExtractProperties(name, type, obj);

      //--- Complex extractions
      if(type == OBJ_FIBO || type == OBJ_FIBOTIMES || type == OBJ_FIBOFAN || type == OBJ_FIBOARC)
        {
         ExtractFibonacciLevels(name, obj);
         ComputeActualFibonacciPrices(obj);
        }
      if(type == OBJ_CHANNEL)
         ExtractChannelPoints(name, obj);
      if(type == OBJ_PITCHFORK)
         ExtractPitchforkData(name, obj);

      out_objects[count++] = obj;
     }

   ArrayResize(out_objects, count);
   return(count);
  }
5. Extracting Fibonacci levels and computing actual prices
The method ExtractFibonacciLevels reads the total number of levels using OBJPROP_LEVELS, resizes the dynamic arrays, and then iterates over each level to retrieve the ratio via OBJPROP_LEVELVALUE. The ComputeActualFibonacciPrices function then calculates the actual price for each level using the anchor points (price1, price2) – which were filled by the base detector – and the direction of the move (positive delta = upward, negative = downward).
//+------------------------------------------------------------------+
//| Extracts Fibonacci level ratios                                  |
//+------------------------------------------------------------------+
void CComplexObjectDetector::ExtractFibonacciLevels(string name, SComplexObjectInfo &obj)
  {
   int levels = (int)ObjectGetInteger(m_chart_id, name, OBJPROP_LEVELS);
   if(levels <= 0)
      return;
   ArrayResize(obj.fibo_ratios, levels);
   ArrayResize(obj.fibo_prices, levels);
   for(int i = 0; i < levels; i++)
     {
      obj.fibo_ratios[i] = ObjectGetDouble(m_chart_id, name, OBJPROP_LEVELVALUE, i);
      obj.fibo_prices[i] = 0.0;
     }
  }

//+------------------------------------------------------------------+
//| Computes actual prices from ratios and anchor points             |
//+------------------------------------------------------------------+
void CComplexObjectDetector::ComputeActualFibonacciPrices(SComplexObjectInfo &obj)
  {
   double delta = obj.price2 - obj.price1;
   if(delta == 0.0)
      return;
   int size = ArraySize(obj.fibo_ratios);
   for(int i = 0; i < size; i++)
     {
      if(delta > 0)
         obj.fibo_prices[i] = obj.price1 + delta * obj.fibo_ratios[i];
      else
         obj.fibo_prices[i] = obj.price1 - fabs(delta) * obj.fibo_ratios[i];
     }
  }
6. Extracting channel points
An equidistant channel stores three anchor points: indices 0 and 1 define the base line, index 2 defines the opposite boundary. We read the time and price for each index using indexed access to OBJPROP_TIME and OBJPROP_PRICE.
//+------------------------------------------------------------------+
//| Extracts three channel points                                    |
//+------------------------------------------------------------------+
void CComplexObjectDetector::ExtractChannelPoints(string name, SComplexObjectInfo &obj)
  {
   for(int i = 0; i < 3; i++)
     {
      obj.channel_time[i]  = (datetime)ObjectGetInteger(m_chart_id, name, OBJPROP_TIME, i);
      obj.channel_price[i] = ObjectGetDouble(m_chart_id, name, OBJPROP_PRICE, i);
     }
  }
7. Extracting pitchfork data (handle, median point, additional levels)
The pitchfork’s three anchor points are stored as: handle start (index 0), handle end (index 1), and median point (index 2). We also read any additional levels that the user may have added (e.g., Fibonacci ratio lines). For each additional level, we retrieve the offset value (price units from the median line) and the descriptive text (e.g., “61.8”).
//+------------------------------------------------------------------+
//| Extracts pitchfork handle, median point, and additional levels   |
//+------------------------------------------------------------------+
void CComplexObjectDetector::ExtractPitchforkData(string name, SComplexObjectInfo &obj)
  {
   //--- Handle points (indices 0 and 1)
   for(int i = 0; i < 2; i++)
     {
      obj.pitchfork_handle_time[i]  = (datetime)ObjectGetInteger(m_chart_id, name, OBJPROP_TIME, i);
      obj.pitchfork_handle_price[i] = ObjectGetDouble(m_chart_id, name, OBJPROP_PRICE, i);
     }
   //--- Median point (index 2)
   obj.pitchfork_median_time  = (datetime)ObjectGetInteger(m_chart_id, name, OBJPROP_TIME, 2);
   obj.pitchfork_median_price = ObjectGetDouble(m_chart_id, name, OBJPROP_PRICE, 2);

   //--- Additional levels (if any)
   int levels = (int)ObjectGetInteger(m_chart_id, name, OBJPROP_LEVELS);
   if(levels > 0)
     {
      ArrayResize(obj.pitchfork_level_values, levels);
      ArrayResize(obj.pitchfork_level_texts, levels);
      for(int i = 0; i < levels; i++)
        {
         obj.pitchfork_level_values[i] = ObjectGetDouble(m_chart_id, name, OBJPROP_LEVELVALUE, i);
         obj.pitchfork_level_texts[i]  = ObjectGetString(m_chart_id, name, OBJPROP_LEVELTEXT, i);
        }
     }
  }
Save the file. The complex detector is ready.
Step 3 – Creating the Test Expert Advisor (TestComplexObjectsEA.mq5)
The test EA demonstrates how to use the complex detector. It runs detection every 5 seconds and prints all collected data, including Fibonacci price levels, channel anchor points, pitchfork median line values, and additional level lines. The EA now also prints data for trendlines, rectangles, and horizontal/vertical lines – making it a complete diagnostic tool for all analytical objects.
1. File header, include, and global variables
We include the complex detector using angle brackets because the file is located in the ChartObjectsAlgorithms subfolder of the standard Include directory. Then we declare an instance of the detector and a dynamic array to hold the detected objects.
//+------------------------------------------------------------------+
//|                                         TestComplexObjectsEA.mq5 |
//|                                Copyright 2026, Clemence Benjamin |
//|                                             https://www.mql5.com |
//+------------------------------------------------------------------+
#property copyright "Copyright 2026, Clemence Benjamin"
#property link      "https://www.mql5.com"
#property version   "1.00"
#property strict

#include <ChartObjectsAlgorithms/ComplexObjectDataCollector.mqh>

CComplexObjectDetector detector;
SComplexObjectInfo objects[];
2. OnInit – initializing the detector
The OnInit function is called when the EA is attached to a chart. We initialize the detector with 0 (meaning the current chart). A confirmation message is printed to the Experts log.
//+------------------------------------------------------------------+
//| Expert initialization function                                   |
//+------------------------------------------------------------------+
int OnInit()
  {
   detector.Init(0);   // current chart
   Print("Complex Object Test EA Initialized – detecting all analytical objects");
   return(INIT_SUCCEEDED);
  }
3. Helper functions – line value computation
We define two helper functions: one for the Pitchfork median line (using the handle start and median point) and one generic function to compute the current price of any line defined by two points.
//+------------------------------------------------------------------+
//| Computes median line value at a given time (pitchfork)           |
//+------------------------------------------------------------------+
double PitchforkMedianValue(datetime t, datetime t0, double p0, datetime t1, double p1)
  {
   if(t1 == t0)
      return(p0);
   double slope = (p1 - p0) / (double)(t1 - t0);
   return(p0 + slope * (t - t0));
  }

//+------------------------------------------------------------------+
//| Computes current price of a line defined by two points           |
//+------------------------------------------------------------------+
double LineValueAtTime(datetime t, datetime t0, double p0, datetime t1, double p1)
  {
   if(t1 == t0)
      return(p0);
   double slope = (p1 - p0) / (double)(t1 - t0);
   return(p0 + slope * (t - t0));
  }
4. OnTick – throttled detection and complete logging
The OnTick function is called on every price tick. In this article, we throttle detection to once every 5 seconds. This keeps the log readable and avoids overloading the UI thread during development. After calling detector.Detect(objects), we iterate over the returned array and print data for every object type: horizontal lines, vertical lines, rectangles, trendlines, Fibonacci, channels, and Pitchforks.
//+------------------------------------------------------------------+
//| Expert tick function – throttled to 5 seconds                    |
//+------------------------------------------------------------------+
void OnTick()
  {
   static datetime last_run = 0;
   if(TimeCurrent() - last_run < 5)
      return;
   last_run = TimeCurrent();

   int total = detector.Detect(objects);
   Print("------ DETECTED COMPLEX OBJECTS: ", total, " ------");

   double point = SymbolInfoDouble(_Symbol, SYMBOL_POINT);
   double bid = SymbolInfoDouble(_Symbol, SYMBOL_BID);
   datetime now = TimeCurrent();

   for(int i = 0; i < total; i++)
     {
      Print("Object: ", objects[i].name, " | Type: ", objects[i].type_name);

      //--- Horizontal Line
      if(objects[i].type == OBJ_HLINE)
        {
         Print("  Horizontal level: ", objects[i].price1);
         if(MathAbs(bid - objects[i].price1) <= 5 * point)
            Print("    >>> ALERT: Price near horizontal line");
        }

      //--- Vertical Line
      if(objects[i].type == OBJ_VLINE)
        {
         Print("  Vertical line time: ", TimeToString(objects[i].time1));
        }

      //--- Rectangle
      if(objects[i].type == OBJ_RECTANGLE)
        {
         Print("  Rectangle corners:");
         PrintFormat("    Corner 1: %s @ %.5f", TimeToString(objects[i].time1), objects[i].price1);
         PrintFormat("    Corner 2: %s @ %.5f", TimeToString(objects[i].time2), objects[i].price2);
         double range_pips = MathAbs(objects[i].price2 - objects[i].price1) / point;
         PrintFormat("  Vertical range: %.1f pips", range_pips);
        }

      //--- Trendline
      if(objects[i].type == OBJ_TREND)
        {
         Print("  Trendline anchor points:");
         PrintFormat("    Point 1: %s @ %.5f", TimeToString(objects[i].time1), objects[i].price1);
         PrintFormat("    Point 2: %s @ %.5f", TimeToString(objects[i].time2), objects[i].price2);
         double line_now = LineValueAtTime(now, objects[i].time1, objects[i].price1, objects[i].time2, objects[i].price2);
         double distance = (bid - line_now) / point;
         PrintFormat("  Current value: %.5f (distance %.1f pips)", line_now, distance);
         if(MathAbs(distance) <= 5.0)
            Print("    >>> ALERT: Price near trendline");
        }

      //--- Fibonacci
      int fibLevels = ArraySize(objects[i].fibo_prices);
      if(fibLevels > 0)
        {
         Print("  Fibonacci levels (ratio -> price):");
         for(int l = 0; l < fibLevels; l++)
           {
            PrintFormat("    %.3f -> %.5f", objects[i].fibo_ratios[l], objects[i].fibo_prices[l]);
            if(MathAbs(bid - objects[i].fibo_prices[l]) <= 5 * point)
               Print("    >>> ALERT: Price near Fibonacci level ", objects[i].fibo_prices[l]);
           }
        }

      //--- Equidistant Channel
      if(objects[i].type == OBJ_CHANNEL)
        {
         Print("  Channel anchor points:");
         for(int p = 0; p < 3; p++)
            PrintFormat("    Point %d: %s @ %.5f", p, TimeToString(objects[i].channel_time[p]), objects[i].channel_price[p]);

         double t0 = (double)objects[i].channel_time[0];
         double t1 = (double)objects[i].channel_time[1];
         double p0 = objects[i].channel_price[0];
         double p1 = objects[i].channel_price[1];
         if(t1 != t0)
           {
            double slope = (p1 - p0) / (t1 - t0);
            double base_now = p0 + slope * ((double)now - t0);
            PrintFormat("  Current value of base line: %.5f (distance %.1f pips)", base_now, MathAbs(bid - base_now) / point);
           }
        }

      //--- Andrews Pitchfork
      if(objects[i].type == OBJ_PITCHFORK)
        {
         datetime t_handle = objects[i].pitchfork_handle_time[0];
         double p_handle = objects[i].pitchfork_handle_price[0];
         datetime t_median = objects[i].pitchfork_median_time;
         double p_median = objects[i].pitchfork_median_price;
         double median_now = PitchforkMedianValue(now, t_handle, p_handle, t_median, p_median);
         double dist_median = (bid - median_now) / point;
         PrintFormat("  Pitchfork median line at current time: %.5f (distance %.1f pips)", median_now, dist_median);
         if(MathAbs(dist_median) <= 5.0)
            Print("    >>> ALERT: Price within 5 pips of median line");

         int addLevels = ArraySize(objects[i].pitchfork_level_values);
         if(addLevels > 0)
           {
            Print("  Additional pitchfork levels (offset from median):");
            for(int l = 0; l < addLevels; l++)
              {
               double level_price = median_now + objects[i].pitchfork_level_values[l];
               double dist_level = (bid - level_price) / point;
               PrintFormat("    %s : offset %.2f -> line at %.5f (distance %.1f pips)",
                           objects[i].pitchfork_level_texts[l],
                           objects[i].pitchfork_level_values[l],
                           level_price, dist_level);
               if(MathAbs(dist_level) <= 5.0)
                  Print("    >>> ALERT: Price near additional pitchfork level");
              }
           }
        }
     }
  }
Save the file. Compile all files (F7). Attach the EA to a chart with complex objects and observe the Experts tab.
Testing and Validation
Test environment – After compiling, attach the EA to a chart. Draw at least:
- A Fibonacci retracement (right‑click → Fibonacci → Retracement) with default levels.
- An equidistant channel (insert → Channels → Equidistant Channel) with three clicks.
- An Andrews Pitchfork (insert → Andrews Pitchfork) with three clicks. Optionally add extra levels: right‑click the Pitchfork → Properties → Levels → Add → Value = 0.62, Description = “61.8%”.
- A trendline, a rectangle, a horizontal line, and a vertical line to test all object types.
Validating output – The EA will print:
- For horizontal lines: the price level.
- For vertical lines: the time coordinate.
- For rectangles: the two opposite corners and the vertical range in pips.
- For trendlines: the two anchor points and the current line value at the current time, plus distance in pips.
- For Fibonacci: each ratio and the computed price.
- For channels: three anchor points and the current value of the base line.
- For Pitchforks: median line value, additional levels (if any).
Log from a successful run (example on USDJPY, M5 timeframe – on 28 May 2026) shows correct extraction for all object types:
2026.05.28 09:21:16.638  TestComplexObjectsEA (USDJPY,M5)  Object: M5 Trendline 4675 | Type: TREND
2026.05.28 09:21:16.638    Trendline anchor points:
2026.05.28 09:21:16.639      Point 1: 2026.05.29 10:05 @ 159.39158
2026.05.28 09:21:16.639      Point 2: 2026.05.29 13:50 @ 159.19819
2026.05.28 09:21:16.639    Current value: 155.81926 (distance 3594.7 pips)
2026.05.28 09:21:22.305  ------ DETECTED COMPLEX OBJECTS: 3 ------
2026.05.28 09:21:22.305  Object: M5 Andrews Pitchfork 64573 | Type: PITCHFORK
2026.05.28 09:21:22.305    Pitchfork median line at current time: 159.48209 (distance -66.1 pips)
2026.05.28 09:21:22.305    Additional pitchfork levels (offset from median):
2026.05.28 09:21:22.305      61.8 : offset 0.62 -> line at 160.10009 (distance -684.1 pips)
2026.05.28 09:21:22.305      100.0 : offset 1.00 -> line at 160.48209 (distance -1066.1 pips)
2026.05.28 09:21:22.305      161.8 : offset 1.62 -> line at 161.10009 (distance -1684.1 pips)
2026.05.28 09:21:22.305      261.8 : offset 2.62 -> line at 162.10009 (distance -2684.1 pips)
2026.05.28 09:21:22.305  Object: M5 Fibo 54872 | Type: FIBO
2026.05.28 09:21:22.305    Fibonacci levels (ratio -> price):
2026.05.28 09:21:22.305      0.000 -> 159.35200
2026.05.28 09:21:22.305      0.236 -> 159.27780
2026.05.28 09:21:22.305      0.382 -> 159.23190
2026.05.28 09:21:22.305      0.500 -> 159.19480
2026.05.28 09:21:22.305      0.618 -> 159.15770
2026.05.28 09:21:22.305      1.000 -> 159.03761
2026.05.28 09:21:22.305      1.618 -> 158.84331
2026.05.28 09:21:22.305      2.618 -> 158.52892
2026.05.28 09:21:22.305      4.236 -> 158.02023
Attachments and Installation Summary
| File Name | Type | Version | Description |
|---|---|---|---|
| ChartObjectDetector.mqh | Include file | 1.00 | Base detector for chart objects (trendlines, horizontals, rectangles, etc.) |
| ComplexObjectDataCollector.mqh | Include file | 1.00 | Extended detector for Fibonacci levels, channels, and pitchforks |
| TestComplexObjectsEA.mq5 | Expert Advisor | 1.00 | Test EA that logs all detected analytical objects every 5 seconds |
Installation steps:
- Open MetaEditor (F4).
- Create each file by selecting File → New → File (.mqh for includes, .mq5 for EA) and paste the corresponding code exactly as shown.
- Press F7 to compile each file.
- Attach TestComplexObjectsEA to any chart with complex objects.
- Watch the Experts tab (View → Strategy Tester / Experts) for output.
Conclusion
You have extended the Part 1 detector to handle multi‑level Fibonacci objects, channels, and Pitchforks. The extracted data includes ratios, actual price levels, channel anchor points, Pitchfork handle, median point, and additional level offsets. All data is stored in the SComplexObjectInfo structure and is ready for algorithmic trading.
Your EA can now automatically react to Fibonacci retracements (enter at 0.618, target at 1.272), channel breakouts (buy when price closes above upper boundary), and pitchfork median line touches (sell when price touches the median line from above). The test EA provides concrete code for distance calculations and alerts.
In this article, we throttle detection to once every 5 seconds. This keeps the log readable and avoids overloading the UI thread during development. For production systems, you can easily move the detector.Detect() call into OnChartEvent() (responding to CHARTEVENT_OBJECT_DRAG, CHARTEVENT_OBJECT_CREATE) so that structure updates happen only when a user modifies an object, while OnTick() runs on every tick for low‑latency price checks.
The current implementation stores data in an array of structures containing dynamic arrays (fibo_ratios[], pitchfork_level_values[]). For high‑frequency or multi‑chart setups, use a pointer‑based collection. Wrap SComplexObjectInfo in a class derived from CObject and store instances in CArrayObj. This eliminates data copying and improves memory locality. Part 3 of this series will demonstrate this event‑driven, memory‑optimized architecture.
In Part 3 we will replace polling with event‑driven detection using OnChartEvent (object creation, deletion, modification) and will add functions to programmatically create and modify analytical objects – enabling the EA to draw its own trendlines, channels, and Pitchforks based on market conditions.
Warning: All rights to these materials are reserved by MetaQuotes Ltd. Copying or reprinting of these materials in whole or in part is prohibited.
This article was written by a user of the site and reflects their personal views. MetaQuotes Ltd is not responsible for the accuracy of the information presented, nor for any consequences resulting from the use of the solutions, strategies or recommendations described.

- Free trading apps
- Over 8,000 signals for copying
- Economic news for exploring financial markets
You agree to website policy and terms of use