
Interactive Supply and Demand Zone Manager in MQL5 (Part I): From Manual to Automated Lifecycle

The Limitation of Static Objects
A key limitation in MetaTrader 5 is that the native OBJ_RECTANGLE is a "dumb" object. Once a rectangle is placed, it has no inherent awareness of price action. It possesses no internal logic to detect when a candle closes outside its boundaries, how to scale its height when volatility spikes, or how to distinguish between a manual adjustment and an automated update.
Essentially, a standard rectangle has no awareness of:
- Market State: Is price currently above or below the level?
- Breakout Conditions: Has the level been breached by a close or just a wick?
- Mitigation Logic: Has the zone been tested enough to be considered "weak"?
- Structural Aging: Is the zone still relevant in the current context?
This forces the trader into a loop of continuous manual maintenance: extending rectangles into future candles, recoloring tested zones, and removing invalid structures. Over time, chart management itself becomes the problem.
To solve this, we move beyond simple drawings and toward managed entities. By wrapping the rectangle in a custom CZone class, we give each chart shape persistent state and decision logic. This framework allows zones to categorize themselves automatically, detect breakouts, enter "ghost" states, and eventually deactivate without manual intervention.
The framework introduced in this article will allow zones to:
- be categorized automatically with live prices to determine whether they are support or resistance,
- transition between structural states,
- detect breakouts,
- enter ghost states,
- and eventually deactivate themselves without manual intervention.
The system is a coordinated lifecycle pipeline. Each stage handles a specific task: synchronization, detection, validation, rendering, or state management.
Rather than operating as isolated functions, the system is designed as a coordinated lifecycle pipeline where each stage is responsible for a specific task such as synchronization, detection, validation, rendering, and state management.
The following flowchart provides an overview of how manual user interaction and automated market analysis move through the framework to produce fully dynamic, self-managed zones.
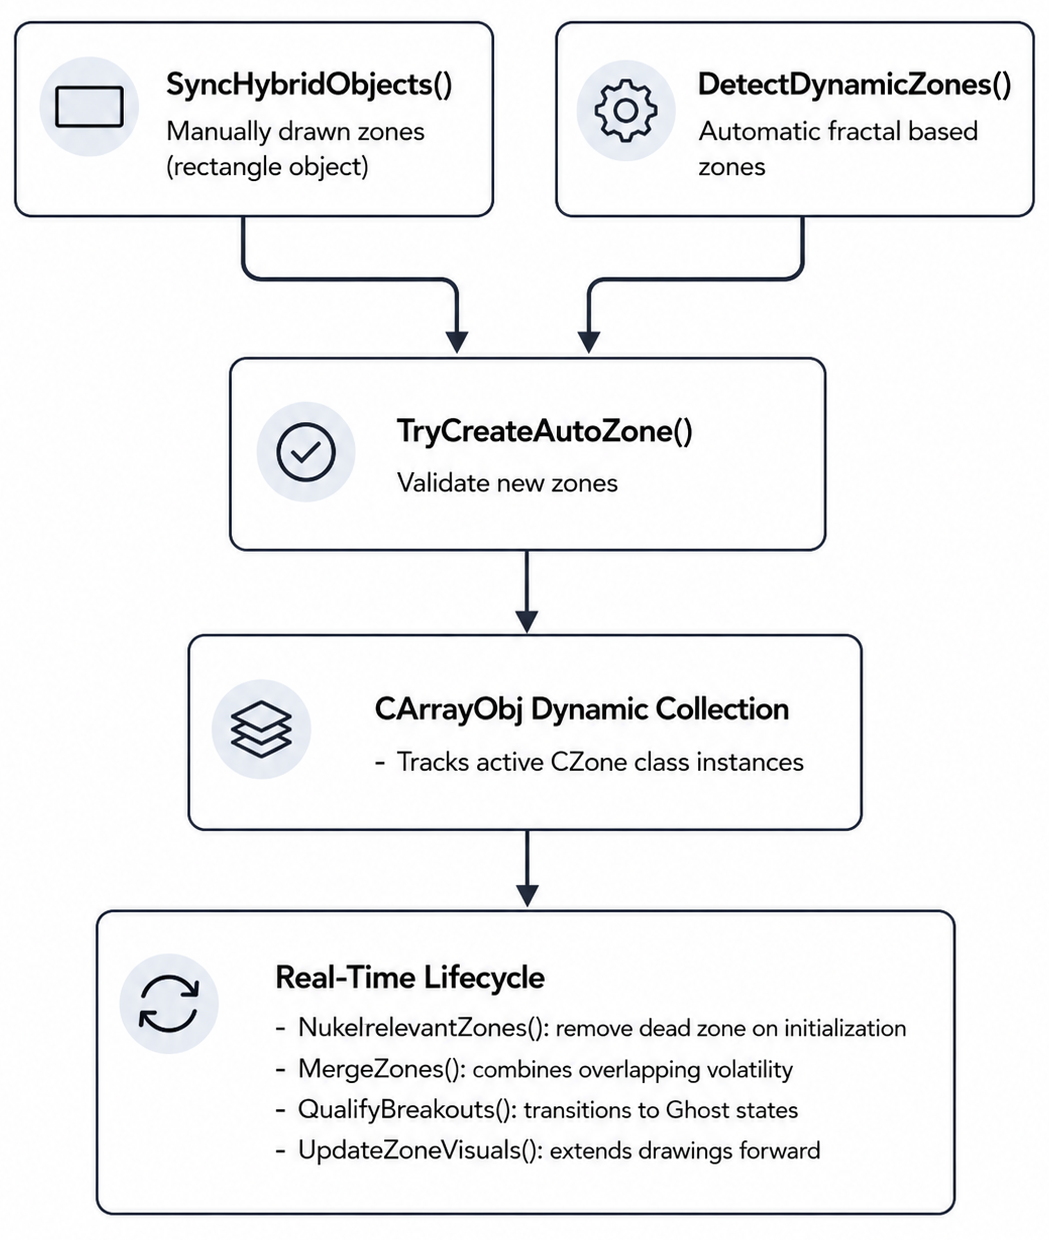
Before building the synchronization logic itself, we first need an architecture capable of storing and managing structural information efficiently during runtime execution.
For this, the system uses the standard MQL5 dynamic object container CArrayObj.
//+------------------------------------------------------------------+
//|                                                   DynamicSR.mq5  |
//|                                  Copyright 2025, MetaQuotes Ltd. |
//|                                             https://www.mql5.com |
//+------------------------------------------------------------------+
#property copyright "Copyright 2025, MetaQuotes Ltd. "
#property link      "https://www.mql5.com"
#property version   "1.00"
#property strict

//--- Include Standard Libraries for Dynamic Tracking
#include <Arrays\ArrayObj.mqh>
#include <Arrays\ArrayString.mqh>
#include <Trade\Trade.mqh>
The reason we use CArrayObj instead of raw structural arrays is because the engine continuously creates, updates, merges, invalidates, and deletes zone objects during live execution. Traditional arrays become inefficient when handling variable-sized object collections that require frequent memory reallocations. CArrayObj solves this by storing class pointers dynamically while handling indexing and cleanup internally. With the memory infrastructure prepared, we can now define the structural state machine responsible for tracking the lifecycle of every zone.
//+------------------------------------------------------------------+
//| System Enumerations                                              |
//+------------------------------------------------------------------+
enum ENUM_ZONE_TYPE
  {
   ZONE_SUPPORT,
   ZONE_RESISTANCE,
   ZONE_NEUTRAL
  };

enum ENUM_ZONE_STATUS
  {
   ZONE_VIRGIN,
   ZONE_BROKEN,
   ZONE_INACTIVE
  };

enum ENUM_ZONE_SOURCE
  {
   ZS_USER,
   ZS_EA
  };
These enumerations act as the behavioral foundation of the entire framework. Instead of treating zones as simple graphical objects, the engine now treats them as entities capable of transitioning between multiple structural states during their lifetime. For example, a newly created untouched zone begins as ZONE_VIRGIN, a structurally violated zone transitions into ZONE_BROKEN, and old irrelevant structures eventually become ZONE_INACTIVE. This state-driven architecture becomes critical later when we begin the automation of:
- recoloring,
- breakout logic,
- ghost-state transitions,
- and cleanup behavior.
With the structural states now defined, the next step is configuring the runtime parameters responsible for controlling how the engine reacts to live market conditions.
//+------------------------------------------------------------------+
//| Input Configuration Parameters                                   |
//+------------------------------------------------------------------+
input group "--- Core Engine Settings ---"
input int      ApproachPips        = 10;       // Proximity alert aura distance in pips
input int      LookbackBars        = 300;      // Historical structural scanning depth
input int      SwingBars           = 5;        // Symmetrical bars required for structural pivot
input double   MergeSensitivity    = 1.5;      // Proximity threshold multiplier for merging zones

input group "--- Breakout & Ghost State Settings ---"
input double   BreakBufferPct      = 0.10;     // Percentage of zone height required for breakout penetration
input int      BreakConfirmCloses  = 2;        // Number of consecutive candle closes required to confirm breakout
input int      GhostBarLimit       = 50;       // Lifetime limit in bars for broken hollow zones
input bool     AllowResurrection   = true;     // Re-activate ghost zones if price closes back inside range
At this stage, the framework begins separating itself from traditional static support and resistance objects. We are no longer only concerned with where a zone exists.
We now begin by defining how zones age, how breakouts are confirmed, how long broken structures remain visible, and whether previously invalidated zones are allowed to reactivate themselves after price re-enters the range.
This introduces the concept of structural lifecycle management.
A zone is no longer permanent. It becomes a living object operating under state-based behavioral rules. To manage these runtime entities globally, we now create the central tracking containers responsible for storing active structural objects during execution.
//+------------------------------------------------------------------+
//| Global Tracking Containers                                       |
//+------------------------------------------------------------------+
CArrayObj      active_zones;                   // Active structural supply and demand tracking arrays
CArrayString   blacklist;                      // Blacklisted names of manually deleted automated zones
datetime       last_bar_time       = 0;        // Track bar time shifts to execute periodic functions
int            atr_handle          = INVALID_HANDLE; // Core handle for structural ATR calculation
The active zones container acts as the engine's structural registry. Every zone detected manually or algorithmically is stored inside this dynamic collection, allowing the framework to:
- iterate through active structures,
- synchronize graphical updates,
- evaluate breakouts,
- merge overlapping zones,
- and safely destroy old objects from memory.
The blacklist container serves a different purpose. If a trader manually deletes an automatically generated zone, the engine stores the object's name inside this blacklist to prevent the system from recreating it repeatedly during future scans.
At this point, the infrastructure responsible for storing structural entities is complete.The next challenge is transforming a native MetaTrader rectangle into an intelligent object capable of carrying its own:
- pricing metrics,
- lifecycle information,
- breakout tracking,
- visual states,
- and behavioral logic.
For this, we introduce the core wrapper architecture of the framework: the CZone class.
The Core Object Wrapper: CZone Class Architecture
To make a native MetaTrader rectangle behave like a stateful object, we wrap it in an object-oriented class. CZone inherits from CObject, so each zone can be stored, indexed, and tracked in the global active_zones container.Instead of unmanaged chart coordinates, the class stores pricing metrics, breakout counters, and visual settings in one entity.
//+------------------------------------------------------------------+
//| Zone Wrapper Class Architecture                                  |
//+------------------------------------------------------------------+
class CZone : public CObject
  {
public:
   string            name;                        // Unique chart object identifier
   double            price_level;                 // Median reference price of the structure
   double            top;                         // Upper boundary ceiling price
   double            bottom;                      // Lower boundary floor price
   double            height;                      // Absolute distance within the zone range

   //--- Ghost Tracking Variables
   bool              is_broken;                  // Flag indicating the zone has been penetrated
   datetime          broken_time;                // Exact timestamp when breakout confirmation occurred
   int               consecutive_closes_outside; // Counter for closing candles beyond boundaries

   ENUM_ZONE_TYPE    type;                       // Structural classification (Support/Resistance)
   ENUM_ZONE_STATUS  status;                     // Operational state tracking (Virgin/Broken/Inactive)
   bool              is_user_zone;               // Identifies if manually drawn or auto-generated
   bool              was_drawn;                  // Confirmed visual presence on active chart
   datetime          created;                    // Original generation timestamp
   datetime          last_touch_time;            // Last recorded price test interaction

   bool              buy_triggered;              // Internal signal flag for support interaction
   bool              sell_triggered;             // Internal signal flag for resistance interaction
   double            strength;                   // Structural weight ranking score

   //--- Default Constructor
                     CZone()
     {
      is_broken = false;
      broken_time = 0;
      consecutive_closes_outside = 0;
      was_drawn = false;
     }

   //--- Primary Algorithmic Constructor (Optimized)
                     CZone(double p, ENUM_ZONE_TYPE t, datetime ct, double current_atr)
     {
      price_level = p;
      type = t;
      status = ZONE_VIRGIN;
      is_user_zone = false;
      was_drawn = false;
      is_broken = false;
      broken_time = 0;

      //--- Dynamic Volatility Sizing via Cached Environment Param
      double zone_height = 0.0;
      if(current_atr > 0.0)
        {
         zone_height = current_atr * 0.5; // Zone size scales directly with volatility
        }
      else
        {
         zone_height = 20.0 * _Point * 10.0; // Fail-safe default size if data is empty
        }

      //--- Geometric Coordinate Calculations
      top = (type == ZONE_RESISTANCE) ? p : p + zone_height;
      bottom = (type == ZONE_RESISTANCE) ? p - zone_height : p;
      height = top - bottom;

      created = ct;
      last_touch_time = ct;
      consecutive_closes_outside = 0;
      buy_triggered = false;
      sell_triggered = false;
      strength = 1.0;

      //--- Unique System Name Generation
      name = (type == ZONE_SUPPORT ? "S_" : "R_") + EnumToString(_Period) + "_" +
             DoubleToString(p, _Digits) + "_" + IntegerToString((long)ct);
     }

   //--- Proximity Border Validation Method
   bool              IsPriceNearZone(double price)
     {
      double pipMultiplier = (_Digits == 3 || _Digits == 5) ? 10.0 : 1.0;
      double proximityBuffer = ApproachPips * _Point * pipMultiplier;

      bool isInside = (price >= (bottom - proximityBuffer) && price <= (top + proximityBuffer));
      return isInside;
     }

   //--- State-Based Color Mapping Method
   color             GetColor(void)
     {
      if(is_broken)
        {
         return clrWhite; // Ghost states render as a hollow white border
        }
      if(status == ZONE_INACTIVE)
        {
         return clrGray;  // Deactivated states render in neutral gray
        }
      if(type == ZONE_SUPPORT)
        {
         return (status == ZONE_VIRGIN ? clrLimeGreen : clrGreen);
        }

      return (status == ZONE_VIRGIN ? clrRed : clrOrangeRed);
     }
  };
Why the CZone Wrapper Matters
1. Properties & Internal State Fields
- Memory-Cached Coordinates: By storing structural boundaries directly in class variables during creation or synchronization, the engine avoids repetitive ObjectGetDouble() requests during tick execution. This establishes the wrapper as the primary runtime reference layer while reducing terminal API overhead during intensive market loops.
- Breakout Tracking "consecutive_closes_outside": This internal counter filters temporary close violations and requires candle closes to be confirmed beyond structural boundaries before triggering a breakout state, helping isolate genuine market continuation from short-term volatility noise.
- Manual Source Tracking "is_user_zone": This flag distinguishes manually drawn trader zones from automatically generated structures, allowing the synchronization layer to prioritize user modifications and prevent unwanted automated regeneration.
2. The Hardened Volatility Constructor
- Decoupled Volatility Sizing via ATR: Rather than relying on fixed pip distances—which become unreliable as market volatility expands or contracts—the constructor scales zone height dynamically using a 0.5 × ATR calculation. To reduce unnecessary indicator overhead, the constructor receives a cached ATR value directly from the environment layer instead of creating temporary indicator handles internally.
- Structured-Unique Object Naming: Using the pattern [Prefix]_[Timeframe]_[Price]_[Timestamp] generates a unique signature for every zone instance. This prevents chart object collisions while simplifying synchronization, memory tracking, and manual deletion handling inside the registry system.
3. Spatial Verification & Utility Routines
- IsPriceNearZone Validation: This function monitors a configurable pip buffer surrounding the zone boundaries, providing an early interaction signal before breakout, rejection, or retest logic is evaluated.
- State-Driven Styling: Instead of embedding large conditional rendering blocks inside the main loop, the CZone instance evaluates its own internal state flags and returns the appropriate visual color dynamically. This keeps color-state rendering behavior localized and easier to maintain throughout the framework.
- Diagnostic Logging: Standard Print() telemetry provides real-time feedback on synchronization events, breakout confirmations, and lifecycle state transitions. This creates a transparent debugging layer for validating that memory structures remain synchronized with chart visualizations during execution.
Production Note: Volatility Caching & Memory Management
While the constructor above utilizes current_atr for dynamic sizing, notice that the ATR value is passed as a parameter rather than calculated via iATR handles inside the class. This prevents the "handle leak" common in novice MQL5 designs, where every new object creates a redundant indicator handle.
Implementation Requirement: To ensure efficient memory cleanup during high-frequency backtesting or rapid zone invalidation, the collection managing these objects must be initialized. This ensures that when a zone is removed from the registry, the underlying CZone instance is immediately destroyed, preventing progressive memory accumulation during long-duration trading sessions.
Real-Time User Interaction & Capture (SyncHybridObjects)
The Objective: Traders frequently modify chart objects manually. SyncHybridObjects() is called on every tick to synchronize these manual actions with the framework’s internal memory structures.
The Workflow: Instead of requiring manual menus, this method continuously scans native rectangles on the chart. If it detects a new user-drawn rectangle, it converts it into a CZone instance, tags it as "USER," categorizes it as support or resistance relative to the current live price, and registers it in the active memory array.
If the user resizes an automated zone, the function captures the new coordinates and upgrades the zone from AUTO to a USER-managed state. It also performs a cleanup pass: if an object is deleted, the loop detects the absence, updates the memory arrays, and adds the identifier to an internal blacklist to prevent the system from immediately regenerating it.
//+------------------------------------------------------------------+
//| Intercepts and Synchronizes Manual and Automated Chart Shapes    |
//+------------------------------------------------------------------+
void SyncHybridObjects(void)
  {
   double bid = SymbolInfoDouble(_Symbol, SYMBOL_BID);
   int total_objects = ObjectsTotal(0, 0, OBJ_RECTANGLE);

   double atr_val[];
   ArraySetAsSeries(atr_val, true);

   double passed_atr = 0.0;

   if(atr_handle != INVALID_HANDLE)
     {
      int copied = CopyBuffer(atr_handle, 0, 0, 1, atr_val);

      if(copied > 0)
        {
         passed_atr = atr_val[0];
        }
     }

   for(int i = 0; i < total_objects; i++)
     {
      string obj_name = ObjectName(0, i, 0, OBJ_RECTANGLE);
      string object_description = ObjectGetString(0, obj_name, OBJPROP_TEXT);

      bool is_already_tagged = (object_description == "AUTO" || object_description == "USER");

      double boundary_p1 = ObjectGetDouble(0, obj_name, OBJPROP_PRICE, 0);
      double boundary_p2 = ObjectGetDouble(0, obj_name, OBJPROP_PRICE, 1);

      CZone* existing_zone = NULL;

      for(int z = 0; z < active_zones.Total(); z++)
        {
         CZone* zone_ptr = (CZone*)active_zones.At(z);

         if(zone_ptr != NULL && zone_ptr.name == obj_name)
           {
            existing_zone = zone_ptr;
            break;
           }
        }

      if(existing_zone == NULL)
        {
         if(is_already_tagged)
            continue;

         ENUM_ZONE_TYPE derived_type = ((boundary_p1 + boundary_p2) / 2.0 > bid) ? ZONE_RESISTANCE : ZONE_SUPPORT;

         //--- Safe initialization passing global cached context value
         CZone* new_zone = new CZone((boundary_p1 + boundary_p2) / 2.0, derived_type, TimeCurrent(), passed_atr);

         new_zone.name = obj_name;
         new_zone.is_user_zone = true;
         new_zone.top = MathMax(boundary_p1, boundary_p2);
         new_zone.bottom = MathMin(boundary_p1, boundary_p2);

         //--- Recalculate structural internals after manual resize injection
         new_zone.height = new_zone.top - new_zone.bottom;
         new_zone.price_level = (new_zone.top + new_zone.bottom) / 2.0;

         new_zone.was_drawn = true;

         ObjectSetString(0, obj_name, OBJPROP_TEXT, "USER");
         active_zones.Add(new_zone);

         PrintFormat(">>>  Registered user zone: %s | Bounds: %.5f - %.5f",
                     new_zone.name, new_zone.bottom, new_zone.top);
        }
      else
        {
         existing_zone.was_drawn = true;

         double previous_top    = existing_zone.top;
         double previous_bottom = existing_zone.bottom;

         existing_zone.top    = MathMax(boundary_p1, boundary_p2);
         existing_zone.bottom = MathMin(boundary_p1, boundary_p2);

         //--- Maintain synchronized internal geometry after manual manipulation
         existing_zone.height = existing_zone.top - existing_zone.bottom;
         existing_zone.price_level = (existing_zone.top + existing_zone.bottom) / 2.0;

         if(MathAbs(previous_top - existing_zone.top) > _Point || MathAbs(previous_bottom - existing_zone.bottom) > _Point)
           {
            if(!existing_zone.is_user_zone)
              {
               existing_zone.is_user_zone = true;
               ObjectSetString(0, existing_zone.name, OBJPROP_TEXT, "USER");
              }

            PrintFormat(">>> ZONE MANIPULATION Resized object: %s | New Bounds: %.5f - %.5f",
                        existing_zone.name, existing_zone.bottom, existing_zone.top);
           }
        }
     }

   for(int i = active_zones.Total() - 1; i >= 0; i--)
     {
      CZone* z = (CZone*)active_zones.At(i);
      if(z == NULL)
         continue;

      if(ObjectFind(0, z.name) < 0 && z.was_drawn)
        {
         PrintFormat(">>>  Deletion Detected user extraction of: %s", z.name);

         if(!z.is_user_zone)
           {
            blacklist.Add(z.name);
           }

         active_zones.Delete(i);
        }
     }
  }
Architectural Performance Considerations: GUI Synchronization & Tick Processing
The SyncHybridObjects() routine intentionally prioritizes transparency and lifecycle visibility over maximum execution efficiency. Because the synchronization layer relies on native MetaTrader graphical API calls such as ObjectName(), ObjectGetString(), and ObjectGetDouble(), the terminal must repeatedly communicate with the chart object subsystem during every synchronization pass.
Under normal execution conditions, this overhead remains negligible. However, on highly volatile instruments—particularly during high-frequency tick bursts on symbols such as gold or US30—the cost of continuously scanning and synchronizing graphical objects inside OnTick() becomes more noticeable. The main cost is repeated interaction between the market-data stream and the chart-rendering subsystem, especially while objects are updated, resized, or queried.
Within this educational prototype, the synchronization routine remains inside OnTick() intentionally. This design keeps the rectangle adoption lifecycle, manual manipulation detection, and wrapper synchronization flow easy to observe, debug, and study in real time.
In production systems, synchronization is usually decoupled from the tick-processing pipeline. A more scalable approach involves migrating user interaction handling toward OnChartEvent() and responding specifically to events such as CHARTEVENT_OBJECT_CREATE, CHARTEVENT_OBJECT_DRAG and CHARTEVENT_OBJECT_DELETE. This event-driven structure minimizes unnecessary graphical polling while keeping the primary tick-processing pipeline lightweight, responsive, and easier to scale under heavy market activity.
Proximity Clustering and Consolidation "MergeZones"
The Objective: Individually detected pivots can often lead to a cluttered chart, where multiple overlapping zones overwhelm the trader and degrade terminal performance. MergeZones() prevents this by using iterative proximity merging to consolidate redundant price levels into a single, unified structure.
The Workflow: The function runs on the opening of each new bar and evaluates the proximity of zones within the same category (e.g., Support vs. Support).
-
Volatility-Scaled Comparison: We measure the center-line distance between neighboring zones. If their center-line distance falls within a user-defined threshold—typically scaled by 1.5 ATR—they are flagged for consolidation.
-
Coordinate Expansion: The surviving zone automatically expands its upper and lower boundaries to encompass the full price range of both original structures.
-
Identity Preservation: To ensure manual work is never lost, the inheritance logic checks the source of the zones. If either of the original areas was marked as a "USER" zone, the surviving zone inherits the protected "USER" status, preserving the zone's user-managed status during future synchronization passes.
//+------------------------------------------------------------------+
//| Collapses Adjacent Overlapping Ranges Using Volatility Buffers   |
//+------------------------------------------------------------------+
void MergeZones(void)
  {
   double atr_val[];
   ArraySetAsSeries(atr_val, true);

   if(CopyBuffer(atr_handle, 0, 0, 1, atr_val) < 1)
      return;

   double merge_threshold = atr_val[0] * MergeSensitivity;

   for(int i = active_zones.Total() - 1; i >= 1; i--)
     {
      CZone* z1 = (CZone*)active_zones.At(i);
      if(z1 == NULL)
         continue;

      for(int j = i - 1; j >= 0; j--)
        {
         CZone* z2 = (CZone*)active_zones.At(j);
         if(z2 == NULL)
            continue;

         if(z1.type != z2.type)
            continue;

         double space_distance = MathAbs(z1.price_level - z2.price_level);
         if(space_distance > merge_threshold)
            continue;

         z1.top         = MathMax(z1.top,    z2.top);
         z1.bottom      = MathMin(z1.bottom, z2.bottom);
         z1.height      = z1.top - z1.bottom;
         z1.price_level = (z1.top + z1.bottom) / 2.0;

         if(z2.is_user_zone)
            z1.is_user_zone = true;

         PrintFormat(">>> Combined overlapping structures into: %s", z1.name);

         ObjectDelete(0, z2.name);
         active_zones.Delete(j);
         break;
        }
     }
  }
Dynamic Zone Projection (UpdateZoneVisual)
The objective:Standard chart objects are statically tied to the bars where they were originally drawn. As new data arrives, these objects eventually move off-screen. UpdateZoneVisual ensures that key levels remain relevant by projecting them into the "future" chart space.
The Workflow: Instead of leaving the right edge of a rectangle fixed to a historical bar, this function updates the time coordinate (OBJPROP_TIME, index 1) during every tick.
By calculating the projection as (TimeCurrent() + PeriodSeconds(_Period) * 20), the right boundary of the zone is projected forward. This ensures that support and resistance levels are always visible in the "Chart Shift" gap, providing immediate context alongside live price action.
Quick Note on Object Interaction: To ensure these projected zones remain fully interactive, we will explicitly enable OBJPROP_SELECTABLE. This allows the SyncHybridObjects loop to "capture" manual user adjustments during subsequent synchronization passes, even while the zone is set to the background (OBJPROP_BACK) to avoid obstructing price action.
//+------------------------------------------------------------------+
//| Generates Graphic Objects and Projects Visual Boundaries Forward |
//+------------------------------------------------------------------+
void UpdateZoneVisuals(void)
  {
   for(int i = 0; i < active_zones.Total(); i++)
     {
      CZone *z = (CZone*)active_zones.At(i);

      if(z == NULL)
         continue;

      if(ObjectFind(0, z.name) < 0)
        {
         if(!ObjectCreate(0, z.name, OBJ_RECTANGLE, 0, z.created, z.top, TimeCurrent(), z.bottom))
            continue;

         ObjectSetInteger(0, z.name, OBJPROP_BACK, true);
         ObjectSetInteger(0, z.name, OBJPROP_FILL, true);
         ObjectSetInteger(0, z.name, OBJPROP_SELECTABLE, true);

         ObjectSetString(0, z.name, OBJPROP_TEXT, z.is_user_zone ? "USER" : "AUTO");
        }

      datetime right_edge_projection = TimeCurrent() + PeriodSeconds(_Period) * 20;

      ObjectSetInteger(0, z.name, OBJPROP_TIME, 1, right_edge_projection);
      ObjectSetDouble(0, z.name, OBJPROP_PRICE, 0, z.top);
      ObjectSetDouble(0, z.name, OBJPROP_PRICE, 1, z.bottom);
      ObjectSetInteger(0, z.name, OBJPROP_COLOR, z.GetColor());
     }

   ChartRedraw();
  }
Volatility-Scaled Structural Pivot Logic (DetectDynamicZones)
The Objective: Automated generation can lead to chart clutter if every minor price fluctuation is marked. DetectDynamicZones filters this noise using a structural pivot filter to identify structurally valid reversal areas.
The Workflow: The function scans historical data to verify that a high or low is validated as a structural pivot. For example, a valid resistance peak must be confirmed by surrounding candles for a specific number of bars (SwingBars) on both sides. To maintain a clean layout, the system calculates a dynamic merge threshold:
Merge Threshold = iATR-based volatility * MergeSensitivity
If a new pivot is detected but its price falls within this threshold of an existing zone, zone creation is skipped for that pivot. This combines the trader’s sensitivity preference with current market volatility to ensure only structurally distinct levels are rendered.
//+------------------------------------------------------------------+
//| Scans Historical Market Data to Identify Valid Symmetrical Pivots|
//+------------------------------------------------------------------+
void DetectDynamicZones(void)
  {
   MqlRates rates[];
   ArraySetAsSeries(rates, true);

   int bars_to_copy = LookbackBars + (SwingBars * 2);

   if(CopyRates(_Symbol, _Period, 0, bars_to_copy, rates) < bars_to_copy)
      return;

   double atr_val[];
   ArraySetAsSeries(atr_val, true);

   if(CopyBuffer(atr_handle, 0, 0, 1, atr_val) < 1)
      return;

   for(int i = SwingBars; i < LookbackBars; i++)
     {
      bool is_high_confirmed = true;
      bool is_low_confirmed  = true;

      for(int j = 1; j <= SwingBars; j++)
        {
         if(rates[i].high <= rates[i-j].high || rates[i].high <= rates[i+j].high)
           {
            is_high_confirmed = false;
           }

         if(rates[i].low >= rates[i-j].low || rates[i].low >= rates[i+j].low)
           {
            is_low_confirmed = false;
           }

         if(!is_high_confirmed && !is_low_confirmed)
            break;
        }

      if(is_high_confirmed)
         TryCreateAutoZone(rates[i].high, ZONE_RESISTANCE, rates[i].time, atr_val[0]);

      if(is_low_confirmed)
         TryCreateAutoZone(rates[i].low, ZONE_SUPPORT, rates[i].time, atr_val[0]);
     }
  }

//+------------------------------------------------------------------+
//| Filters Structural Creation via Blacklists and Proximity Checks  |
//+------------------------------------------------------------------+
void TryCreateAutoZone(double p, ENUM_ZONE_TYPE t, datetime dt, double atr)
  {
   double bid = SymbolInfoDouble(_Symbol, SYMBOL_BID);
   double ask = SymbolInfoDouble(_Symbol, SYMBOL_ASK);

//--- Layer 1: Market Position Filter
//--- Prevents "laddering" by ignoring overhead support or underlying resistance
   if(t == ZONE_SUPPORT && p > bid)
      return;

   if(t == ZONE_RESISTANCE && p < ask)
      return;

//--- Layer 2: Duplicate Check
   for(int i = 0; i < active_zones.Total(); i++)
     {
      CZone *z = (CZone*)active_zones.At(i);
      if(z == NULL)
         continue;

      if(z.created == dt && z.type == t)
         return;
     }

//--- Maintain identical naming convention with constructor-generated identifiers
   string id = (t == ZONE_SUPPORT ? "S_" : "R_") + EnumToString(_Period) + "_" +
               DoubleToString(p, _Digits) + "_" + IntegerToString((long)dt);

//--- Layer 3: User Blacklist Filter
   for(int i = 0; i < blacklist.Total(); i++)
     {
      if(blacklist.At(i) == id)
         return;
     }

//--- Layer 4: Proximity/Merge Sensitivity Filter
   double merge_threshold = atr * MergeSensitivity;

   for(int i = 0; i < active_zones.Total(); i++)
     {
      CZone *z = (CZone*)active_zones.At(i);
      if(z == NULL)
         continue;

      if(MathAbs(z.price_level - p) < merge_threshold)
         return;
     }

//--- Create the new zone instance and pass the contextual ATR parameter
   CZone *nz = new CZone(p, t, dt, atr);

   nz.name = id;
   nz.is_user_zone = false;

   active_zones.Add(nz);

   PrintFormat(">>> Auto-generated zone registered: %s", nz.name);
  }
The Startup Purge Engine: Core Functionality
NukeIrrelevantZones() runs as a cleanup routine during initialization. Its sole purpose is to sweep the chart and clear out zones that have been invalidated by the current price position. This ensures you start with a clean, uncluttered workspace.
The routine evaluates every active zone against current market prices using simple price-based filtering rules:
- Invalidated Support: If the current market bid price breaches the support zone boundary, that level has been broken and is flagged as dead.
- Invalidated Resistance: If the current market ask price breaches the resistance zone boundary, that level has been breached and is flagged as dead.
Why This Routine Matters:
- Instant Workspace Cleanup: It automatically calls ObjectDelete() to wipe the dead shapes off your screen and removes them from the internal tracking list, saving you from having to manually find and delete old rectangles.
- Safe Array Processing:The loop processes the list backward. This is the standard way to safely remove items from a list without skipping elements or disrupting the counting order as items disappear.
- Optimized Visual Refresh: Instead of triggering repeated redraw updates during deletion operations, it performs all the deletions first and then triggers a single ChartRedraw() at the very end, reducing unnecessary intermediate redraws during cleanup.
//+------------------------------------------------------------------+
//| Clears Irrelevant Untradeable Structural Layers on Startup       |
//+------------------------------------------------------------------+
void NukeIrrelevantZones(void)
  {
   double bid = SymbolInfoDouble(_Symbol, SYMBOL_BID);
   double ask = SymbolInfoDouble(_Symbol, SYMBOL_ASK);
   int purged = 0;

//--- Loop through the memory list backwards to safely delete
   for(int i = active_zones.Total() - 1; i >= 0; i--)
     {
      CZone *z = (CZone*)active_zones.At(i);
      if(z == NULL)
         continue;

      bool is_dead = false;

      //--- Remove only zones that are completely invalidated
      //--- relative to the current market position.

      // Support becomes irrelevant only if price is fully below the zone
      if(z.type == ZONE_SUPPORT && bid < z.bottom)
         is_dead = true;

      // Resistance becomes irrelevant only if price is fully above the zone
      if(z.type == ZONE_RESISTANCE && ask > z.top)
         is_dead = true;

      if(is_dead)
        {
         ObjectDelete(0, z.name);  // Remove visual rectangle from chart
         active_zones.Delete(i);   // Remove from memory array ownership
         purged++;
        }
     }

   if(purged > 0)
      PrintFormat(">>> [INITIAL PURGE] DELETED %d irrelevant zones from memory and chart.", purged);

   ChartRedraw();
  }
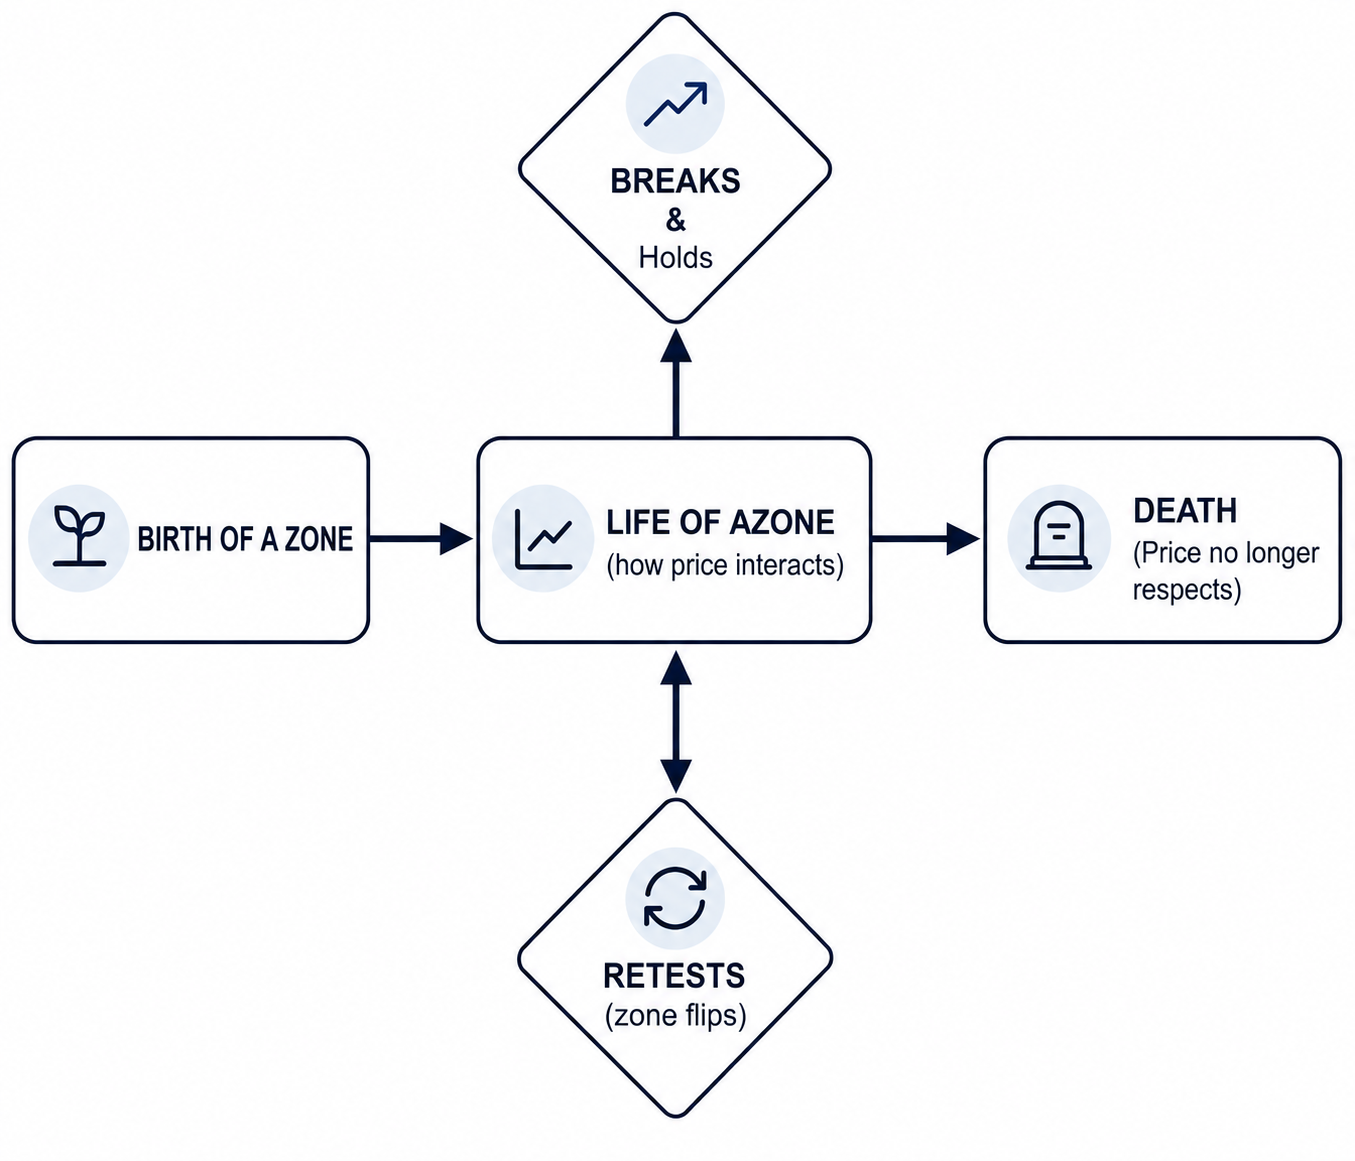
Zone State Management & Breakout Logic (QualifyBreakouts)
The Objective: Static zones often require manual deletion once breached, which ignores the concept of "market memory." QualifyBreakouts implements a flag-based lifecycle system that automates the zone lifecycle—allowing levels to transition from active barriers to "ghost" levels and, eventually, to extinction or resurrection.
The Workflow: Instead of relying on static zone states, the logic calculates a dynamic breakout buffer to account for market noise and volatility:
Buffer Level = MathMax(Zone Height * BreakBufferPct, ATR value)
We then manage the lifecycle through these three distinct layers.
1. Breakout Confirmation
When a candle close moves beyond the buffered zone boundary, a consecutive close counter increments. If the price remains outside for a specific number of consecutive closes (BreakConfirmCloses), the zone is marked as broken. This prevents premature state changes during minor spikes.
2. The Ghost State
Once a breakout is confirmed, the zone is not deleted. Instead, it converts into a "ghost" state—the fill is disabled, and the border changes to a neutral color (e.g., clrWhite). This visual shift keeps the footprint of the level on the chart, allowing the trader to monitor it for future retests or S/R flips.
3. Resurrection vs. Extinction
The framework tracks the age of these ghost zones in bars.
- Resurrection: If the price returns and closes back within the original boundaries before the GhostBarLimit is reached, the zone restores its full-fill state and resets breakout tracking counters flag.
- Extinction: If the zone remains untouched beyond the bar limit, the engine removes the object from the chart and deletes it from the active zone list.
Production Note: This implementation prioritizes simplicity and deterministic behavior over advanced state modeling techniques. More sophisticated breakout systems may use multi-timeframe confirmation, order-flow validation, or probabilistic state transitions. However, this design intentionally keeps the logic lightweight and rule-based to ensure stability, transparency, and predictable execution.
//+------------------------------------------------------------------+
//| Evaluates Penetration Bounds, Handles Ghosts, and Resurrections  |
//+------------------------------------------------------------------+
void QualifyBreakouts(void)
  {
   double last_close = iClose(_Symbol, _Period, 1);

   double atr_val[];
   ArraySetAsSeries(atr_val, true);

   int copied = CopyBuffer(atr_handle, 0, 0, 1, atr_val);

   if(copied < 1)
     {
      Print(">>> [BREAKOUT ENGINE ERROR] ATR buffer copy failed.");
      return;
     }

   double atr = atr_val[0];

   for(int i = active_zones.Total() - 1; i >= 0; i--)
     {
      CZone *z = (CZone*)active_zones.At(i);

      if(z == NULL || z.type == ZONE_NEUTRAL)
         continue;

      // --- LAYER 1: GHOST LIFECYCLE MANAGEMENT
      if(z.is_broken)
        {
         int bars_since_break = iBarShift(_Symbol, _Period, z.broken_time);

         if(bars_since_break > GhostBarLimit)
           {
            PrintFormat(">>> [ZONE EXTINCTION] Aged ghost zone removed from memory: %s", z.name);

            ObjectDelete(0, z.name);
            active_zones.Delete(i);

            continue;
           }

         if(AllowResurrection && last_close > z.bottom && last_close < z.top)
           {
            z.is_broken = false;
            z.status = ZONE_VIRGIN;
            z.consecutive_closes_outside = 0;
            z.buy_triggered = false;
            z.sell_triggered = false;

            ObjectSetInteger(0, z.name, OBJPROP_COLOR, z.GetColor());
            ObjectSetInteger(0, z.name, OBJPROP_FILL, true);

            PrintFormat(">>> [ZONE RESURRECTION] Price reclaimed level. Restored: %s at Bar: %d",
                        z.name,
                        bars_since_break);
           }

         continue;
        }

      // --- LAYER 2: FRESH BREAKOUT QUALIFICATION
      double buffer = MathMax(z.height * BreakBufferPct, atr);

      bool is_clear_breakout =
         (z.type == ZONE_SUPPORT && last_close < (z.bottom - buffer)) ||
         (z.type == ZONE_RESISTANCE && last_close > (z.top + buffer));

      if(is_clear_breakout)
        {
         z.consecutive_closes_outside++;

         if(z.consecutive_closes_outside >= BreakConfirmCloses)
           {
            z.is_broken = true;
            z.status = ZONE_BROKEN;
            z.broken_time = TimeCurrent();

            ObjectSetInteger(0, z.name, OBJPROP_COLOR, clrWhite);
            ObjectSetInteger(0, z.name, OBJPROP_FILL, false);

            PrintFormat(">>> [ZONE GHOSTED] Level breached. Ghost mode activated for: %s", z.name);
           }
        }
      else
        {
         z.consecutive_closes_outside = 0;
        }
     }
  }
Boot Calibration (OnInit()): When the framework is loaded onto a chart and during lifecycle reinitializations such as time frame changes, pre-existing visual elements can lead to duplicates in tracking structures or visual overlap. The OnInit() function acts as a clean state reset. It clears the rectangle-based zone objects from the chart, clears the active zone and blacklist containers, and hooks into the market volatility data stream by instantiating our central ATR tracking handle.
//+------------------------------------------------------------------+
//| Expert Initialization Function                                   |
//+------------------------------------------------------------------+
int OnInit(void)
  {
//--- Step 1: Purge visual space to prevent coordinate overlays
   ObjectsDeleteAll(0, -1, OBJ_RECTANGLE);

//--- Secure container pointer ownership rules to prevent leaks
   active_zones.FreeMode(true);
   active_zones.Clear();

//--- Ensure automatic cleanup ownership for blacklist storage
   blacklist.Clear();

//--- Step 2: Establish volatility handle for dynamic auto-sizing
   atr_handle = iATR(_Symbol, _Period, 14);
   if(atr_handle == INVALID_HANDLE)
     {
      Print("[BOOT ERROR] Failed to instantiate core ATR indicator handle.");
      return(INIT_FAILED);
     }

//--- Step 3: Initial background data scan
   DetectDynamicZones();
   NukeIrrelevantZones();

   Print(">>> successfully initialized.");
   return(INIT_SUCCEEDED);
  }
System deinitialization (OnDeinit): Proper memory allocation management requires an application to clean up after itself when it is detached from the terminal chart window. If a program fails to clean up, it can leave behind orphan objects that persist on the chart and clutter the workspace. For this we need to properly dispose of every object and any handles held in memory. OnDeinit() ensures that when our script is closed, all rectangle-based zone objects are removed from the chart and indicator handles are properly released back to the terminal.
//+------------------------------------------------------------------+
//| Expert Deinitialization Function                                 |
//+------------------------------------------------------------------+
void OnDeinit(const int reason)
  {
   ObjectsDeleteAll(0, -1, OBJ_RECTANGLE);

   active_zones.Clear();
   blacklist.Clear();

   if(atr_handle != INVALID_HANDLE)
     {
      IndicatorRelease(atr_handle);
      atr_handle = INVALID_HANDLE;
     }

   PrintFormat(">>> Deinitialization Engine detached smoothly. Reason Code: %d", reason);
   ChartRedraw();
  }
Central Processing Router (OnTick): The OnTick() block serves as the core engine of our framework, acting as the primary traffic controller that handles the transition between real-time data and historical chart bars. To maintain peak performance, the router divides operations into two distinct frequencies. High-frequency tasks, such as tracking manually drawn or modified shapes via SyncHybridObjects(), run on every incoming price change to ensure immediate UI responsiveness. Meanwhile, resource-heavy operations like breakout validation, dynamic zone calculation, or merging overlapping ranges are deferred to execute only at the opening of a new bar.
//+------------------------------------------------------------------+
//| Core Tick Processing & Routing Engine                            |
//+------------------------------------------------------------------+
void OnTick(void)
  {
   SyncHybridObjects();

   double bid = SymbolInfoDouble(_Symbol, SYMBOL_BID);
   double ask = SymbolInfoDouble(_Symbol, SYMBOL_ASK);
   double current_price = (bid + ask) / 2.0;

   datetime current_candle_time = iTime(_Symbol, _Period, 0);

   if(current_candle_time != last_bar_time)
     {
      last_bar_time = current_candle_time;

      QualifyBreakouts();
      DetectDynamicZones();
      MergeZones();

      PrintFormat(">>> New Candle Opened: %s | Managing Lifecycles.", TimeToString(current_candle_time));
     }

   UpdateZoneVisuals();
  }
Operational Walkthrough
During initialization, the EA scans historical bars, detects structural pivots, and automatically renders support and resistance zones on the chart. Select the native MetaTrader 5 Rectangle shape and draw it anywhere on the chart (top or bottom of the current price). On the next market tick, the synchronization layer intercepts the object and automatically registers it into the framework. Click and drag the edge of an existing zone to expand or contract it manually.
The synchronization routines immediately detect the boundary modification and update the internal zone data accordingly. Right-click a rectangle and select Delete, or select the object and press the Delete key. The framework detects the removal and clears the associated internal references automatically. Remove the Expert Advisor from the chart to trigger the deinitialization routines, which release all tracked objects and allocated resources cleanly.

Fig. 1. Renderd zone on chart

Fig. 2. inserting rectangles manually

Fig. 3. detailed action message
Future Scope & Production Scaling
This article presents a reusable scaffold that makes native MetaTrader 5 rectangles stateful via automated lifecycle management. However, moving this structural layout from an educational prototype into a production-grade trading system reveals a vast landscape for optimization.
In future parts of this series, we will explore more advanced architectural extensions, including the following:
-
Event-Driven UI processing: moving entirely away from procedural tick-polling and utilizing native chart events (CHARTEVENT_OBJECT_CREATE, CHARTEVENT_OBJECT_DRAG, and CHARTEVENT_OBJECT_DELETE) for instantaneous, lag-free visual adjustments. Handling user interactions inside OnTick() serves as an excellent educational tracking model, but it is architecturally non-standard; it binds visual responsiveness directly to incoming tick frequency and server ping. Shifting to an event-driven paradigm ensures the UI reacts instantly, even during low-liquidity periods or fast market spikes.
-
Theoretical Trading Frameworks (The "S/R Flip"): Exploring purely conceptual trading models that leverage the wrapper's lifecycle transitions. We will examine how zones transitioning from ZONE_VIRGIN into retained ghost states can theoretically support breakout-retest structures, dynamic stop placement logic, and adaptive take-profit projection without overcomplicating the foundational synchronization engine.
-
Memory Layer Sovereignty: Further evolving the architecture so the internal CArrayObj registry operates as the primary runtime state layer, while graphical chart objects function strictly as passive visualization components. This separation improves structural consistency and allows the framework to recover gracefully from accidental user modifications or graphical deletions.
-
Semantic Metadata Aggregation: Evolving our visual geometric compression into a mathematical matrix that preserves and compounds historical zone attributes when two structures overlap. Instead of basic midpoint classification and string-based blacklisting, a hardened production model will utilize multivariable structural fingerprints—incorporating historical touch frequencies, volume accumulation weights, and rejection scoring formulas into a persistent data key.
-
Multi-Timeframe Confluence Filters: Extending the spatial discovery engine to scan higher-level timeframes (H1 through D1) and dynamically project those structural zones onto lower execution charts, allowing local setups to inherit broader market context and confluence alignment.
Conclusion & Reusable Scaffold
The Czone Architecture integrates three layers of protection against synchronization lag and visual decay. The class-based registry prevents the framework from making redundant terminal calls during high-frequency volatility. The SyncHybridObjects layer bridges manual trader intuition with automated execution, while the volatility-scaled constructor ensures structural zones remain proportional regardless of the asset being traded.Key Takeaways:
-
Zone Projections are Dynamic, not Static: By calculating the right-hand time coordinate as TimeCurrent() + (PeriodSeconds() * 20), the framework converts a historical rectangle into a forward-looking ray cast. This moves the support/resistance context into the "Chart Shift" gap where live trading decisions occur.
-
The 1.5 ATR Rule Regularizes Merging: To prevent chart clutter, zones of the same type are consolidated based on a volatility-scaled proximity check. This transforms a collection of individual fractal pivots into a single, high-probability structural area.
-
"Ghost" States Preserve Market Memory: Deletion is a last resort. When a breakout is confirmed via consecutive closes, the zone transitions to an unfilled "ghost" state. This allows the system to monitor for S/R flips or "resurrection" within the GhostBarLimit before the object is cleared from memory.
-
User priority is enforced programmatically: trader interaction is treated as a high-priority interrupt. Any adjustment to an automated zone converts its status to USER, shielding it from being recalculated or moved by the internal math loops.
-
Diagnostic printing is for validation, not logic: the terminal Print() outputs are a transparency layer. If a zone fails to transition to a Ghost state upon a clear breakout, the logs provide the immediate diagnostic path to verify the BreakConfirmCloses counter logic.
Extending the Framework
This architecture is designed to be a "plug-and-play" foundation. Because every zone is a managed object with a unique state, you can easily extend the engine by:
- Automated Notifications: Adding a SendNotification() call inside the IsPriceNearZone logic for mobile alerts.
- EA Integration: Passing the active_zones array to an OnTick() entry function to act as a dynamic filter for trade execution.
- Signal Mapping: Connecting the is_user_zone flag to a Telegram bot to share manual setups alongside automated technical levels.
This system is built in MQL5 to be consumed by high-performance trading tools. It moves the burden of chart maintenance from the trader to the environment, allowing for a more focused and professional approach to live market execution.
Warning: All rights to these materials are reserved by MetaQuotes Ltd. Copying or reprinting of these materials in whole or in part is prohibited.
This article was written by a user of the site and reflects their personal views. MetaQuotes Ltd is not responsible for the accuracy of the information presented, nor for any consequences resulting from the use of the solutions, strategies or recommendations described.

- Free trading apps
- Over 8,000 signals for copying
- Economic news for exploring financial markets
You agree to website policy and terms of use
Thx for sharing and effort, and app. working without {#include <Trade\Trade.mqh>} i wonder why it is included ?