
Price Action Analysis Toolkit Development (Part 64): Synchronizing Manually Drawn Trendlines with Automated Monitoring

Contents
Introduction
You already draw trendlines manually and trust your visual judgment more than fully automated detection. The practical problem is different: as you place more lines across one or several charts, you physically cannot watch every level all the time. Key moments—price approaching, touching, breaking, or rejecting a manually drawn trendline—often occur while you switch timeframes, step away from the terminal, or manage other positions. The article addresses this precise deficit: how to keep manual charting as your analytical input while automating the repetitive task of monitoring those lines.
Technically, the missing piece is the ability to “attach” a hand-drawn OBJ_TREND to the Expert Advisor's logic and lifecycle (creation, modification, deletion), compute its instantaneous price as time advances, and raise reliable notifications when predefined interaction conditions occur. The solution presented preserves discretionary drawing: you select and sync the lines you care about, and MetaTrader 5 (via an EA) continuously evaluates those synchronized lines and alerts you to meaningful events so you no longer need to stare at every chart.
The following sections explain the concept behind synchronizing manually drawn trendlines with automated monitoring, describe how the system is implemented in MQL5, and present the testing process used to verify its behavior in a live chart environment.
Understanding the Concept
In earlier work within the Price Action Analysis Toolkit Development series, the automation of drawing and monitoring trendlines in MQL5 was introduced. In that approach, the program identifies potential pivot points and automatically constructs trendlines based on predefined rules. While this automation is useful for systematic analysis, many traders still prefer to draw trendlines manually.
Manual drawing allows the trader to apply discretion when selecting pivot points. Instead of relying solely on algorithmic detection, traders can visually interpret the chart and determine which swing highs and lows best represent the underlying market structure. This human judgment is particularly valuable when analyzing complex price formations where rigid rules may fail to capture subtle structural details.
Several advantages arise from manually drawing trendlines during price action analysis. Some of the most important benefits are summarized in the table below.
| Advantage | Description |
|---|---|
| Structural Interpretation | Traders can interpret the market structure and select pivot points that best represent the trend rather than relying solely on mechanical detection. |
| Flexibility | Manual drawing allows quick adjustments to adapt to changing market conditions or newly formed price swings. |
| Context Awareness | Traders can consider additional chart elements such as support, resistance, or consolidation zones when positioning the line. |
| Strategy Alignment | The trader can align trendlines with the specific logic of their trading strategy rather than following a universal rule set. |
| Visual Clarity | Manually placed lines often reflect the trader’s analytical perspective, making it easier to interpret price behavior during decision making. |
Despite these advantages, a practical limitation quickly emerges once multiple trendlines are drawn on the chart. Monitoring how price interacts with each line requires continuous attention. In an active trading environment where several charts may be open simultaneously, maintaining that level of observation throughout the trading session becomes difficult.
As a result, important interactions between price and trendlines can easily be missed. A trader might step away from the chart for a short period and return only to discover that price has already touched or broken a carefully drawn trendline. Often, these interactions represent valuable trading opportunities that could have been used to enter or manage positions more effectively. The core problem lies not in the analysis itself, but in the ability to continuously monitor the evolving relationship between price and the manually drawn lines.
The concept introduced in this article addresses this limitation by combining manual chart analysis with automated monitoring. The underlying principle is straightforward: the trader remains responsible for identifying meaningful levels on the chart, while the program takes over the repetitive task of observing price behavior around those levels.
Once a trendline is synchronized with the monitoring system, the program begins evaluating how price behaves relative to that line. Several types of interactions can then be detected automatically. These include situations where the market approaches the line, touches it, breaks through it, or reverses direction after contacting it. Each of these interactions provides useful information about the strength of the trend and the potential for continuation or reversal.
System Workflow
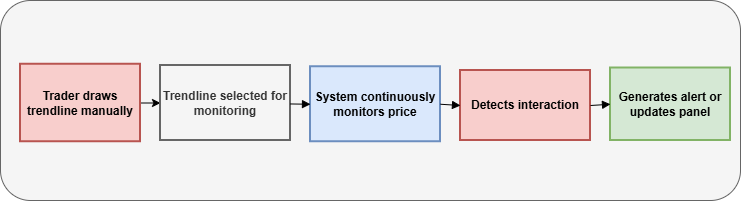
To understand how the monitoring mechanism operates in practice, it is helpful to examine the workflow followed by the system. The process is designed to preserve manual analysis while allowing the program to handle continuous observation of price behavior.
1. Drawing the Trendline
The process begins with the trader drawing a trendline directly on the chart using the standard drawing tools available in MetaTrader 5. At this stage, the trader identifies meaningful pivot points such as swing highs or swing lows and connects them to form the trendline. This step preserves the discretionary nature of price action analysis. Instead of relying entirely on algorithmic detection, the trader visually interprets the chart and determines which pivot points best represent the underlying market structure.
2. Synchronizing the Trendline
Once the trendline has been drawn, it must be synchronized with the monitoring system. Synchronization acts as a confirmation step indicating that the particular line should be tracked by the program. During this stage, the trendline is registered internally by the system and added to the list of monitored chart objects. From that moment onward, the program treats the line as an analytical reference level that requires continuous observation.
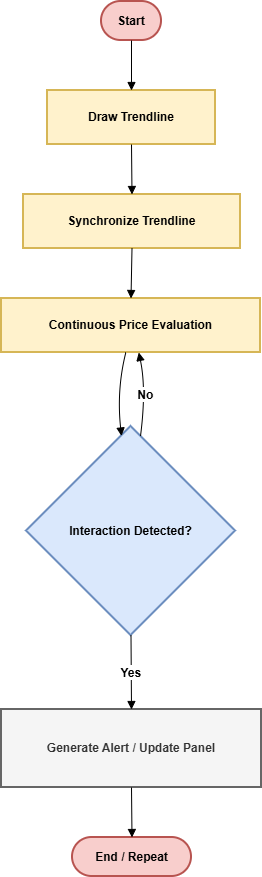
3. Continuous Price Evaluation
After synchronization is completed, the program begins continuously evaluating the relationship between the current market price and the position of the trendline. Unlike horizontal support or resistance levels, a trendline represents a dynamic level whose value changes as time progresses. For this reason, the system calculates the exact price of the line at the current moment and compares it with the live market price on every evaluation cycle. This calculation allows the program to determine whether price is approaching the line, touching it, or moving away from it.
4. Interaction Detection and Alerts
Whenever price interacts with the monitored trendline, the system detects the event and generates appropriate notifications.
Several interaction states can be identified, including the previously described approach, touch, breakout, and reversal conditions.
When such events occur, alerts are generated to inform the trader. In addition, the monitoring panel on the chart displays real-time status updates showing the most recent interaction detected for each synchronized line.
5. Automated Monitoring with Manual Control
Through this workflow, manually drawn trendlines become continuously monitored analytical levels.
This combination creates an analytical environment in which manual price action analysis is preserved, but the repetitive task of monitoring trendline interactions is handled automatically. As a result, the trader can focus on interpreting market behavior rather than constantly watching every chart.
MQL5 Implementation
This section explains how the monitoring concept is translated into a functional system using MQL5 within MetaTrader 5. The objective is to allow manually drawn trendlines to be recognized by the program and monitored continuously as price evolves on the chart.
The Expert Advisor performs several coordinated tasks. It detects trendline objects created by the trader, synchronizes selected lines with the monitoring system, maintains an organized internal structure of monitored lines, calculates the dynamic value of each trendline over time, evaluates price interactions with those lines, and communicates detected events through alerts and visual feedback. Each of these tasks is implemented through specific MQL5 functions and mechanisms that work together to create a responsive monitoring environment.
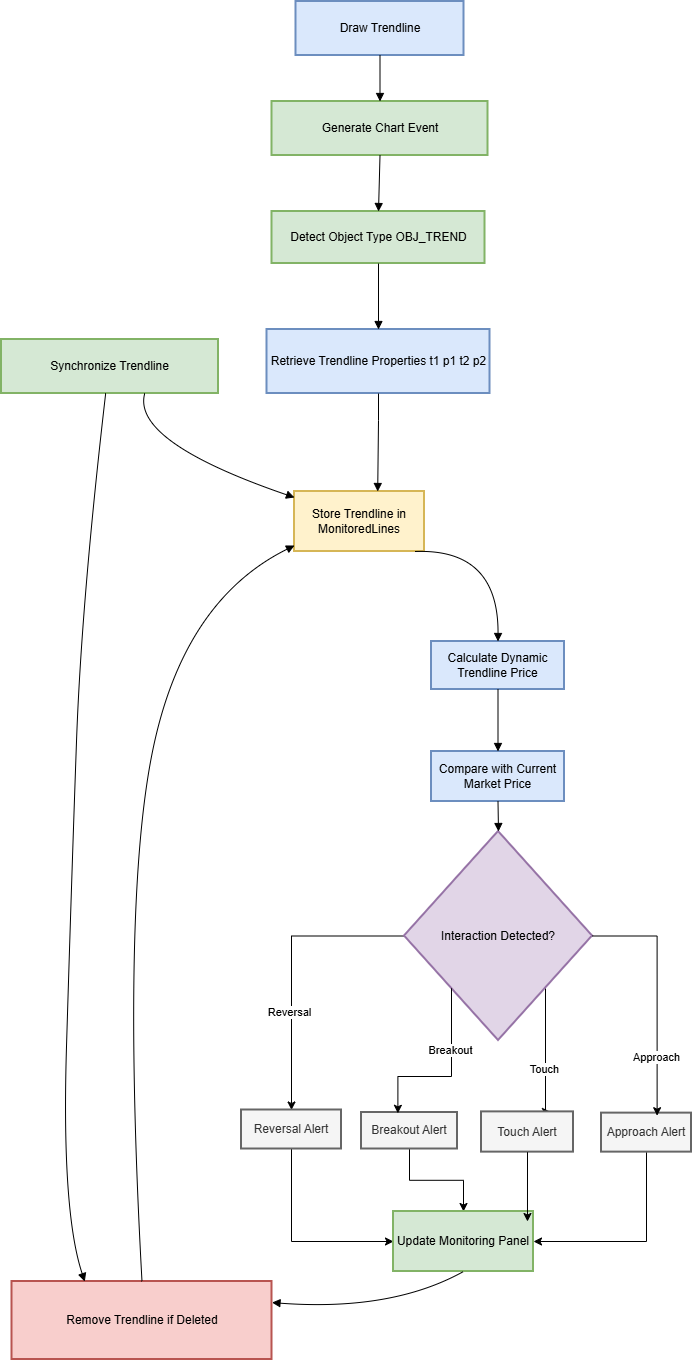
Detecting Trendlines on the Chart
The first step of the implementation is identifying trendlines drawn on the chart. In MetaTrader 5, graphical elements such as trendlines are represented as chart objects that can be accessed and managed programmatically.
To detect these objects, the Expert Advisor relies on the chart event system provided by MQL5, particularly the OnChartEvent() function. This function is triggered whenever a chart event occurs, including the creation, modification, or deletion of graphical objects. When a trader draws a trendline on the chart, the platform generates an event that can be captured within OnChartEvent(). The function receives parameters that describe the event type and the object involved. Using this information, the program can determine whether the event corresponds to the creation of a trendline.
//+------------------------------------------------------------------+
//| Handle chart events and detect newly created trendlines          |
//+------------------------------------------------------------------+
void OnChartEvent(const int id,
                  const long &lparam,
                  const double &dparam,
                  const string &sparam)
  {
   //--- Detect object creation event
   if(id==CHARTEVENT_OBJECT_CREATE)
     {
      string object_name=sparam;

      //--- Check if the object is a trendline
      if(ObjectGetInteger(0,object_name,OBJPROP_TYPE)==OBJ_TREND)
        {
         Print("Trendline detected: ",object_name);

         //--- Further processing can be performed here
        }
     }
  }
//+------------------------------------------------------------------+
The identification of a trendline is typically performed by retrieving the object type using the ObjectGetInteger() function and checking whether the object belongs to the OBJ_TREND category. Once confirmed, the program retrieves the name of the object and proceeds to access its properties. Through this mechanism, the Expert Advisor becomes aware of analytical structures introduced directly by the trader.
Retrieving Trendline Properties
After a trendline has been detected, the next step involves retrieving its structural parameters. The Expert Advisor retrieves the two anchor points that define the trendline on the chart. Each anchor point contains a time coordinate and a price coordinate. These values are obtained using the functions ObjectGetInteger() and ObjectGetDouble().
The time coordinates are retrieved through properties such as OBJPROP_TIME1 and OBJPROP_TIME2, while the price coordinates are obtained through OBJPROP_PRICE1 and OBJPROP_PRICE2. By collecting these four values, the system obtains the full geometric definition of the trendline. These parameters are then stored internally so that the line can be evaluated during future monitoring cycles.
//+------------------------------------------------------------------+
//| Retrieve anchor points from a trendline object                   |
//+------------------------------------------------------------------+
bool GetTrendlinePoints(string name,
                        datetime &t1,double &p1,
                        datetime &t2,double &p2)
  {
   //--- Verify that the object exists
   if(ObjectFind(0,name)<0)
      return(false);

   //--- Retrieve first anchor point
   t1=(datetime)ObjectGetInteger(0,name,OBJPROP_TIME1);
   p1=ObjectGetDouble(0,name,OBJPROP_PRICE1);

   //--- Retrieve second anchor point
   t2=(datetime)ObjectGetInteger(0,name,OBJPROP_TIME2);
   p2=ObjectGetDouble(0,name,OBJPROP_PRICE2);

   return(true);
  }
//+------------------------------------------------------------------+
This step effectively transforms the graphical trendline into numerical data that can be analyzed by the program.
Synchronizing the Trendline with the Monitoring System
After a trendline has been detected and its properties retrieved, the next step is synchronization. Synchronization determines whether a specific trendline object should be monitored by the system.
Traders frequently draw multiple trendlines while analyzing a chart. Some of these lines may serve only as temporary visual guides, while others represent meaningful support or resistance levels that require continuous observation. For this reason, the monitoring system does not automatically track every trendline that appears on the chart. Instead, a synchronization step is introduced. During this step, the trader selects the specific trendline object that should be monitored. The program then retrieves the object name and its anchor point properties using ObjectGetInteger() and ObjectGetDouble().
//+------------------------------------------------------------------+
//| Structure representing a monitored trendline                     |
//+------------------------------------------------------------------+
struct TrendlineInfo
  {
   string   name;
   datetime t1;
   double   p1;
   datetime t2;
   double   p2;
   int      state;
  };

//--- Dynamic list of monitored trendlines
TrendlineInfo MonitoredLines[];

//+------------------------------------------------------------------+
//| Synchronize a trendline with the monitoring system               |
//+------------------------------------------------------------------+
void SynchronizeTrendline(string name)
  {
   TrendlineInfo line;

   //--- Retrieve anchor points
   if(!GetTrendlinePoints(name,line.t1,line.p1,line.t2,line.p2))
      return;

   line.name=name;
   line.state=0;

   int size=ArraySize(MonitoredLines);
   ArrayResize(MonitoredLines,size+1);

   MonitoredLines[size]=line;

   Print("Trendline synchronized: ",name);
  }
//+------------------------------------------------------------------+
Once the trendline is synchronized, its identifying information is stored inside the internal monitoring structure. The system records:
- The trendline object name
- The first anchor point (OBJPROP_TIME1, OBJPROP_PRICE1)
- The second anchor point (OBJPROP_TIME2, OBJPROP_PRICE2)
- The current monitoring state
From this point forward, the synchronized trendline becomes part of the set of analytical levels evaluated continuously by the Expert Advisor. This approach ensures that monitoring remains controlled and focused only on the trendlines that the trader considers important.
Maintaining a Structured List of Monitored Trendlines
Once a trendline has been synchronized, its information must be stored in a structured form so that it can be evaluated efficiently during each monitoring cycle. Without such a structure, the program would have difficulty managing multiple trendlines simultaneously. The Expert Advisor therefore maintains an internal list that contains all synchronized trendlines currently being monitored. This list can be implemented using arrays or custom structures that store the properties associated with each trendline object.
//+------------------------------------------------------------------+
//| Main monitoring cycle executed on every market tick              |
//+------------------------------------------------------------------+
void OnTick()
  {
   int total=ArraySize(MonitoredLines);

   //--- Evaluate each synchronized trendline
   for(int i=0;i<total;i++)
     {
      EvaluateTrendline(MonitoredLines[i]);
     }
  }
//+------------------------------------------------------------------+
When a trendline is synchronized, the program retrieves its identifying information using functions such as ObjectName() and ObjectFind(). These functions allow the program to confirm the presence of the object on the chart and obtain its unique name. The object name becomes the primary identifier used by the monitoring system. The structural properties of the trendline are then retrieved using ObjectGetInteger() and ObjectGetDouble(). These functions provide access to the anchor point coordinates that define the line:
- OBJPROP_TIME1 — time of the first anchor point
- OBJPROP_PRICE1 — price of the first anchor point
- OBJPROP_TIME2 — time of the second anchor point
- OBJPROP_PRICE2 — price of the second anchor point
These values are stored together with the trendline object name inside the monitoring structure. Additional fields can also be stored, including calculated parameters such as the slope of the trendline or the last detected interaction state. Once the information has been stored, the monitoring system can iterate through the list during every execution of the OnTick() function. During each cycle, the program retrieves the stored parameters for each trendline and recalculates its current price value based on the latest time coordinate. This structured list allows the Expert Advisor to evaluate price behavior relative to every synchronized trendline in a consistent and organized manner. Even when several lines exist on the chart, the system can process them sequentially without losing track of their individual properties.
Another advantage of maintaining this structure is that it simplifies lifecycle management. If a monitored trendline is deleted from the chart, the program can detect the event through OnChartEvent() and remove the corresponding entry from the internal list. This ensures that the monitoring system always reflects the current state of the chart.
Mathematical Calculation of the Trendline Value
A trendline represents a straight line connecting two points on the chart. Each point contains a time coordinate and a price coordinate. To evaluate interactions between price and the line, the program must determine the expected price of the trendline at the current time.
//+------------------------------------------------------------------+
//| Calculate the dynamic price of a trendline at current time       |
//+------------------------------------------------------------------+
double CalculateTrendlinePrice(datetime t1,double p1,
                               datetime t2,double p2,
                               datetime current_time)
  {
   double slope=(p2-p1)/(double)(t2-t1);

   double price=p1+slope*(current_time-t1);

   return(price);
  }
//+------------------------------------------------------------------+
Let the two anchor points of the trendline be defined as:
- Point 1: (T1, P1)
- Point 2: (T2, P2)
Where T represents the time coordinate and P represents the price coordinate. The slope of the trendline is calculated using the difference between the two anchor points:
- Slope = (P2 - P1)/(T2 - T1)
Once the slope is known, the price of the trendline at any time T can be calculated using the linear equation of a straight line:
![]()
In the program, the current time value can be obtained using the TimeCurrent() function or by referencing the time of the latest bar. Substituting this value into the equation produces the exact price level of the trendline at the present moment. This calculated value represents the dynamic position of the trendline. As time progresses and new candles appear, the computed price of the line automatically adjusts, ensuring that price interactions are always evaluated against the correct position of the line.
Evaluating Price Interactions with Trendlines
Once the current value of the trendline has been calculated, the program compares this value with the live market price obtained through SymbolInfoDouble(). This comparison allows the system to determine how the market price behaves relative to the monitored trendline. By evaluating the distance and direction of price movement relative to the line, the program can classify several types of interactions.
//+------------------------------------------------------------------+
//| Evaluate market interaction with a monitored trendline           |
//+------------------------------------------------------------------+
void EvaluateTrendline(TrendlineInfo &line)
  {
   datetime current_time=TimeCurrent();

   double trend_price=
      CalculateTrendlinePrice(line.t1,line.p1,
                              line.t2,line.p2,
                              current_time);

   double market_price=SymbolInfoDouble(_Symbol,SYMBOL_BID);

   double tolerance=10*_Point;

   double distance=MathAbs(market_price-trend_price);

   //--- Detect touch condition
   if(distance<=tolerance)
     {
      Print("Touch detected on ",line.name);
     }

   //--- Detect breakout above
   else if(market_price>trend_price+tolerance)
     {
      Print("Breakout above trendline: ",line.name);
     }

   //--- Detect breakout below
   else if(market_price<trend_price-tolerance)
     {
      Print("Breakout below trendline: ",line.name);
     }
  }
//+------------------------------------------------------------------+
Several interaction conditions can be evaluated:
- Approach — when the market price moves within a predefined distance of the trendline. This condition signals that price is nearing a potentially important level.
- Touch — when the price reaches the calculated value of the line. This event indicates that the trendline is being tested by the market.
- Breakout — when the price crosses the line and continues moving beyond it. Such behavior often suggests that the market is breaking the previously respected trend structure.
- Rejection — when the price approaches the line but reverses direction without crossing it. This behavior may indicate that the trendline is acting as a dynamic support or resistance level.
To detect these conditions reliably, the system evaluates the difference between the current market price and the calculated trendline value. A tolerance threshold is usually applied to account for small price fluctuations and spread variations. Through this comparison process, the monitoring system continuously interprets the relationship between the market and the synchronized trendlines.
Generating Alerts and Notifications
Once an interaction event is detected, the system informs the trader through alerts and notifications. Several built-in MQL5 functions can be used for this purpose. The Alert() function provides an immediate notification within the platform, while the Print() function records information in the terminal journal. If mobile notifications are required, the SendNotification() function can also be used.
//+------------------------------------------------------------------+
//| Send notifications when trendline interaction occurs             |
//+------------------------------------------------------------------+
void NotifyInteraction(string message)
  {
   //--- Platform alert
   Alert(message);

   //--- Terminal log entry
   Print(message);

   //--- Mobile push notification
   SendNotification(message);
  }
//+------------------------------------------------------------------+
These alerts notify the trader whenever price approaches or interacts with a monitored trendline. As a result, important events can be identified even when the trader is not continuously watching the chart.
Visual Feedback Through a Chart Panel
In addition to alerts, the system provides visual feedback directly on the chart through a monitoring panel. This panel can be constructed using chart labels created with the ObjectCreate() function. Each label displays information about a synchronized trendline, including its name and the most recent interaction detected.
//+------------------------------------------------------------------+
//| Create a simple monitoring panel on the chart                    |
//+------------------------------------------------------------------+
void CreatePanel()
  {
   string name="TrendMonitorPanel";

   //--- Create label if it does not exist
   if(ObjectFind(0,name)<0)
     {
      ObjectCreate(0,name,OBJ_LABEL,0,0,0);

      ObjectSetInteger(0,name,OBJPROP_CORNER,CORNER_LEFT_UPPER);
      ObjectSetInteger(0,name,OBJPROP_XDISTANCE,10);
      ObjectSetInteger(0,name,OBJPROP_YDISTANCE,20);
      ObjectSetInteger(0,name,OBJPROP_FONTSIZE,10);
     }

   //--- Update label text
   ObjectSetString(0,name,OBJPROP_TEXT,
                   "Trendline Monitoring Active");
  }
//+------------------------------------------------------------------+
By updating these labels dynamically, the panel provides a real-time overview of monitored trendlines and their interaction status. The trader can quickly assess how price is behaving relative to each line without manually inspecting them individually.
This visual interface complements the alert system and improves the usability of the monitoring tool.
Managing the Lifecycle of Trendlines
As trading analysis evolves, trendlines may be modified or removed from the chart. The monitoring system must therefore remain synchronized with the current state of the chart. This is handled by detecting object deletion events through OnChartEvent(). When a monitored trendline is removed from the chart, the corresponding record is also removed from the internal monitoring structure.
//+------------------------------------------------------------------+
//| Remove a trendline from the monitoring list                      |
//+------------------------------------------------------------------+
void RemoveTrendline(string name)
  {
   int total=ArraySize(MonitoredLines);

   for(int i=0;i<total;i++)
     {
      if(MonitoredLines[i].name==name)
        {
         ArrayRemove(MonitoredLines,i);
         Print("Trendline removed: ",name);
         break;
        }
     }
  }
//+------------------------------------------------------------------+
This dynamic management ensures that the monitoring list always reflects the active trendlines currently present on the chart.
Integrating Manual Analysis with Automated Monitoring
The final result is a hybrid analytical system that combines manual chart analysis with automated observation. After synchronization, the Expert Advisor continuously evaluates price interaction with the selected trendlines.
By combining discretionary analysis with automated monitoring, the system reduces the need for constant chart observation while ensuring that important interactions between price and trendlines are detected in real time.
Using the Expert Advisor
Once compiled and attached to a chart, the Expert Advisor provides three buttons:
- Draw — Click to enter drawing mode. The button highlights, indicating that the EA is ready to detect a new trendline.
- Sync — After drawing a line, this button becomes active. Click it to synchronize the newly drawn line with the monitoring system.
- Clear All — Removes all synchronized trendlines from monitoring and reverts them to their original appearance.
After synchronization, the line automatically extends to the right, changes color, and becomes thicker. The monitoring panel displays all synchronized lines along with their current interaction state. The panel can be dragged to any position on the chart by clicking and holding its background.
Testing
To verify the behavior of the monitoring system, several tests were conducted across different currency pairs and timeframes. For clarity, this section focuses on a representative example using EURUSD on the M30 timeframe, shown in the GIF below.
During testing, multiple trendlines were synchronized simultaneously to verify that the monitoring system could track several analytical levels without performance degradation. The Expert Advisor was also tested across different timeframes to ensure that the trendline price calculation remained accurate regardless of chart scale.
As the market evolved, the program continuously monitored price interaction with the synchronized trendline. When price approached and eventually touched the line, the system detected the interaction and generated an alert. This behavior can be observed in the GIF, where the alert is triggered at the moment the price reaches the monitored trendline.
Overall, the results demonstrate that the system performs reliably in a live chart environment, successfully detecting and reporting interactions between price and the synchronized trendlines.
Conclusion
The implemented approach turns manual trendline analysis into a reproducible hybrid workflow: you keep full control over which anchor points and lines represent the market structure, and the EA handles continuous observation and event reporting. Practically, after following the article you will have a clear, implementable template for MT5 that provides:
- detection of newly created OBJ_TREND via OnChartEvent,
- an explicit synchronization step to register only the trader-selected lines,
- storage of anchor points and lifecycle handling (create/modify/delete),
- calculation of the line's dynamic price at the current time,
- classification of interactions (approach, touch, breakout, rejection) with a tolerance threshold,
- notifications through Alert/Print/SendNotification and a live chart panel showing status.
Limitations and scope are explicit: the system monitors only synchronized lines (not every graphic on the chart), uses a configurable tolerance to reduce false signals, and evaluates interactions against the chosen market price reference (eg, BID). The result is a practical, testable Expert Advisor pattern that preserves human judgment in drawing trendlines while reliably increasing situational awareness and reducing missed opportunities.
Warning: All rights to these materials are reserved by MetaQuotes Ltd. Copying or reprinting of these materials in whole or in part is prohibited.
This article was written by a user of the site and reflects their personal views. MetaQuotes Ltd is not responsible for the accuracy of the information presented, nor for any consequences resulting from the use of the solutions, strategies or recommendations described.

- Free trading apps
- Over 8,000 signals for copying
- Economic news for exploring financial markets
You agree to website policy and terms of use