
Price Action Analysis Toolkit Development (Part 67): Automating Support and Resistance Monitoring in MQL5

Contents
Introduction
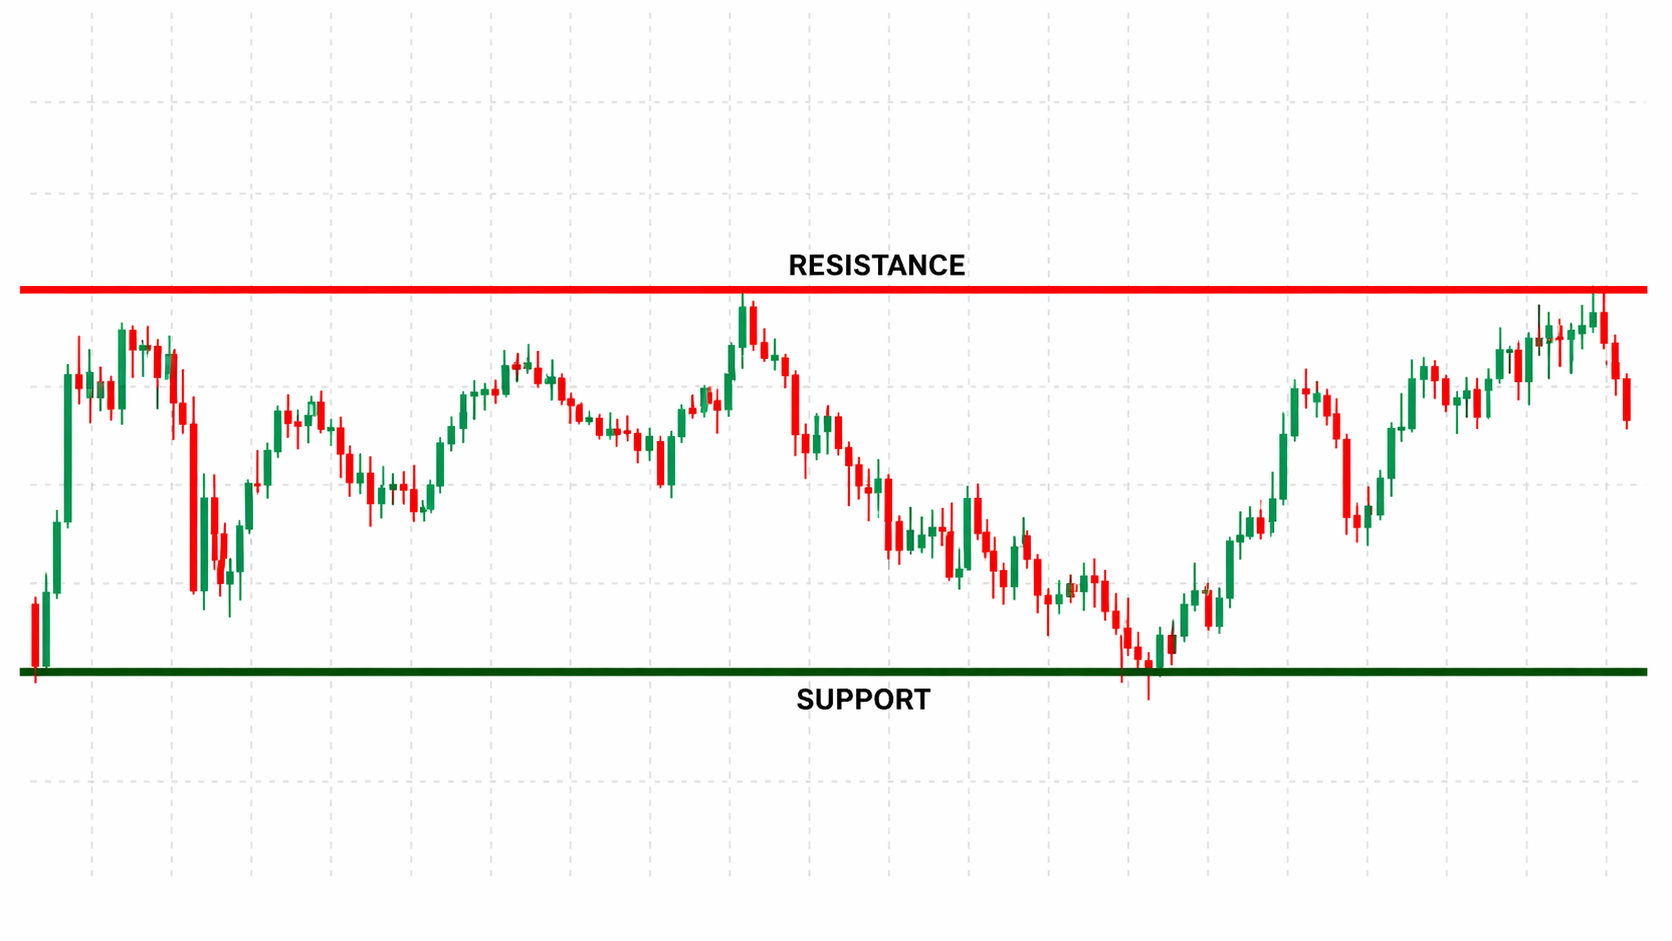
Horizontal support and resistance levels are widely used in price action trading to mark areas where the market is likely to react. Traders draw these levels manually to support decisions such as entries, exits, and risk management. Once placed on the chart, these levels remain static. Price continues to move, but the trader must constantly observe the chart to detect interactions such as touches, breakouts, or reversals. In fast or multi-chart environments, this continuous monitoring becomes difficult, and important movements can be missed.
The limitation is not support and resistance itself. It is the lack of an automated mechanism to track real-time price interaction with manually defined levels. This article presents an MQL5 Expert Advisor that monitors manually drawn horizontal levels in real time. It detects key interactions as the market develops. By the end of this article, you will have built an Expert Advisor that monitors manually drawn support and resistance levels in real time. It detects touches, breakouts, reversals, and retests, and generates structured alerts and chart-based signals.
Defining the Model
Conceptual Foundation: Horizontal Lines as Support and Resistance
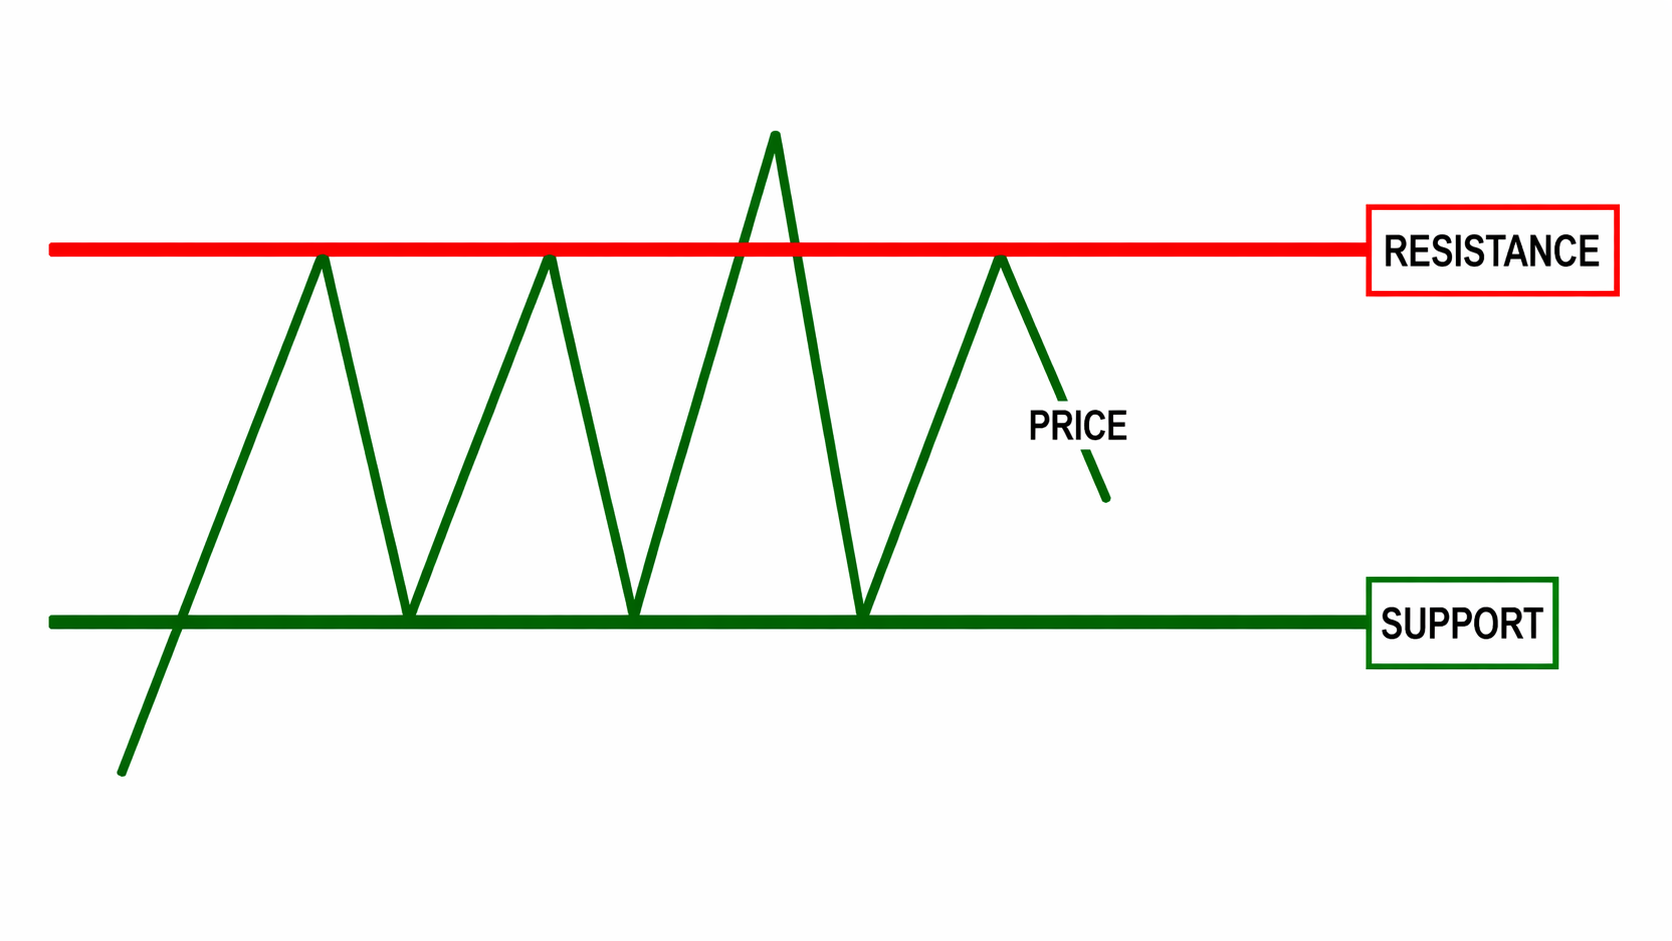
Horizontal support and resistance levels represent discrete price zones where market interaction is repeatedly observed. These levels are typically derived from swing highs, swing lows, and areas of price consolidation, where order flow has historically shifted direction. As a result, they serve as stable reference points for evaluating future price behavior.
This stability makes horizontal levels particularly suitable for algorithmic monitoring. Unlike dynamic indicators, a horizontal line defines a fixed price boundary, allowing direct comparison between current market price and a predefined level. This enables deterministic evaluation of metrics such as proximity, contact, or crossover without requiring recalculation of the level itself. Support and resistance are conceptually zones. In this system, they are represented as discrete horizontal price levels to enable precise, deterministic interaction detection.
However, while these levels are structurally well-defined, their practical use remains limited by manual observation. Once placed, horizontal lines do not provide any automated feedback. Interactions such as touches, breakouts, or reversals must be visually identified by the trader in real time. In fast-moving or multi-chart environments, this introduces a monitoring gap, where valid interactions may occur without being detected.
Construction of Support and Resistance Levels
Support and resistance levels are not arbitrary; they follow well-defined construction rules:
- Swing Highs and Lows: Peaks and troughs in the price chart serve as natural anchors.
- Clustering Zones: Areas where price repeatedly reacts create stronger horizontal levels.
- Round Numbers and Psychological Levels: Whole numbers or levels ending in 0, 50, or 100 often act as psychological barriers due to collective trader behavior.
- Confluence with Indicators: While horizontal lines are purely price-based, their strength increases when aligned with other tools like moving averages, Fibonacci retracements, or VWAP.
A robust support or resistance level emerges when multiple criteria converge. These levels become actionable reference points for entries, exits, and risk management.
Integrating Horizontal Lines into an Automated Monitoring System
The conceptual gap arises when traders rely on manual placement but lack automated monitoring. A modern price action toolkit can bridge the static and dynamic worlds. The EA functions as an intelligent observer:
- It detects each horizontal line present on the chart, recognizing its price level and attributes.
- It tracks price interactions with these levels in real time, including touches, breakouts, and retests.
- It applies decision logic depending on the type of interaction, triggering alerts or further analysis as needed.
This model preserves the trader’s workflow: lines are still drawn manually, maintaining human discretion, while the EA adds continuous vigilance and responsiveness.
Theoretical Architecture: From Interaction to Action
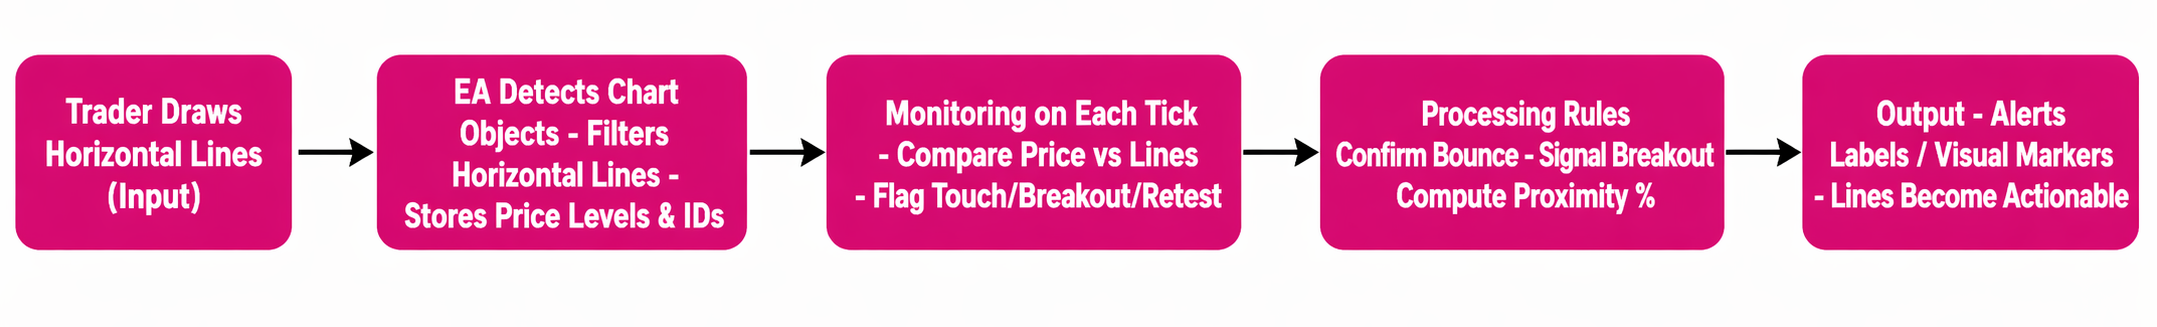
Conceptually, the system functions as a monitoring loop:
- Input: The trader draws horizontal lines on any timeframe.
- Detection: The EA queries all chart objects, filters for horizontal lines, and stores their price levels and identifiers.
- Monitoring: On each new tick, price is compared against every line. Relevant conditions (touch, breakout, or retest) are flagged.
- Processing: The system evaluates predefined conditions — for instance, identifying a bounce, signaling a potential breakout, or measuring proximity to a level.
- Output: Alerts, labels, or visual markers are generated, transforming static lines into responsive monitoring tools.
This architecture is entirely theoretical at this stage, but it establishes the bridge from manual analysis to automated, rule-based monitoring, setting the stage for the next section: designing and implementing the logic in MQL5.
Significance in Price Action Analysis
Integrating manual horizontal lines with automated monitoring enhances reliability and efficiency:
- Traders no longer miss critical interactions.
- Alerts allow for timely decision-making even during high-volatility sessions.
- Historical analysis becomes easier, as the system can log interactions and track patterns over time.
- Combined with other toolkit modules, these interactions can feed into larger strategies, including Fibonacci retracements, trendline synchronization, and VWAP overlays.
In essence, the system preserves the trader’s discretion while adding algorithmic precision, forming a cohesive foundation for responsive price action analysis.
MQL5 Implementation
This section presents the MQL5 implementation of the system, focusing on its structure, logic, and execution flow. The objective is to translate the previously defined model into a functional Expert Advisor that operates in real time.
The implementation is explained step by step. It covers initialization, user interaction handling, level synchronization, continuous price monitoring, candlestick pattern detection, and alert/signal generation. Each component is designed to operate as part of a cohesive monitoring system.
Expert Initialization: OnInit()
The EA starts with OnInit(), which prepares the chart environment and enables interactive monitoring. ChartSetInteger() subscribes to chart events for object creation and deletion. This allows the EA to detect manually drawn support and resistance lines in real time. Within this initialization, three key buttons are created using the CreateButton() function: Sync Supports, Sync Resistances, and Clear All Lines. These buttons allow the user to synchronize manual lines with the EA’s monitoring array or to reset the chart to a clean state. By handling these operations during initialization, the EA ensures the monitoring system is active immediately after attachment.
//+------------------------------------------------------------------+
//| Expert initialization function                                   |
//| Sets up chart events and user interface                          |
//+------------------------------------------------------------------+
int OnInit()
{
  //--- Enable chart event tracking
  ChartSetInteger(0,CHART_EVENT_OBJECT_CREATE,true);
  ChartSetInteger(0,CHART_EVENT_OBJECT_DELETE,true);

  //--- Create control buttons
  CreateButton("SyncSupportBtn","Sync Supports",10,20,120,35,clrGreen);
  CreateButton("SyncResistanceBtn","Sync Resistances",140,20,120,35,clrRed);
  CreateButton("ClearAllBtn","Clear All Lines",270,20,120,35,clrOrange);

  return(INIT_SUCCEEDED);
}
//+------------------------------------------------------------------+
Expert Deinitialization: OnDeinit()
The OnDeinit() function complements OnInit() by ensuring proper cleanup when the EA is removed or the chart is closed. All buttons created during initialization are deleted to prevent orphaned objects. Proper deinitialization is crucial in MQL5 because residual objects or arrays can interfere with other EAs or clutter the chart. By handling this automatically, the EA maintains chart integrity and avoids unintended errors or visual inconsistencies.
//+------------------------------------------------------------------+
//| Expert deinitialization function                                 |
//| Cleans up chart objects                                          |
//+------------------------------------------------------------------+
void OnDeinit(const int reason)
{
  //--- Remove UI buttons
  ObjectDelete(0,PREFIX+"SyncSupportBtn");
  ObjectDelete(0,PREFIX+"SyncResistanceBtn");
  ObjectDelete(0,PREFIX+"ClearAllBtn");
}
//+------------------------------------------------------------------+
User Interface Creation: CreateButton()
CreateButton() is the core of the interactive interface. It dynamically generates chart buttons with customizable properties such as position, size, font, background color, and border type. Each button receives a unique name using the PREFIX macro, which prevents naming collisions with other chart objects. Properties like OBJPROP_COLOR, OBJPROP_BGCOLOR, OBJPROP_FONTSIZE, and OBJPROP_BORDER_TYPE are configured to ensure visual clarity and usability. The creation of these buttons enables users to synchronize and manage support and resistance levels without modifying arrays or structures manually, fostering a more intuitive and responsive experience.
//+------------------------------------------------------------------+
//| Create a styled button on the chart                              |
//+------------------------------------------------------------------+
void CreateButton(string btnName,string text,int x,int y,int w,int h,color bgColor)
{
  string objName=PREFIX+btnName;

  ObjectCreate(0,objName,OBJ_BUTTON,0,0,0);
  ObjectSetInteger(0,objName,OBJPROP_XDISTANCE,x);
  ObjectSetInteger(0,objName,OBJPROP_YDISTANCE,y);
  ObjectSetInteger(0,objName,OBJPROP_XSIZE,w);
  ObjectSetInteger(0,objName,OBJPROP_YSIZE,h);
  ObjectSetInteger(0,objName,OBJPROP_CORNER,CORNER_LEFT_UPPER);

  ObjectSetInteger(0,objName,OBJPROP_FONTSIZE,11);
  ObjectSetString(0,objName,OBJPROP_FONT,"Segoe UI");

  ObjectSetInteger(0,objName,OBJPROP_COLOR,clrWhite);
  ObjectSetInteger(0,objName,OBJPROP_BGCOLOR,bgColor);
  ObjectSetInteger(0,objName,OBJPROP_BORDER_COLOR,clrDarkGray);
  ObjectSetInteger(0,objName,OBJPROP_BORDER_TYPE,BORDER_RAISED);

  ObjectSetInteger(0,objName,OBJPROP_STATE,false);
  ObjectSetString(0,objName,OBJPROP_TEXT,text);
  ObjectSetInteger(0,objName,OBJPROP_SELECTABLE,false);
  ObjectSetInteger(0,objName,OBJPROP_HIDDEN,false);
}
//+------------------------------------------------------------------+
Chart Event Handling: OnChartEvent()
The OnChartEvent() function monitors all relevant chart events, including button clicks and object deletions. When the Sync Supports or Sync Resistances buttons are clicked, OnChartEvent() triggers the SyncAllLines() function with the corresponding line type. This ensures that all new horizontal lines drawn manually are included in the monitoring array. If a horizontal line is deleted, the handler removes its entry from g_lines[] and deletes the corresponding label. UpdateClearButtonState() is also called to provide dynamic feedback on whether there are any active lines, giving the trader a visual confirmation of the system’s status.
//+------------------------------------------------------------------+
//| Handle chart events                                              |
//| Button clicks and object deletion                                |
//+------------------------------------------------------------------+
void OnChartEvent(const int id,const long &lparam,const double &dparam,const string &sparam)
{
  //--- Button clicks
  if(id==CHARTEVENT_OBJECT_CLICK)
  {
    if(sparam==PREFIX+"SyncSupportBtn")
      SyncAllLines(TYPE_SUPPORT);
    else if(sparam==PREFIX+"SyncResistanceBtn")
      SyncAllLines(TYPE_RESISTANCE);
    else if(sparam==PREFIX+"ClearAllBtn")
      ClearAllLines();
  }
  //--- Object deletion
  else if(id==CHARTEVENT_OBJECT_DELETE)
  {
    for(int i=0;i<ArraySize(g_lines);i++)
    {
      if(g_lines[i].name==sparam)
      {
        g_lines[i].exists=false;

        string labelName=sparam+"_label";
        if(ObjectFind(0,labelName)>=0)
          ObjectDelete(0,labelName);

        break;
      }
    }

    //--- Compact array
    int newSize=0;
    for(int i=0;i<ArraySize(g_lines);i++)
    {
      if(g_lines[i].exists)
      {
        if(i!=newSize)
          g_lines[newSize]=g_lines[i];
        newSize++;
      }
    }
    ArrayResize(g_lines,newSize);

    UpdateClearButtonState();
  }
}
//+------------------------------------------------------------------+
Line Synchronization: SyncAllLines()
SyncAllLines() is responsible for iterating through all chart objects, identifying horizontal lines (OBJ_HLINE), and registering them for monitoring if they are not already tracked. The function leverages the ELineType enumeration to classify lines as support or resistance and calls AddLineToMonitor() for each new line. It also prints the number of synchronized lines for debugging and transparency. This function ensures that manual technical analysis is fully integrated with automated monitoring, maintaining consistency between human insight and system feedback.
//+------------------------------------------------------------------+
//| Synchronize horizontal lines                                     |
//+------------------------------------------------------------------+
void SyncAllLines(ELineType type)
{
  int total=ObjectsTotal(0);
  int added=0;

  for(int i=0;i<total;i++)
  {
    string objName=ObjectName(0,i);
    ENUM_OBJECT objType=(ENUM_OBJECT)ObjectGetInteger(0,objName,OBJPROP_TYPE);

    if(objType==OBJ_HLINE)
    {
      double price=ObjectGetDouble(0,objName,OBJPROP_PRICE,0);

      if(price>0 && !IsLineMonitored(objName))
      {
        AddLineToMonitor(objName,price,type);
        added++;
      }
    }
  }

  Print("Synced ",added," lines.");
  UpdateClearButtonState();
}
//+------------------------------------------------------------------+
Monitoring Check: IsLineMonitored()
Before a line is added, IsLineMonitored() checks whether it already exists in the g_lines[] array. This prevents duplication and guarantees that the EA only monitors unique levels. Maintaining an accurate internal representation of active lines is critical for the system to function correctly, especially when multiple lines are drawn close together or when users frequently adjust chart elements.
//+------------------------------------------------------------------+
//| Check if line already monitored                                  |
//+------------------------------------------------------------------+
bool IsLineMonitored(string lineName)
{
  for(int i=0;i<ArraySize(g_lines);i++)
  {
    if(g_lines[i].name==lineName)
      return(true);
  }

  return(false);
}
//+------------------------------------------------------------------+
Adding Lines: AddLineToMonitor()
The AddLineToMonitor() function is where each horizontal line is initialized for active monitoring. It assigns a unique identifier and generates a structured label for each level. Support lines are labeled in the format SupX @ Price, while resistance lines follow ResX @ Price, where X is an incrementing identifier. This labeling system ensures that each level remains uniquely identifiable throughout monitoring and alert generation. The function also applies line colors and widths depending on whether it is a support or resistance level.
Beyond basic initialization, the system assigns a comprehensive set of state variables to each line. These include tracking flags such as lastSide, prevValidSide, touched, breakoutAlerted, and reversalAlerted. These variables are essential for maintaining continuity in price interaction logic, allowing the system to detect transitions such as breakouts, confirm reversals, and prevent duplicate alerts. This structured state management ensures that each level behaves as an independent monitoring entity.
//+------------------------------------------------------------------+
//| Add horizontal line to monitoring                                |
//+------------------------------------------------------------------+
void AddLineToMonitor(string lineName,double price,ELineType type)
{
  int sz=ArraySize(g_lines);
  ArrayResize(g_lines,sz+1);

  //--- Initialize
  g_lines[sz].name=lineName;
  g_lines[sz].price=price;
  g_lines[sz].type=type;
  g_lines[sz].exists=true;

  //--- Apply styling
  color lineColor=(type==TYPE_SUPPORT)?SupportColor:ResistanceColor;

  ObjectSetInteger(0,lineName,OBJPROP_COLOR,lineColor);
  ObjectSetInteger(0,lineName,OBJPROP_WIDTH,LineWidth);
  ObjectSetInteger(0,lineName,OBJPROP_STYLE,STYLE_SOLID);
  ObjectSetInteger(0,lineName,OBJPROP_RAY_RIGHT,true);
}
//+------------------------------------------------------------------+
Clearing Monitored Lines: ClearAllLines()
ClearAllLines() resets the monitoring system by deleting all labels and clearing the g_lines[] array. Support and resistance counters are reset, ensuring that new synchronizations start from a clean slate. This function is essential for flexible workflow management, allowing traders to start a new analysis session without residual data from previous lines interfering with monitoring or alerts. It integrates with UpdateClearButtonState() to dynamically adjust button feedback, indicating whether the chart contains active monitoring levels.
//+------------------------------------------------------------------+
//| Remove all monitored lines and reset counters                    |
//+------------------------------------------------------------------+
void ClearAllLines(){
   for(int i=ArraySize(g_lines)-1;i>=0;i--){
      string name=g_lines[i].name;
      string labelName=name+"_label";
      if(ObjectFind(0,labelName)>=0)
         ObjectDelete(0,labelName);
   }

   ArrayResize(g_lines,0);
   g_nextSupportId=1;
   g_nextResistanceId=1;

   UpdateClearButtonState();
   Print("All monitored lines cleared.");
}
//+------------------------------------------------------------------+
Dynamic Button State: UpdateClearButtonState()
The UpdateClearButtonState() function provides immediate visual feedback by changing the color of the Clear All Lines button based on whether any lines are currently monitored. This small but critical feature enhances usability by allowing traders to quickly identify if the system is actively tracking levels, without inspecting internal arrays or console messages. Visual feedback like this ensures intuitive interaction and improves the overall user experience.
//+------------------------------------------------------------------+
//| Update Clear All button color based on whether lines exist       |
//+------------------------------------------------------------------+
void UpdateClearButtonState(){
   bool hasLines=(ArraySize(g_lines)>0);
   color bgColor=hasLines?clrOrange:clrGray;
   ObjectSetInteger(0,PREFIX+"ClearAllBtn",OBJPROP_BGCOLOR,bgColor);
}
//+------------------------------------------------------------------+
Arrow Placement Logic: CanPlaceArrow() and PlaceArrow()
Signal management relies on CanPlaceArrow() to determine whether a new arrow can be placed. This includes respecting cooldown timers and the “one per bar” rule. Once conditions are satisfied, PlaceArrow() calls DrawArrow() to render the arrow on the chart. The system uses consistent color-coding and directional symbols to differentiate buy and sell signals, reinforcing a clear visual language. These functions together ensure that every alert is actionable and non-redundant, supporting accurate decision-making without cluttering the chart.
//+------------------------------------------------------------------+
//| Check arrow conditions                                           |
//+------------------------------------------------------------------+
bool CanPlaceArrow(int idx,datetime barTime)
{
  if(!PlaceBuySellArrows)
    return(false);

  if(ArrowCooldownSeconds>0 && TimeCurrent()-g_lines[idx].lastArrowTime<ArrowCooldownSeconds)
    return(false);

  if(ArrowOnlyOnePerBar && g_lines[idx].lastArrowBarTime==barTime)
    return(false);

  return(true);
}
//+------------------------------------------------------------------+

//+------------------------------------------------------------------+
//| Place arrow                                                      |
//+------------------------------------------------------------------+
void PlaceArrow(int idx,datetime barTime,double price,bool isBuy)
{
  if(!CanPlaceArrow(idx,barTime))
    return;

  DrawArrow(barTime,price,isBuy);

  g_lines[idx].lastArrowTime=TimeCurrent();
  g_lines[idx].lastArrowBarTime=barTime;
}
//+------------------------------------------------------------------+
Price Monitoring: OnTick()
The OnTick() function forms the engine of the monitoring system. It continuously evaluates all registered lines against the current bid price for several types of interactions: approach, touch, breakout, retest, and reversal. Tolerances are dynamically calculated, and side indicators such as lastSide and prevValidSide are updated to track ongoing trends. Flags such as touched, breakoutAlerted, and patternAlerted prevent redundant notifications. They also ensure significant market activity is captured. By operating on every tick, the EA converts static support and resistance levels into a live, intelligent monitoring tool. Breakout detection is driven by a change in price position relative to the level.
The system tracks which side of the level price was previously on and compares it with the current position. When price transitions from one side of the level to the other, a breakout is confirmed. The direction of this breakout is determined using the last valid side before the transition, allowing the system to classify the move as bullish or bearish. This directional classification is then used to trigger appropriate signals such as arrow placement and retest tracking. Retest detection activates only after a confirmed breakout. An internal breakout state flag prevents false retest alerts during normal price fluctuations.
All interaction checks are performed using the bid price. In live trading environments, spread should be considered when interpreting touches and breakouts, particularly for instruments with variable spreads.
//+------------------------------------------------------------------+
//| Main monitoring loop - detects all price interactions            |
//+------------------------------------------------------------------+
void OnTick(){
   double point       = SymbolInfoDouble(_Symbol,SYMBOL_POINT);
   double touchTol    = TouchTolerancePips*PipMultiplier*point;
   double approachTol = ApproachZonePips*PipMultiplier*point;
   double patternZone = PatternZonePips*PipMultiplier*point;

   datetime currentBarTime = iTime(_Symbol,PERIOD_CURRENT,0);

   for(int i=0;i<ArraySize(g_lines);i++){
      if(!g_lines[i].exists) continue;

      double levelPrice = g_lines[i].price;
      double bid        = SymbolInfoDouble(_Symbol,SYMBOL_BID);
      double distance   = MathAbs(bid-levelPrice);

      int currentSide = (bid<levelPrice)?1:((bid>levelPrice)?-1:0);

      //--- Update previous valid side
      if(currentSide!=0)
         g_lines[i].prevValidSide = currentSide;

      //--- 1. Approach
      if(distance<=approachTol && !g_lines[i].approached){
         SendAlert("Approaching "+g_lines[i].label,levelPrice);
         g_lines[i].approached = true;
      }

      //--- 2. Touch (new bar)
      if(g_lines[i].lastTouchBarTime<currentBarTime){
         double barHigh = iHigh(_Symbol,PERIOD_CURRENT,0);
         double barLow  = iLow(_Symbol,PERIOD_CURRENT,0);
         if(levelPrice>=barLow-touchTol && levelPrice<=barHigh+touchTol){
            if(!g_lines[i].touched){
               g_lines[i].sideBeforeTouch = g_lines[i].lastSide;
               SendAlert("Touch at "+g_lines[i].label,levelPrice);
               g_lines[i].touched = true;
               g_lines[i].breakoutAlerted = false;
            }
         }
         g_lines[i].lastTouchBarTime = currentBarTime;
      }

      //--- 3. Breakout
      int lastSide = g_lines[i].lastSide;
      if(lastSide!=0 && currentSide!=0 && currentSide!=lastSide && !g_lines[i].breakoutAlerted){
         SendAlert("Breakout on "+g_lines[i].label,levelPrice);
         g_lines[i].breakoutAlerted = true;
         g_lines[i].breakoutHappened = true;
         int sideBefore = (g_lines[i].prevValidSide!=0)?g_lines[i].prevValidSide:lastSide;
         g_lines[i].breakoutDirection = (sideBefore==1 && currentSide==-1)?1:-1;

         if(ArrowOnBreakout){
            bool isBuy = (g_lines[i].breakoutDirection==1);
            PlaceArrow(i,currentBarTime,levelPrice,isBuy);
         }
      }

      //--- 4. Reversal
      if(g_lines[i].touched && g_lines[i].sideBeforeTouch!=0 && !g_lines[i].reversalAlerted &&
         currentSide==g_lines[i].sideBeforeTouch && !g_lines[i].breakoutAlerted){
         SendAlert("Reversal on "+g_lines[i].label,levelPrice);
         g_lines[i].reversalAlerted = true;

         if(ArrowOnReversal){
            bool isBuy = (g_lines[i].sideBeforeTouch==1);
            PlaceArrow(i,currentBarTime,levelPrice,isBuy);
         }
      }

      //--- 5. Retest
      if(DetectRetest && g_lines[i].breakoutHappened && !g_lines[i].retestAlerted &&
         distance<=touchTol){
         SendAlert("Retest of "+g_lines[i].label+" after breakout",levelPrice);
         g_lines[i].retestAlerted = true;
         g_lines[i].breakoutHappened = false;

         if(ArrowOnRetest && g_lines[i].breakoutDirection!=0){
            bool isBuy = (g_lines[i].breakoutDirection==1);
            PlaceArrow(i,currentBarTime,levelPrice,isBuy);
         }
      }

      //--- 6. Candlestick patterns
      if(DetectReversalPatterns && !g_lines[i].patternAlerted){
         bool priceInZone = (MathAbs(bid-levelPrice)<=patternZone) ||
                            (MathAbs(iClose(_Symbol,PERIOD_CURRENT,0)-levelPrice)<=patternZone);
         if(priceInZone){
            string patternName = CheckReversalPatterns();
            if(patternName!="" && g_lines[i].lastPatternAlertTime!=currentBarTime){
               SendAlert(StringFormat("Pattern [%s] at %s",patternName,g_lines[i].label),levelPrice);
               g_lines[i].patternAlerted = true;
               g_lines[i].lastPatternAlertTime = currentBarTime;

               if(ArrowOnPattern){
                  bool bullish = (StringFind(patternName,"Bullish")>=0);
                  PlaceArrow(i,currentBarTime,levelPrice,bullish);
               }
            }
         }
      }

      //--- Reset flags when price moves away
      if(distance>approachTol){
         g_lines[i].approached = false;
         g_lines[i].patternAlerted = false;
      }

      g_lines[i].lastSide = currentSide;
   }
}
//+------------------------------------------------------------------+
Drawing Arrows: DrawArrow()
DrawArrow() manages the creation of arrow objects with precise placement relative to candle highs and lows. Each arrow is assigned a unique name using the current tick count (GetTickCount64()), preventing naming conflicts. Colors and symbols correspond to buy or sell conditions, ensuring a clear and consistent visual interface. Through this function, every breakout, retest, or reversal detected in OnTick() is communicated instantly, making the chart a real-time guide to market action.
//+------------------------------------------------------------------+
//| Draw arrow object                                                |
//+------------------------------------------------------------------+
void DrawArrow(datetime time,double price,bool isBuy)
{
  string name=PREFIX+"Arrow_"+IntegerToString(GetTickCount64());

  int code=isBuy?ArrowBuyCode:ArrowSellCode;
  color clr=isBuy?ArrowBuyColor:ArrowSellColor;

  if(ObjectCreate(0,name,OBJ_ARROW,0,time,price))
  {
    ObjectSetInteger(0,name,OBJPROP_ARROWCODE,code);
    ObjectSetInteger(0,name,OBJPROP_COLOR,clr);
    ObjectSetInteger(0,name,OBJPROP_WIDTH,2);
  }
}
//+------------------------------------------------------------------+
Alert System: SendAlert()
The alerting mechanism, implemented in SendAlert(), centralizes all notifications, including popups, sounds, and push notifications. Alerts include the type of event and the exact price level, providing detailed, actionable information for each interaction. This consistent and immediate feedback loop reinforces the system’s role as an intelligent assistant, bridging the gap between analysis and execution.
//+------------------------------------------------------------------+
//| Send alert                                                       |
//+------------------------------------------------------------------+
void SendAlert(string msg,double price)
{
  string text=StringFormat("%s at %G",msg,price);

  if(AlertPopup)
    Alert(text);

  if(AlertSound)
    PlaySound(SoundFile);

  if(PushNotifications)
    SendNotification(text);

  Print(text);
}
//+------------------------------------------------------------------+
Candlestick Pattern Detection: CheckReversalPatterns()
CheckReversalPatterns() analyzes completed bars for reversal candlestick patterns (engulfing, hammer, shooting star). It calculates body size, shadows, and relative positions to validate a pattern before triggering an alert or placing an arrow. By integrating these signals with support and resistance monitoring, the EA provides multi-layered confirmation, combining static levels with market context to produce highly reliable signals.
//+------------------------------------------------------------------+
//| Detect common candlestick reversal patterns on completed bars    |
//+------------------------------------------------------------------+
string CheckReversalPatterns()
{
//--- Use only completed bars
   for(int shift = 1; shift <= 3; shift++)
     {
      double open  = iOpen(_Symbol, PERIOD_CURRENT, shift);
      double high  = iHigh(_Symbol, PERIOD_CURRENT, shift);
      double low   = iLow(_Symbol,  PERIOD_CURRENT, shift);
      double close = iClose(_Symbol, PERIOD_CURRENT, shift);

      if(open == 0 || high == 0 || low == 0 || close == 0)
         continue;

//--- Candle structure
      double bodySize    = MathAbs(close - open);
      double lowerShadow = (open < close) ? open - low : close - low;
      double upperShadow = (open < close) ? high - close : high - open;

//--- Hammer / Shooting Star
      if(PatternHammer && close > open && lowerShadow >= 2 * bodySize && upperShadow <= bodySize * 0.3)
         return "Hammer (Bullish)";

      if(PatternHammer && close < open && upperShadow >= 2 * bodySize && lowerShadow <= bodySize * 0.3)
         return "Shooting Star (Bearish)";

//--- Engulfing Patterns
      if(PatternEngulfing && shift >= 2)
        {
         double prevOpen  = iOpen(_Symbol, PERIOD_CURRENT, shift + 1);
         double prevClose = iClose(_Symbol, PERIOD_CURRENT, shift + 1);

         if(close > open && prevClose < prevOpen && open <= prevClose && close >= prevOpen)
            return "Bullish Engulfing";

         if(close < open && prevClose > prevOpen && open >= prevClose && close <= prevOpen)
            return "Bearish Engulfing";
        }

//--- Morning / Evening Star
      if(PatternStar && shift >= 3)
        {
         double prevOpen2  = iOpen(_Symbol, PERIOD_CURRENT, shift + 2);
         double prevClose2 = iClose(_Symbol, PERIOD_CURRENT, shift + 2);
         double prevOpen1  = iOpen(_Symbol, PERIOD_CURRENT, shift + 1);
         double prevClose1 = iClose(_Symbol, PERIOD_CURRENT, shift + 1);

         bool smallBody = MathAbs(prevClose1 - prevOpen1) <=
                          (iHigh(_Symbol, PERIOD_CURRENT, shift + 1) -
                           iLow(_Symbol, PERIOD_CURRENT, shift + 1)) * 0.3;

         bool morningStar = (prevClose2 < prevOpen2) &&
                            smallBody &&
                            (close > open) &&
                            (close > (prevOpen2 + prevClose2) / 2);

         if(morningStar)
            return "Morning Star (Bullish)";

         bool eveningStar = (prevClose2 > prevOpen2) &&
                            smallBody &&
                            (close < open) &&
                            (close < (prevOpen2 + prevClose2) / 2);

         if(eveningStar)
            return "Evening Star (Bearish)";
        }

//--- Piercing / Dark Cloud Cover
      if(PatternPiercing && shift >= 2)
        {
         double prevOpen  = iOpen(_Symbol, PERIOD_CURRENT, shift + 1);
         double prevClose = iClose(_Symbol, PERIOD_CURRENT, shift + 1);

         bool piercing = (prevClose < prevOpen) &&
                         (close > open) &&
                         (open < prevClose) &&
                         (close > (prevOpen + prevClose) / 2) &&
                         (close < prevOpen);

         if(piercing)
            return "Piercing Line (Bullish)";

         bool darkCloud = (prevClose > prevOpen) &&
                          (close < open) &&
                          (open > prevClose) &&
                          (close < (prevOpen + prevClose) / 2) &&
                          (close > prevOpen);

         if(darkCloud)
            return "Dark Cloud Cover (Bearish)";
        }
     }

   return "";
}
//+------------------------------------------------------------------+
The system now operates as a continuous monitoring layer that evaluates price interaction with each synchronized level in real time. Each component contributes to a defined execution flow, from initialization and user interaction to level synchronization, condition evaluation, and signal generation.
Core functions including OnInit(), CreateButton(), SyncAllLines(), AddLineToMonitor(), OnTick(), DrawArrow(), SendAlert(), and CheckReversalPatterns() coordinate these processes, ensuring that support and resistance levels are actively monitored and interpreted within a structured framework.
The complete source code for the SupportResistanceMonitor Expert Advisor is provided in the attachment. To use it, place the file in the MetaTrader 5 “Experts” directory, restart the platform or refresh the Navigator, and compile the code using MetaEditor. Once compiled successfully, the EA can be attached to any chart for execution.
The following section demonstrates how the system operates under live chart conditions, including level synchronization, interaction detection, and alert generation.
Testing and Outcomes
This section evaluates the system under live chart conditions to verify its functionality and interaction with manually defined levels. The evaluation is structured in two parts: first, validating the level synchronization and interaction process through a guided setup procedure, and second, examining the results during continuous price monitoring.
Testing Procedure and Workflow Validation
Testing begins by attaching the Expert Advisor to an active chart. The interface then allows direct interaction with support and resistance levels.
The first step in the workflow involves manually plotting support and resistance lines on the chart. This approach uses price zones defined by market structure rather than automated assumptions. It allows precise alignment with visible swing highs and lows, maintaining consistency with price action principles. After placing the levels, the synchronization process is triggered using the Sync Supports and Sync Resistances buttons. Internally, these functions capture the coordinates of the drawn objects and register them for monitoring. At this point, the system transitions from a static setup phase into an active monitoring state.
Once synchronization is complete, the EA continuously tracks price behavior relative to these levels. No further manual adjustments are required. The system evaluates each incoming tick and completed bar, checking for interactions such as touches, rejections, candlestick formations, and breakouts. The GIF demonstrates this full cycle—from attaching the EA, defining levels, synchronizing them, and enabling continuous monitoring. This confirms that the workflow remains stable during runtime. More importantly, it proves that the system maintains a clear separation between user-defined structure and automated analysis, which is essential for disciplined trading.
Observed System Behavior and Results
Following the workflow validation, the next phase focuses on how the system behaves under live market conditions. The provided chart image illustrates this clearly. The EA successfully registers and monitors synchronized levels such as resistance (Res1 @ 7956.7) and support (Sup1 @ 7933.9) at structurally relevant zones. These levels align with visible price reactions, confirming that the synchronization logic correctly interprets user-defined inputs.

As price approaches the resistance level, the system monitors without generating premature signals. This controlled behavior is important because it avoids noise and ensures that signals are only produced when meaningful conditions are met. A rejection near resistance is followed by a downward move, showing that the level is respected before any breakout logic is triggered. As the market continues, price moves toward the support zone and eventually breaks below it with strong momentum. The EA identifies this event and logs it as a breakout, confirming that the breakout detection logic is functioning as expected.
Candlestick Pattern and Alert Validation
The alert window provides further confirmation of system accuracy. A key example is the detection of a Bearish Engulfing pattern at a support level (Sup2 @ 4348.68). This demonstrates that the candlestick detection logic is not operating in isolation but is instead filtered through structural context.

In addition to pattern detection, the system generates multiple breakout alerts such as:
- Breakout on support levels
- Breakout on resistance levels
These alerts are timestamped and recorded in the log, providing a reliable history of events. Repeated breakout notifications at the same level across different time periods confirm that the system continues monitoring levels dynamically rather than treating them as single-use events.

Visual Feedback and Chart Interpretation
The chart output presents visual elements such as directional arrows and labeled support and resistance levels, allowing price interactions to be interpreted directly on the chart. Arrows indicate detected events, while labeled levels provide clear reference points for price positioning. This reduces reliance on logs or alert messages, as key interactions are represented visually within the chart context. As a result, the monitoring process becomes integrated into the chart itself, supporting structured and continuous analysis without requiring constant manual observation.
Conclusion
This article addressed the limitation of manually drawn support and resistance levels, where continuous observation is required to detect interactions such as approaches, touches, breakouts, and retests. The solution introduces a structured Expert Advisor that automates this monitoring while preserving the manual process of level identification.
The implementation translates this model into a functional system. OnChartEvent() captures user actions, SyncAllLines() and AddLineToMonitor() manage level synchronization and state tracking, and OnTick() continuously evaluates price interaction using defined tolerances. Detected events are classified and processed, with SendAlert() and DrawArrow() providing real-time feedback through alerts and chart-based signals.
As a result, manually defined levels are transformed into actively monitored reference points. The system evaluates only synchronized levels and applies consistent rules for interaction detection, enabling structured and repeatable analysis without continuous chart observation.
The final deliverable is a fully functional SupportResistanceMonitor Expert Advisor capable of detecting price interactions, generating alerts, and rendering visual signals based on manually defined support and resistance levels in real time.
Warning: All rights to these materials are reserved by MetaQuotes Ltd. Copying or reprinting of these materials in whole or in part is prohibited.
This article was written by a user of the site and reflects their personal views. MetaQuotes Ltd is not responsible for the accuracy of the information presented, nor for any consequences resulting from the use of the solutions, strategies or recommendations described.

- Free trading apps
- Over 8,000 signals for copying
- Economic news for exploring financial markets
You agree to website policy and terms of use