
Price Action Analysis Toolkit Development (Part 65): Building an MQL5 System to Monitor and Analyze Manually Drawn Fibonacci Levels

Contents
- Introduction
- Understanding the Concept
- MQL5 Implementation
- Testing and System Interaction
- Conclusion
Introduction
Fibonacci retracement remains one of the most trusted tools for identifying potential reaction zones in price action. In practice, these levels are seldom left entirely to automation. They are drawn manually, guided by market structure, swing interpretation, and context. This discretion is deliberate—because the effectiveness of a Fibonacci setup relies on the trader’s understanding of the market, not on rigid rules.
The challenge arises after the drawing is finished. As more Fibonacci structures accumulate across charts and timeframes, continuous monitoring becomes impractical. Price may approach, touch, break, or reject a level while attention is elsewhere—switching charts, analyzing new setups, or simply stepping away from the terminal. These missed interactions are not a result of poor analysis but the inherent limitation of tracking multiple levels in real time.
This article addresses that gap: preserving manual Fibonacci drawings as the foundation of analysis while automating the monitoring of those levels. The solution is to detect manually drawn OBJ_FIBO objects, convert their levels into price references, manage their lifecycle (create/modify/delete), and evaluate price behavior around each level in real time.
Understanding the Concept
In the previous article, the focus was on synchronizing manually drawn trendlines with an automated monitoring system. That approach established a clear coordination model: the trader defines structure through discretionary drawing, while the Expert Advisor assumes responsibility for continuous observation. This combination allowed key interactions—such as touches, breakouts, and reversals—to be detected without constant chart monitoring, improving both efficiency and analytical consistency.
This article extends the same principle to another essential tool in price action analysis: the Fibonacci retracement. Instead of automating the drawing process, the system preserves manual input and introduces automation only at the monitoring stage. The trader defines the structure; the system tracks it.
Before exploring the implementation, it is important to briefly revisit the concept behind the Fibonacci retracement tool and its role in market analysis.
Fibonacci Retracement
The Fibonacci retracement tool is derived from the Fibonacci sequence, a numerical progression introduced by Leonardo of Pisa, where each number is the sum of the two preceding values. Ratios derived from this sequence—most notably 23.6%, 38.2%, 50%, 61.8%, and 78.6%—form the basis of the retracement levels used in trading. In price action analysis, the tool is applied by selecting two significant points on the chart, typically a swing high and a swing low. The retracement levels are then projected between these points, highlighting potential areas where price may pause, reverse, or continue its movement.
These levels are most effective when supported by confluence or confirmation from other market factors, acting as zones where price may pause, reverse, or continue.
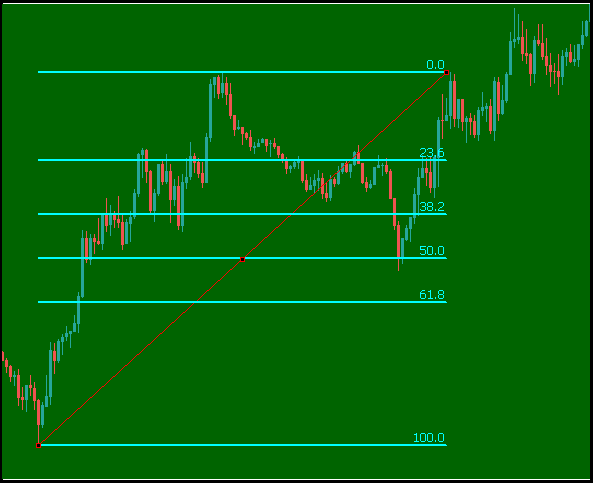
Figure 1: Manually drawn Fibonacci retracement
These levels are not predictive in isolation. Their strength comes from how price reacts around them. Traders use them to identify zones of interest where market structure may shift, making them a valuable component in discretionary analysis.
Limitations of Manual Monitoring
While drawing Fibonacci retracements manually provides flexibility and precision, monitoring their levels continuously introduces practical challenges.
| Limitation | Description |
|---|---|
| Limited Attention | Multiple charts and timeframes make it difficult to track all levels simultaneously |
| Missed Interactions | Key events such as touches or breakouts may occur while the chart is not being watched |
| No Persistent Tracking | Manual observation does not maintain state (e.g., whether a level has already been tested) |
| Inconsistent Evaluation | Different observations at different times may lead to subjective interpretation |
| Time Intensive | Continuous chart monitoring reduces efficiency, especially during active sessions |
These limitations do not reduce the value of Fibonacci analysis, but they highlight the need for a supporting mechanism that can maintain consistency without removing trader control.
From Manual Drawing to EA Monitoring
Manually drawing Fibonacci retracements remains a critical part of analysis. It allows precise placement based on context, structure, and experience. The trader decides which swings are meaningful, which automatically filters out noise that a fully automated system might misinterpret. This manual step preserves analytical intent. It ensures that the levels being monitored are relevant to the current market structure rather than mechanically generated.
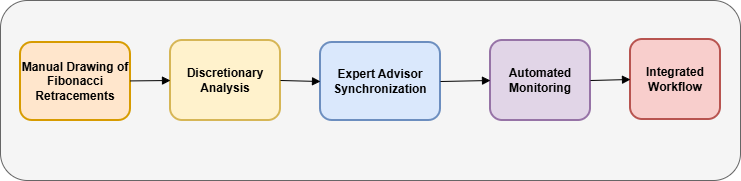
Figure 2: System workflow
The transition to automation begins after this step. Once the Fibonacci retracement is drawn, the Expert Advisor synchronizes with the object, extracts its levels, and converts them into actively monitored structures. From that point onward, the system continuously evaluates price interaction with each level.
This creates an integrated workflow:
- Manual input defines structure
- Automated monitoring ensures consistency and persistence
The result is a system that retains the strengths of discretionary analysis while removing the burden of constant observation.
System Overview
The system is designed as a structured pipeline that transforms a manually drawn Fibonacci object into a set of monitored levels. It begins with the trader drawing a Fibonacci retracement on the chart. The Expert Advisor detects the object through chart events and places it in a ready state. Once confirmed, the system processes the object by extracting all level values and calculating their corresponding prices.
Each level is then converted into a horizontal line and stored within an internal structure for tracking. These levels are continuously evaluated on every tick, where price interactions are classified into approach, touch, breakout, or reversal conditions. When a significant interaction is detected, the system generates alerts and updates a visual panel that reflects the current state of all monitored levels. The system also maintains synchronization with the chart by handling object deletion and state resets dynamically.
This architecture ensures that manually defined Fibonacci structures are preserved and actively monitored in real time. The next section details how this logic is implemented using MQL5.
MQL5 Implementation
This section translates the concept of monitoring manually drawn Fibonacci retracements into a structured, event-driven system within MetaTrader 5 using MQL5. The goal is not to replace the trader’s discretion, but to strengthen it—ensuring that every manually defined Fibonacci level is continuously observed, evaluated, and acted upon when necessary.
In practical trading, the challenge is rarely drawing Fibonacci levels—it is maintaining awareness of how price behaves around them over time. As market conditions evolve, attention shifts between charts, timeframes, and positions. This implementation addresses that gap by converting static, manually drawn Fibonacci structures into dynamic, continuously monitored analytical elements.
From a system design perspective, the implementation follows a layered architecture: configuration, event detection, object transformation, structured storage, continuous evaluation, and feedback. Each layer builds on the previous one, ensuring that the final system is both technically robust and practically aligned with real trading workflows.
EA Identity and Compilation Configuration
The implementation begins by defining the identity and compilation behavior of the EA. This step may appear simple, but it establishes the foundation for maintainability, version control, and execution reliability.
//+------------------------------------------------------------------+
//|                                             FibonacciMonitor.mq5 |
//|                                               Christian Benjamin |
//|                          https://www.mql5.com/en/users/lynnchris |
//+------------------------------------------------------------------+
#property copyright "Copyright 2026, Christian Benjamin"
#property link      "https://www.mql5.com/en/users/lynnchris"
#property version   "1.0"
#property strict
The #property strict directive enforces modern MQL5 standards, ensuring that all variables are explicitly defined and type-safe. In a system that reacts to real-time price changes and chart events, even small inconsistencies can lead to incorrect signal generation or missed interactions.
From a development standpoint, this strict mode minimizes ambiguity and enforces disciplined coding practices. From a trading standpoint, it ensures that the system behaves consistently across different market conditions and broker environments. This is especially important for monitoring logic, where precision and reliability directly affect decision-making.
Configurable Input Parameters (System Control Layer)
The next stage introduces a set of input parameters that define how the system behaves. These inputs allow the trader to control sensitivity, visualization, and interaction logic without modifying the internal code.
//--- Input parameters
input bool   AlertPopup=true;          // Show popup alert on events
input bool   AlertSound=true;          // Play sound on events
input string SoundFile="alert.wav";    // Sound file name
input bool   PushNotifications=true;   // Send push notification to mobile
input color  MonitorColor=clrBlue;     // Color for monitored lines
input int    LineWidth=2;              // Line thickness after syncing
input color  PendingColor=clrGray;     // Color for newly drawn Fibonacci
input double TouchTolerancePips=0.5;   // Touch tolerance (pips)
input double ApproachZonePips=10.0;    // Approach zone (pips)
input int    PipMultiplier=1;          // Points per pip (10 for forex, 1 for indices/commodities)
input bool   NormalizeLevels=false;    // true: 0% = lowest price, 100% = highest; false: follow drawing direction
input bool   InvertMapping=true;       // true: first anchor = 100%, second anchor = 0% (only when NormalizeLevels=false)
input bool   ShowLabels=true;          // Show labels on the chart
//--- Panel settings
input int    PanelX=10;
input int    PanelY=150;
input color  PanelBgColor=clrWhite;
input color  PanelHeaderColor=clrLightGray;
input color  PanelTextColor=clrBlack;
input int    PanelPadding=4;
These parameters directly influence how the system interprets price behavior. For example, TouchTolerancePips defines how close price must be to a Fibonacci level before it is considered a valid interaction. In volatile markets, a slightly larger tolerance prevents false negatives, while in precise conditions, a smaller tolerance improves accuracy.
The ApproachZonePips parameter introduces a predictive layer. Instead of reacting only when price touches a level, the system can signal when price is approaching a zone of interest. This is particularly useful for preparation—allowing positioning or confirmation before the actual interaction occurs.
The PipMultiplier parameter ensures correct scaling across different instruments (10 for most forex pairs, 1 for indices and commodities). Mapping parameters such as NormalizeLevels and InvertMapping ensure that the system correctly interprets Fibonacci levels regardless of how the trader draws them. Since traders may draw Fibonacci tools in different directions depending on trend context, these controls maintain logical consistency in level calculation.
State Management and Data Structures
To effectively monitor multiple Fibonacci levels, the system introduces structured data storage with state tracking. This allows each level to be evaluated independently and consistently over time.
//--- State management and data structures
enum EMode { MODE_IDLE, MODE_DRAWING, MODE_SYNC_READY };

enum EAlertState
{
   ALERT_NONE,
   ALERT_APPROACH_SENT,
   ALERT_TOUCH_SENT,
   ALERT_BREAKOUT_SENT,
   ALERT_REVERSAL_SENT
};

struct SMonitoredLevel
{
   string      name;
   double      levelPercentage;
   string      levelLabel;
   int         lastSide;
   int         sideBeforeTouch;
   bool        alertedBreak;
   datetime    lastTouchBarTime;
   EAlertState alertState;
};

EMode g_mode=MODE_IDLE;
string g_pendingFibo="";
SMonitoredLevel g_monitored[];
int g_panelX,g_panelY;
string g_panelBGName="";
This structure is a key architectural decision. It tracks each Fibonacci level independently, which makes transitions (touch, breakout, reversal) easier to detect and interpret. Instead of treating Fibonacci as a single object, the system decomposes it into individual levels, each with its own identity and state. From a trading perspective, this is important because different Fibonacci levels behave differently. A 38.2% level may act as a continuation point, while 61.8% may signal deeper retracement or reversal. By tracking each level independently, the system preserves this analytical distinction. From a programming perspective, the inclusion of fields such as lastSide, sideBeforeTouch, alertedBreak, and alertState allows the system to detect transitions—not just static conditions. This enables advanced interpretations such as confirming genuine breakouts or identifying reversals after a false move.
Expert Initialization and Deinitialization
The OnInit() function prepares the system environment and constructs the interactive interface.
//+------------------------------------------------------------------+
//| Expert advisor initialization                                    |
//+------------------------------------------------------------------+
int OnInit()
  {
   ChartSetInteger(0,CHART_EVENT_OBJECT_CREATE,true);
   ChartSetInteger(0,CHART_EVENT_OBJECT_DELETE,true);

   CreateStyledButton("DrawBtn","Draw Fibo",10,20,120,35,clrGreen,false);
   CreateStyledButton("SynchBtn","Convert & Monitor",10,60,140,35,clrGray,false);
   CreateStyledButton("ClearAllBtn","Clear All Levels",10,100,140,35,clrOrange,false);

   ObjectSetInteger(0,PREFIX+"SynchBtn",OBJPROP_BGCOLOR,clrGray);
   ObjectSetInteger(0,PREFIX+"ClearAllBtn",OBJPROP_BGCOLOR,clrOrange);

   g_panelX=PanelX;
   g_panelY=PanelY;
   ChartRedraw();
   UpdatePanel();
   return(INIT_SUCCEEDED);
  }
//+------------------------------------------------------------------+
The OnDeinit() function ensures clean removal of all objects when the EA is removed.
//+------------------------------------------------------------------+
//| Expert deinitialization function                                 |
//+------------------------------------------------------------------+
void OnDeinit(const int reason)
  {
   ObjectDelete(0,PREFIX+"DrawBtn");
   ObjectDelete(0,PREFIX+"SynchBtn");
   ObjectDelete(0,PREFIX+"ClearAllBtn");
   DeletePanelObjects();
  }
//+------------------------------------------------------------------+
This stage defines the workflow structure. Instead of automatically reacting to every Fibonacci object, the system introduces controlled interaction through buttons. The design ensures that only relevant analytical structures are monitored. In real trading environments, charts often contain temporary drawings or exploratory analysis. Automatically tracking all objects would introduce noise and reduce clarity. By requiring explicit synchronization, the system enforces discipline—only the Fibonacci levels that matter are monitored. This aligns with how experienced traders operate: selective focus on high-probability structures.
Chart Event Handling (Object Detection, Button Control)
The OnChartEvent() function acts as the bridge between user actions and system logic.
//+------------------------------------------------------------------+
//| Chart event handler                                              |
//+------------------------------------------------------------------+
void OnChartEvent(const int id,const long &lparam,const double &dparam,const string &sparam)
  {
   if(id==CHARTEVENT_OBJECT_CLICK)
     {
      if(sparam==PREFIX+"DrawBtn")
        {
         if(g_mode==MODE_IDLE)
           {
            g_mode=MODE_DRAWING;
            ObjectSetInteger(0,PREFIX+"DrawBtn",OBJPROP_STATE,true);
            ObjectSetString(0,PREFIX+"DrawBtn",OBJPROP_TEXT,"Draw Fibo (Active)");
            ObjectSetInteger(0,PREFIX+"DrawBtn",OBJPROP_BGCOLOR,clrLightBlue);
            ObjectSetInteger(0,PREFIX+"SynchBtn",OBJPROP_BGCOLOR,clrGray);
            ObjectSetString(0,PREFIX+"SynchBtn",OBJPROP_TEXT,"Convert & Monitor");
           }
         else if(g_mode==MODE_DRAWING)
           {
            g_mode=MODE_IDLE;
            ObjectSetInteger(0,PREFIX+"DrawBtn",OBJPROP_STATE,false);
            ObjectSetString(0,PREFIX+"DrawBtn",OBJPROP_TEXT,"Draw Fibo");
            ObjectSetInteger(0,PREFIX+"DrawBtn",OBJPROP_BGCOLOR,clrGreen);
           }
         ChartRedraw();
        }
      else if(sparam==PREFIX+"SynchBtn")
        {
         if(g_mode==MODE_SYNC_READY && g_pendingFibo!="")
           {
            ProcessFibonacciObject(g_pendingFibo);
            ObjectDelete(0,g_pendingFibo);
            g_mode=MODE_IDLE;
            g_pendingFibo="";
            ObjectSetInteger(0,PREFIX+"DrawBtn",OBJPROP_BGCOLOR,clrGreen);
            ObjectSetInteger(0,PREFIX+"SynchBtn",OBJPROP_BGCOLOR,clrGray);
            ObjectSetString(0,PREFIX+"SynchBtn",OBJPROP_TEXT,"Convert & Monitor");
            ChartRedraw();
            UpdateClearAllButtonState();
            UpdatePanel();
           }
        }
      else if(sparam==PREFIX+"ClearAllBtn")
        {
         ClearAllMonitoredLines();
        }
     }
   else if(id==CHARTEVENT_OBJECT_CREATE)
     {
      if(g_mode==MODE_DRAWING)
        {
         ENUM_OBJECT objType=(ENUM_OBJECT)ObjectGetInteger(0,sparam,OBJPROP_TYPE);
         if(objType==OBJ_FIBO)
           {
            g_pendingFibo=sparam;
            g_mode=MODE_SYNC_READY;
            ObjectSetInteger(0,sparam,OBJPROP_COLOR,PendingColor);
            ObjectSetInteger(0,PREFIX+"SynchBtn",OBJPROP_BGCOLOR,clrOrange);
            ObjectSetString(0,PREFIX+"SynchBtn",OBJPROP_TEXT,"Convert Ready");
            ObjectSetInteger(0,PREFIX+"DrawBtn",OBJPROP_BGCOLOR,clrGreen);
            ObjectSetString(0,PREFIX+"DrawBtn",OBJPROP_TEXT,"Draw Fibo");
            ChartRedraw();
           }
        }
     }
   else if(id==CHARTEVENT_OBJECT_DELETE)
     {
      string objName=sparam;
      for(int i=0; i<ArraySize(g_monitored); i++)
        {
         if(g_monitored[i].name==objName)
           {
            string labelName=objName+"_label";
            if(ObjectFind(0,labelName)>=0) ObjectDelete(0,labelName);
            for(int j=i; j<ArraySize(g_monitored)-1; j++) g_monitored[j]=g_monitored[j+1];
            ArrayResize(g_monitored,ArraySize(g_monitored)-1);
            UpdateClearAllButtonState();
            UpdatePanel();
            break;
           }
        }
      if(g_pendingFibo==objName)
        {
         g_pendingFibo="";
         g_mode=MODE_IDLE;
         ObjectSetInteger(0,PREFIX+"SynchBtn",OBJPROP_BGCOLOR,clrGray);
         ObjectSetString(0,PREFIX+"SynchBtn",OBJPROP_TEXT,"Convert & Monitor");
         ChartRedraw();
        }
     }
   else if(id==CHARTEVENT_OBJECT_DRAG)
     {
      if(sparam==g_panelBGName)
        {
         long newX=ObjectGetInteger(0,g_panelBGName,OBJPROP_XDISTANCE);
         long newY=ObjectGetInteger(0,g_panelBGName,OBJPROP_YDISTANCE);
         int deltaX=(int)newX-g_panelX;
         int deltaY=(int)newY-g_panelY;
         if(deltaX!=0 || deltaY!=0)
           {
            for(int i=ObjectsTotal(0)-1; i>=0; i--)
              {
               string objName=ObjectName(0,i);
               if(StringFind(objName,PANEL_PREFIX)==0)
                 {
                  long objX=ObjectGetInteger(0,objName,OBJPROP_XDISTANCE);
                  long objY=ObjectGetInteger(0,objName,OBJPROP_YDISTANCE);
                  ObjectSetInteger(0,objName,OBJPROP_XDISTANCE,objX+deltaX);
                  ObjectSetInteger(0,objName,OBJPROP_YDISTANCE,objY+deltaY);
                 }
              }
            g_panelX=(int)newX;
            g_panelY=(int)newY;
            ChartRedraw();
           }
        }
     }
  }
//+------------------------------------------------------------------+
This event-driven mechanism ensures efficiency and precision. Instead of continuously scanning for objects, the system reacts only when relevant events occur. From a trading standpoint, this preserves intentionality. The EA does not interfere with analysis—it simply listens and prepares to act when the trader introduces a Fibonacci structure. The introduction of modes (MODE_IDLE, MODE_DRAWING, MODE_SYNC_READY) ensures that the system operates in a controlled sequence, preventing accidental or unintended monitoring.
Fibonacci Processing and Level Conversion
Once a Fibonacci object is confirmed, it must be transformed into measurable levels.
//+------------------------------------------------------------------+
//| Process Fibonacci object and convert levels                      |
//+------------------------------------------------------------------+
void ProcessFibonacciObject(string fiboName)
  {
   double price1 = ObjectGetDouble(0,fiboName,OBJPROP_PRICE,0);
   double price2 = ObjectGetDouble(0,fiboName,OBJPROP_PRICE,1);

   int levels = (int)ObjectGetInteger(0,fiboName,OBJPROP_LEVELS);

   for(int i=0; i<levels; i++)
     {
      double ratio = ObjectGetDouble(0,fiboName,OBJPROP_LEVELVALUE,i);
      double levelPrice = price1 + (price2 - price1) * ratio;

      string lineName = "FiboLevel_" + IntegerToString(i);

      ObjectCreate(0,lineName,OBJ_HLINE,0,0,levelPrice);

      AddMonitoredLevel(lineName,ratio,DoubleToString(ratio*100,1)+"%");
     }
  }
//+------------------------------------------------------------------+
This step converts visual input into numerical precision while respecting the trader’s chosen mapping preferences. Each level is converted into a horizontal line, ensuring that it remains consistent regardless of time progression. This is crucial because diagonal objects (like the original Fibonacci tool) are more complex to evaluate dynamically. By isolating each level, the system simplifies monitoring while preserving analytical meaning.
Continuous Monitoring Engine (OnTick Execution)
The monitoring process operates continuously through the OnTick() function.
//+------------------------------------------------------------------+
//| OnTick event handler                                             |
//+------------------------------------------------------------------+
void OnTick()
  {
   CheckPriceInteractions();
  }
//+------------------------------------------------------------------+
Every market tick triggers evaluation. This ensures that no interaction—whether rapid spike, gradual approach, or sudden breakout—is missed.
Advanced Price Interaction Evaluation
The CheckPriceInteractions() function implements a complete state machine with approach detection, per-tick touch detection, breakout tracking, and reversal logic after a touch. It also supports instrument-specific scaling via PipMultiplier.
//+------------------------------------------------------------------+
//| Check price interactions with monitored levels                   |
//+------------------------------------------------------------------+
void CheckPriceInteractions()
  {
   double bid = SymbolInfoDouble(_Symbol,SYMBOL_BID);

   for(int i=0; i<ArraySize(g_monitored); i++)
     {
      double levelPrice = ObjectGetDouble(0,g_monitored[i].name,OBJPROP_PRICE);
      double distance   = MathAbs(bid-levelPrice);

      // Approach zone
      if(distance <= ApproachZonePips * _Point && g_monitored[i].alertState==ALERT_NONE)
        {
         SendNotification("Approaching level",levelPrice);
         g_monitored[i].alertState=ALERT_APPROACH_SENT;
        }

      // Touch
      if(distance <= TouchTolerancePips * _Point && g_monitored[i].alertState!=ALERT_TOUCH_SENT)
        {
         SendNotification("Touch detected",levelPrice);
         g_monitored[i].alertState=ALERT_TOUCH_SENT;
         g_monitored[i].lastTouchBarTime=TimeCurrent();
        }

      // Breakout / Reversal logic (simplified – full version in attached file)
      if(bid > levelPrice && !g_monitored[i].alertedBreak)
        {
         SendNotification("Breakout above",levelPrice);
         g_monitored[i].alertedBreak=true;
        }
      if(bid < levelPrice && !g_monitored[i].alertedBreak)
        {
         SendNotification("Breakout below",levelPrice);
         g_monitored[i].alertedBreak=true;
        }
     }
  }
//+------------------------------------------------------------------+
This is where raw data becomes insight. The system does not just detect position—it interprets behavior. By classifying interactions into approach, touch, and breakout, the EA mirrors how price action is analyzed manually. This ensures that the output remains intuitive and aligned with trading logic.
Alert and Notification System
//+------------------------------------------------------------------+
//| Send alert notification                                          |
//+------------------------------------------------------------------+
void SendNotification(string msg,double price)
  {
   string fullMsg = StringFormat("%s at %G",msg,price);

   if(AlertPopup) Alert(fullMsg);
   if(AlertSound) PlaySound(SoundFile);

   Print(fullMsg);
  }
//+------------------------------------------------------------------+
Alerts transform monitoring into actionable awareness. Instead of watching charts continuously, the trader receives immediate notification when something meaningful occurs. This significantly reduces cognitive load while maintaining responsiveness.
Visual Monitoring Panel
//+------------------------------------------------------------------+
//| Update visual monitoring panel                                   |
//+------------------------------------------------------------------+
void UpdatePanel()
  {
   string text = "Fibonacci Monitor\n";

   for(int i=0; i<ArraySize(g_monitored); i++)
     {
      text += g_monitored[i].levelLabel + " : " +
              IntegerToString(g_monitored[i].alertState) + "\n";
     }

   ObjectCreate(0,"Panel",OBJ_LABEL,0,0,0);
   ObjectSetString(0,"Panel",OBJPROP_TEXT,text);
  }
//+------------------------------------------------------------------+
The panel consolidates system state into a readable format. Instead of visually scanning multiple levels, the trader sees a structured summary of interactions.
Lifecycle Management and Cleanup
This ensures that the system remains aligned with current analysis, preventing outdated levels from affecting decisions.
//+------------------------------------------------------------------+
//| Clear all monitored lines                                        |
//+------------------------------------------------------------------+
void ClearAllMonitoredLines()
  {
   for(int i=ArraySize(g_monitored)-1; i>=0; i--)
     {
      ObjectDelete(0,g_monitored[i].name);
     }
   ArrayResize(g_monitored,0);
  }
//+------------------------------------------------------------------+
The completed implementation creates a structured relationship between manual analysis and automated monitoring. The trader defines the analytical framework, and the system ensures that every interaction with that framework is captured, interpreted, and communicated. This turns Fibonacci retracement into a continuously monitored decision-support tool. It reduces the gap between observation and execution.
Testing and System Interaction
To evaluate the behavior of the monitoring system, the Expert Advisor was deployed on a live chart environment where manually drawn Fibonacci structures could be introduced and observed under real market conditions. The purpose of this stage is to verify that the system correctly detects user-defined inputs, converts them into monitored levels, and responds consistently to price interactions over time.

Figure 3: EA interface
The testing process is supported by three primary interface controls, each governing a specific stage of the workflow:
- Draw Fibo — Activates detection mode, allowing the system to recognize a newly drawn Fibonacci object. This ensures that only intentional, manually placed structures are tracked.
- Convert & Monitor — turns the detected Fibonacci retracement into individual horizontal levels and registers them for active monitoring. This step guarantees that all levels are continuously evaluated as price evolves.
- Clear All Levels — Removes all monitored levels from the chart and resets the internal tracking structure, providing a clean state for subsequent tests or new analyses.
The workflow is sequential: draw the Fibonacci retracement, let the EA detect it, then convert it into monitored levels. This setup creates a controlled environment for observing how the system reacts to different forms of price behavior across monitored levels, including rapid price movements, overlapping levels, and partial touches.
The system provides real-time feedback, including chart updates, alert notifications, and logging of price interactions with each level. This ensures transparency and allows verification of the system’s responsiveness under live market conditions.
Live Test: Step Index M1 – Fibonacci Monitoring
Below is the test I performed on the Step Index (M1) to verify the integration of manual Fibonacci drawing with automated EA monitoring:
1. Draw Fibo Button
- Pressed the Draw Fibo button.
- Function executed successfully.
2. Manual Fibonacci Drawing
- Navigated to Insert → Objects → Fibonacci Retracement.
- Drew Fibonacci retracement manually on the chart.
3. Synchronization
- Pressed the Convert & Monitor button.
- The system detected the drawn Fibonacci and began continuous monitoring.
4. Monitoring and Alerts
- As price approached and touched a Fibonacci level:
- An alert was triggered.
- The chart was updated to reflect the condition in real-time.
Figure 4: Real-time monitoring on Step Index M1
The testing confirms that the system effectively bridges manual analysis with automated monitoring. Manually drawn Fibonacci retracements are accurately detected, converted into monitored levels, and continuously evaluated as price evolves. Alerts and chart updates occur reliably, preserving the analytical intent of the trader while eliminating the need for constant observation.
Conclusion
This approach provides a functional link between manual Fibonacci analysis and automated tracking. Traders retain full control over defining market structure via their own drawings, while the Expert Advisor handles continuous monitoring and event reporting.
By following the steps in this article, you will create a fully operational MT5 Expert Advisor template that offers:
- Recognition of newly created OBJ_FIBO objects through chart events.
- Selective synchronization, ensuring only chosen Fibonacci drawings are actively monitored.
- Extraction of all retracement levels and their conversion into persistent horizontal lines.
- Individual storage of each level with full state management and lifecycle tracking.
- Real-time assessment of price behavior—including approach, touch, breakout, or reversal—using customizable tolerance and approach zones.
- Multi-channel notifications and a draggable on-chart panel displaying the live status of all monitored levels.
The system focuses exclusively on synchronized Fibonacci objects, uses user-defined tolerance to minimize noise, and evaluates interactions based on the Bid price. The result is a reliable, testable Expert Advisor that preserves manual drawing discretion while automatically alerting you to every critical market interaction.
Warning: All rights to these materials are reserved by MetaQuotes Ltd. Copying or reprinting of these materials in whole or in part is prohibited.
This article was written by a user of the site and reflects their personal views. MetaQuotes Ltd is not responsible for the accuracy of the information presented, nor for any consequences resulting from the use of the solutions, strategies or recommendations described.

- Free trading apps
- Over 8,000 signals for copying
- Economic news for exploring financial markets
You agree to website policy and terms of use