
Developing Market Memory Zones Indicator: Where Price Is Likely To Return

Table of contents:
Introduction
Many traders struggle with identifying meaningful price levels that truly matter to the market. Traditional support and resistance lines, lagging indicators, and subjective zone drawing often lead to cluttered charts and conflicting signals. As a result, traders are frequently left reacting late to price movements, entering trades in low-probability areas, or misinterpreting market noise as valid structure. This dilemma creates inconsistency, overtrading, and a lack of confidence in decision-making.
The Market Memory Zones approach addresses this problem by focusing on how the market actually moves and leaves footprints behind. Instead of relying on arbitrary levels, the indicator objectively identifies zones formed by strong displacement, structural transitions, and liquidity events where price moved with intent. These zones represent areas the market is statistically inclined to revisit, allowing traders to anticipate reactions rather than chase price, leading to cleaner analysis, better timing, and more disciplined trade execution.
Indicator Overview: Market Memory Zones
Displacement Zones focus on identifying areas where price moved with strong intent and urgency. These zones are formed by large impulsive candles whose range is significantly greater than the average for that period, often exceeding a multiple of the ATR. To ensure the move represents genuine displacement rather than normal volatility, the candle should show minimal overlap with surrounding candles, meaning most of its range exists outside the prior candle’s range. This combination of expanded range and low overlap highlights areas where price moved too quickly, leaving behind unfilled activity that the market may later revisit.

Structure Transition Zones are created at key moments when the market shifts its behavior, commonly referred to as a Change of Character (CHoCH). These zones form at the point where a prior market structure is broken, such as when a swing high is taken out in a downtrend or a swing low is broken in an uptrend. The area surrounding this structural break often becomes significant because it represents a transition in control between buyers and sellers, making it a potential zone where price may return to reassess that shift.
![]()
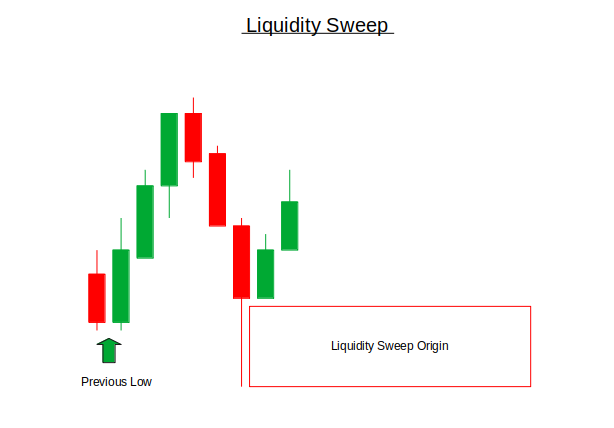
Liquidity Sweep Origin Zones are based on the idea that the market often targets obvious highs and lows to collect liquidity before reversing. These zones are identified by candles that sweep above a previous high or below a previous low and are immediately followed by a reversal in price direction. The range of the candle that initiated the liquidity sweep is marked as the zone, as it frequently represents the origin of the move where smart participation entered the market, increasing the likelihood of future reactions when price revisits that area.
Getting Started
//+------------------------------------------------------------------+
//|                                            MarketMemoryZones.mq5 |
//|                        GIT under Copyright 2025, MetaQuotes Ltd. |
//|                     https://www.mql5.com/en/users/johnhlomohang/ |
//+------------------------------------------------------------------+
#property copyright "GIT under Copyright 2025, MetaQuotes Ltd."
#property link      "https://www.mql5.com/en/users/johnhlomohang/"
#property version   "1.00"
#property indicator_chart_window
#property indicator_chart_window
#property indicator_buffers 0
#property indicator_plots   0

//+------------------------------------------------------------------+
//| Input Parameters                                                 |
//+------------------------------------------------------------------+
input ENUM_TIMEFRAMES AnalysisTF = PERIOD_CURRENT;  // Analysis Timeframe
input int             LookbackBars = 200;           // Bars to analyze
input double          MinCandleSizeATR = 1.5;       // Min candle size (ATR multiplier)
input bool            ShowDisplacementZones = true; // Show displacement zones
input bool            ShowUnfilledAreas = true;     // Show unfilled price areas
input bool            ShowStructureZones = true;    // Show structure transition zones
input bool            ShowLiquidityZones = true;    // Show liquidity sweep origins
input bool            FilterByVolume = false;       // Require volume spike
input int             MaxActiveZones = 15;          // Max zones to show
input bool            ExtendZonesForward = true;    // Extend zones forward
input int             ZoneOpacity = 20;             // Zone opacity (0-100)
Getting started, in this section of the code, we define the core setup and configuration options for the Market Memory Zones indicator. We will design the indicator to run directly in the chart window without using indicator buffers or plots, as it relies entirely on graphical objects such as rectangles to visualize zones. The input parameters give the user full control over how the analysis is performed, including the timeframe used for detection, the number of historical bars analyzed, and the minimum candle size required to qualify as meaningful displacement using an ATR multiplier.
Additional toggles allow traders to enable or disable specific zone types such as displacement, unfilled price areas, structure transitions, and liquidity sweep origins, while optional volume filtering can be applied to improve signal quality. Risk of chart clutter is managed through limits on the maximum number of active zones, opacity settings, and the ability to extend zones forward in time, ensuring the indicator remains both flexible and visually clean.
//+------------------------------------------------------------------+
//| Zone Types                                                       |
//+------------------------------------------------------------------+
enum ZONE_TYPE
{
   ZONE_DISPLACEMENT,     // Large impulsive candles
   ZONE_UNFILLED,         // Price inefficiency gaps
   ZONE_STRUCTURE,        // Structure transition
   ZONE_LIQUIDITY         // Liquidity sweep origin
};

//+------------------------------------------------------------------+
//| Zone Structure                                                   |
//+------------------------------------------------------------------+
struct MemoryZone
{
   datetime          startTime;
   datetime          endTime;
   double            high;
   double            low;
   ZONE_TYPE         type;
   color             zoneColor;
   bool              isActive;
   int               creationBar;
   double            strength;      // 0-1 strength rating

   void Reset()
   {
      startTime = 0;
      endTime = 0;
      high = 0.0;
      low = 0.0;
      type = ZONE_DISPLACEMENT;
      zoneColor = clrNONE;
      isActive = false;
      creationBar = 0;
      strength = 0.5;
   }

   bool IsPriceInZone(double price)
   {
      return price >= low && price <= high;
   }

   double GetZoneMiddle()
   {
      return (high + low) / 2.0;
   }

   bool IsZoneMitigated(double currentHigh, double currentLow)
   {
      // Zone is considered mitigated if price has traded through entire zone
      return (currentLow <= low && currentHigh >= high);
   }
};

//+------------------------------------------------------------------+
//| Global Variables                                                 |
//+------------------------------------------------------------------+
MemoryZone zones[];
int zoneCount = 0;
double atrBuffer[];
datetime lastProcessedBar = 0;
string indicatorName;
double currentAtrValue = 0.0;

// Colors for different zone types
color displacementColor = C'0,100,255';    // Blue
color unfilledColor = C'255,128,0';        // Orange
color structureColor = C'128,0,255';       // Purple
color liquidityColor = C'255,50,50';       // Red
This section of the code defines the different zone classifications used by the Market Memory Zones indicator. The ZONE_TYPE enumeration provides a clear and structured way to label each zone according to its origin, including displacement zones formed by impulsive candles, unfilled price inefficiencies, structure transition zones, and liquidity sweep origins. Using an enum improves code readability and ensures that each zone is consistently identified, processed, and visualized based on its specific behavioral meaning in the market.
The MemoryZone structure acts as the core data container for each detected zone. It stores essential information such as the time boundaries, price range, zone type, visual color, creation bar, and an optional strength score that can be used to rank or filter zones. Utility functions within the structure simplify zone management by allowing quick checks to determine whether the current price is inside a zone, calculate the midpoint of the zone, or confirm whether the zone has been fully mitigated by price trading through its entire range. The Reset method ensures that zone data can be safely reused or cleared without leaving residual values.
The global variables manage the overall state of the indicator during runtime. The dynamic zones array stores all active and historical zones, while counters and buffers track the number of zones, ATR values, and the last processed bar to avoid redundant calculations. Additional variables handle indicator naming and current ATR readings, which are used in zone validation logic. Color definitions at the end ensure that each zone type is visually distinct on the chart, allowing traders to quickly recognize the nature of a zone at a glance.
//+------------------------------------------------------------------+
//| Custom indicator initialization function                         |
//+------------------------------------------------------------------+
int OnInit()
{
   indicatorName = "MMZ_" + IntegerToString(GetTickCount());

   // Set indicator properties
   IndicatorSetString(INDICATOR_SHORTNAME, "Market Memory Zones");
   IndicatorSetInteger(INDICATOR_DIGITS, _Digits);

   // Initialize ATR buffer
   ArrayResize(atrBuffer, LookbackBars);
   ArrayInitialize(atrBuffer, 0.0);

   // Initialize zones array
   ArrayResize(zones, MaxActiveZones * 2); // Double for safety
   for(int i = 0; i < ArraySize(zones); i++)
      zones[i].Reset();

   // Calculate initial ATR
   currentAtrValue = iATR(_Symbol, AnalysisTF, 14);

   return INIT_SUCCEEDED;
}

//+------------------------------------------------------------------+
//| Custom indicator deinitialization function                       |
//+------------------------------------------------------------------+
void OnDeinit(const int reason)
{
   // Clean up all zone objects
   ObjectsDeleteAll(0, "MMZ_");
   ChartRedraw();
}

//+------------------------------------------------------------------+
//| Custom indicator iteration function                              |
//+------------------------------------------------------------------+
int OnCalculate(const int rates_total,
                const int prev_calculated,
                const datetime &time[],
                const double &open[],
                const double &high[],
                const double &low[],
                const double &close[],
                const long &tick_volume[],
                const long &volume[],
                const int &spread[])
{
   // Check if we have enough bars
   if(rates_total < LookbackBars) return 0;

   // Process only on new bar
   if(prev_calculated > 0 && prev_calculated == rates_total)
      return rates_total;

   // Set array as series
   ArraySetAsSeries(time, true);
   ArraySetAsSeries(open, true);
   ArraySetAsSeries(high, true);
   ArraySetAsSeries(low, true);
   ArraySetAsSeries(close, true);
   ArraySetAsSeries(tick_volume, true);

   // Update ATR value
   currentAtrValue = iATR(_Symbol, AnalysisTF, 14);

   // Detect zones starting from the most recent data
   DetectMemoryZones(rates_total, time, open, high, low, close, tick_volume);

   // Update and draw zones
   UpdateZones(rates_total, time, high[0], low[0]);

   return rates_total;
}
This section of the code handles the lifecycle management of the Market Memory Zones indicator, beginning with the OnInit() function. During initialization, a unique indicator name is generated to prevent object conflicts, and key indicator properties such as the display name and price precision are set. The ATR buffer and zones array are then allocated and initialized, ensuring clean memory usage before any calculations begin. Each zone structure is reset to a default state, and an initial ATR value is calculated based on the selected analysis timeframe, which will later be used to validate displacement and zone strength.
The OnDeinit() and OnCalculate() functions manage cleanup and real-time execution. When the indicator is removed, all graphical zone objects associated with the indicator are deleted to keep the chart clean. During each calculation cycle, the code ensures sufficient historical data is available and processes logic only on the formation of a new bar to improve performance. Price arrays are configured in series mode for easier access to recent data, the ATR value is refreshed, and the core detection and update routines are executed to identify new market memory zones and manage existing ones, keeping the chart synchronized with current market behavior.
//+------------------------------------------------------------------+
//| Detect All Memory Zones                                          |
//+------------------------------------------------------------------+
void DetectMemoryZones(int rates_total, const datetime &time[], const double &open[],
                      const double &high[], const double &low[], const double &close[],
                      const long &tick_volume[])
{
   // Clear old zones
   for(int i = 0; i < zoneCount; i++)
      zones[i].Reset();
   zoneCount = 0;

   // Calculate average volume for volume filter
   double avgVolume = CalculateAverageVolume(tick_volume, rates_total, 20);

   // Start from older bars to newer (but leave room for analysis)
   int startBar = MathMin(LookbackBars, rates_total - 10);

   for(int i = startBar; i >= 3; i--)  // Start from 3 to have previous bars for context
   {
      // 1. Check for Displacement Zones
      if(ShowDisplacementZones && zoneCount < MaxActiveZones)
      {
         if(IsDisplacementCandle(i, high, low, open, close, tick_volume, avgVolume))
         {
            AddDisplacementZone(i, time, high, low, open, close);
         }
      }

      // 2. Check for Unfilled Price Areas
      if(ShowUnfilledAreas && zoneCount < MaxActiveZones)
      {
         if(IsUnfilledArea(i, high, low, open, close))
         {
            AddUnfilledZone(i, time, high, low, open, close);
         }
      }

      // 3. Check for Structure Transition Zones
      if(ShowStructureZones && zoneCount < MaxActiveZones && i > 5)
      {
         if(IsStructureTransition(i, high, low))
         {
            AddStructureZone(i, time, high, low);
         }
      }

      // 4. Check for Liquidity Sweep Origins
      if(ShowLiquidityZones && zoneCount < MaxActiveZones && i > 1)
      {
         if(IsLiquiditySweep(i, high, low, close, open))
         {
            AddLiquidityZone(i, time, high, low, close);
         }
      }

      // Break if we reached max zones
      if(zoneCount >= MaxActiveZones) break;
   }
}

//+------------------------------------------------------------------+
//| Check for Displacement Candle                                    |
//+------------------------------------------------------------------+
bool IsDisplacementCandle(int bar, const double &high[], const double &low[],
                         const double &open[], const double &close[],
                         const long &tick_volume[], double avgVolume)
{
   // 1. Check minimum candle size (ATR-based)
   double candleSize = high[bar] - low[bar];
   double minSize = currentAtrValue * MinCandleSizeATR;

   if(candleSize < minSize) return false;

   // 2. Check for minimal overlap with prior candle
   double overlapWithPrev = CalculateOverlap(high[bar], low[bar], high[bar+1], low[bar+1]);
   if(overlapWithPrev > 0.3) return false; // More than 30% overlap

   // 3. Check for minimal overlap with next candle
   if(bar > 0)
   {
      double overlapWithNext = CalculateOverlap(high[bar], low[bar], high[bar-1], low[bar-1]);
      if(overlapWithNext > 0.3) return false;
   }

   // 4. Volume spike confirmation (optional)
   if(FilterByVolume)
   {
      double volumeRatio = (double)tick_volume[bar] / avgVolume;
      if(volumeRatio < 1.5) return false; // Less than 150% of average
   }

   // 5. Check if it's an impulsive candle (strong directional move)
   bool isBullishImpulse = (close[bar] > open[bar]) && ((close[bar] - open[bar]) > candleSize * 0.6);
   bool isBearishImpulse = (close[bar] < open[bar]) && ((open[bar] - close[bar]) > candleSize * 0.6);

   return (isBullishImpulse || isBearishImpulse);
}

//+------------------------------------------------------------------+
//| Check for Unfilled Price Area                                    |
//+------------------------------------------------------------------+
bool IsUnfilledArea(int bar, const double &high[], const double &low[],
                   const double &open[], const double &close[])
{
   // Look for Fair Value Gap pattern (3-candle formation)
   if(bar < 2) return false;

   // Pattern: Middle candle has range not overlapped by candles before and after
   // Bullish FVG
   if(low[bar-1] > high[bar] && low[bar-2] > high[bar])
   {
      return true;
   }

   // Bearish FVG
   if(high[bar-1] < low[bar] && high[bar-2] < low[bar])
   {
      return true;
   }

   // Alternative: Large candle followed by small overlapping candles
   double candle1Size = high[bar] - low[bar];
   double candle2Size = high[bar-1] - low[bar-1];

   if(candle1Size > currentAtrValue && candle2Size < currentAtrValue * 0.5)
   {
      // Check if candle2 didn't fill much of candle1's range
      double fillRatio = CalculateOverlap(high[bar], low[bar], high[bar-1], low[bar-1]);
      if(fillRatio < 0.3) return true;
   }

   return false;
}

//+------------------------------------------------------------------+
//| Check for Structure Transition                                   |
//+------------------------------------------------------------------+
bool IsStructureTransition(int bar, const double &high[], const double &low[])
{
   // Need at least 5 bars to determine structure
   if(bar < 5) return false;

   // Detect swing points
   bool isSwingHigh = IsSwingHigh(bar, high, 3);
   bool isSwingLow = IsSwingLow(bar, low, 3);

   if(!isSwingHigh && !isSwingLow) return false;

   // Check for structure break
   if(isSwingHigh)
   {
      // Check if breaking previous structure (Higher High to Lower High)
      double prevSwingHigh = FindPrevSwingHigh(bar, high, 3);
      if(prevSwingHigh > 0 && high[bar] < prevSwingHigh)
      {
         return true; // Lower High formed
      }
   }

   if(isSwingLow)
   {
      // Check if breaking previous structure (Lower Low to Higher Low)
      double prevSwingLow = FindPrevSwingLow(bar, low, 3);
      if(prevSwingLow > 0 && low[bar] > prevSwingLow)
      {
         return true; // Higher Low formed
      }
   }

   return false;
}

//+------------------------------------------------------------------+
//| Check for Liquidity Sweep                                        |
//+------------------------------------------------------------------+
bool IsLiquiditySweep(int bar, const double &high[], const double &low[], const double &close[], const double &open[])
{


   if(bar < 2) return false;

   // Bullish liquidity sweep: Sweeps previous low then closes above
   if(low[bar] < low[bar+1] && close[bar] > low[bar+1] && close[bar] > close[bar+1])
   {
      // Check for reversal pattern
      if(close[bar] > open[bar] && (close[bar] - open[bar]) > (high[bar] - low[bar]) * 0.5)
      {
         return true;
      }
   }

   // Bearish liquidity sweep: Sweeps previous high then closes below
   if(high[bar] > high[bar+1] && close[bar] < high[bar+1] && close[bar] < close[bar+1])
   {
      // Check for reversal pattern
      if(close[bar] < open[bar] && (open[bar] - close[bar]) > (high[bar] - low[bar]) * 0.5)
      {
         return true;
      }
   }

   return false;
}
This section of the code is responsible for detecting all Market Memory Zones by scanning historical price data and classifying meaningful areas based on different market behaviors. The DetectMemoryZones function begins by clearing previously stored zones to ensure a fresh analysis on each calculation cycle. It then computes the average volume, which is later used as an optional filter to validate high-participation moves. The function iterates from older bars toward more recent ones within the defined lookback range, allowing the indicator to analyze price action in proper chronological context while maintaining performance limits through a maximum zone cap.
Displacement zones are identified first, as they represent strong, intentional market moves. The IsDisplacementCandle function applies multiple layers of validation, including ATR-based candle size, minimal overlap with neighboring candles, optional volume spike confirmation, and strong directional body dominance. These conditions ensure that only true impulsive moves are considered, filtering out normal volatility and low-quality signals. When all criteria are met, the candle’s price range is captured as a displacement zone, reflecting areas where price moved too aggressively to fully trade.
Unfilled price areas are detected next through the IsUnfilledArea function, which focuses on inefficiencies such as Fair Value Gaps and rapid expansions followed by weak retracements. The logic looks for three-candle formations where the middle candle’s range is not overlapped by surrounding candles, as well as scenarios where a large candle is followed by a much smaller one that fails to retrace the move meaningfully. These patterns highlight zones where price imbalance occurred, increasing the likelihood that the market may later return to rebalance that area.
The code then identifies structure transition zones and liquidity sweep origins, which capture changes in market behavior and manipulation-driven moves. The IsStructureTransition function uses swing-point analysis to detect shifts such as lower highs or higher lows that signal a change of character. The IsLiquiditySweep function focuses on candles that take out previous highs or lows and then strongly reverse, indicating stop runs and smart participation. Together, these detection methods allow the indicator to map zones rooted in structure, liquidity, and intent, forming a comprehensive framework for identifying where price is likely to return.
//+------------------------------------------------------------------+
//| Add Displacement Zone                                            |
//+------------------------------------------------------------------+
void AddDisplacementZone(int bar, const datetime &time[], const double &high[],
                        const double &low[], const double &open[], const double &close[])
{
   if(zoneCount >= MaxActiveZones) return;

   zones[zoneCount].startTime = time[bar];
   zones[zoneCount].endTime = ExtendZonesForward ? TimeCurrent() + PeriodSeconds(_Period) * 100 : time[bar];
   zones[zoneCount].high = high[bar];
   zones[zoneCount].low = low[bar];
   zones[zoneCount].type = ZONE_DISPLACEMENT;
   zones[zoneCount].zoneColor = displacementColor;
   zones[zoneCount].isActive = true;
   zones[zoneCount].creationBar = bar;

   // Calculate strength based on candle size relative to ATR
   double candleSize = high[bar] - low[bar];
   zones[zoneCount].strength = MathMin(candleSize / (currentAtrValue * 2), 1.0);

   // Adjust zone boundaries for better visualization
   double range = zones[zoneCount].high - zones[zoneCount].low;
   zones[zoneCount].high += range * 0.05;  // Add 5% padding
   zones[zoneCount].low -= range * 0.05;

   zoneCount++;
}

//+------------------------------------------------------------------+
//| Add Unfilled Zone                                                |
//+------------------------------------------------------------------+
void AddUnfilledZone(int bar, const datetime &time[], const double &high[],
                    const double &low[], const double &open[], const double &close[])
{
   if(zoneCount >= MaxActiveZones) return;

   // For FVG pattern (3-candle)
   if(bar >= 2)
   {
      // Bullish FVG
      if(low[bar-1] > high[bar] && low[bar-2] > high[bar])
      {
         zones[zoneCount].startTime = time[bar];
         zones[zoneCount].endTime = ExtendZonesForward ? TimeCurrent() + PeriodSeconds(_Period) * 100 : time[bar-1];
         zones[zoneCount].high = MathMax(high[bar-1], high[bar-2]);
         zones[zoneCount].low = low[bar];
      }
      // Bearish FVG
      else if(high[bar-1] < low[bar] && high[bar-2] < low[bar])
      {
         zones[zoneCount].startTime = time[bar];
         zones[zoneCount].endTime = ExtendZonesForward ? TimeCurrent() + PeriodSeconds(_Period) * 100 : time[bar-1];
         zones[zoneCount].high = high[bar];
         zones[zoneCount].low = MathMin(low[bar-1], low[bar-2]);
      }

      zones[zoneCount].type = ZONE_UNFILLED;
      zones[zoneCount].zoneColor = unfilledColor;
      zones[zoneCount].isActive = true;
      zones[zoneCount].creationBar = bar;
      zones[zoneCount].strength = 0.7;

      zoneCount++;
   }
}

//+------------------------------------------------------------------+
//| Add Structure Zone                                               |
//+------------------------------------------------------------------+
void AddStructureZone(int bar, const datetime &time[], const double &high[], const double &low[])
{
   if(zoneCount >= MaxActiveZones) return;

   zones[zoneCount].startTime = time[bar];
   zones[zoneCount].endTime = ExtendZonesForward ? TimeCurrent() + PeriodSeconds(_Period) * 100 : time[bar];

   if(IsSwingHigh(bar, high, 3))
   {
      zones[zoneCount].high = high[bar];
      zones[zoneCount].low = high[bar] - (high[bar] - low[bar]) * 0.5; // 50% of candle range
   }
   else if(IsSwingLow(bar, low, 3))
   {
      zones[zoneCount].low = low[bar];
      zones[zoneCount].high = low[bar] + (high[bar] - low[bar]) * 0.5; // 50% of candle range
   }

   zones[zoneCount].type = ZONE_STRUCTURE;
   zones[zoneCount].zoneColor = structureColor;
   zones[zoneCount].isActive = true;
   zones[zoneCount].creationBar = bar;
   zones[zoneCount].strength = 0.8;

   zoneCount++;
}

//+------------------------------------------------------------------+
//| Add Liquidity Zone                                               |
//+------------------------------------------------------------------+
void AddLiquidityZone(int bar, const datetime &time[], const double &high[],
                     const double &low[], const double &close[])
{
   if(zoneCount >= MaxActiveZones) return;

   zones[zoneCount].startTime = time[bar];
   zones[zoneCount].endTime = ExtendZonesForward ? TimeCurrent() + PeriodSeconds(_Period) * 100 : time[bar];

   // Determine sweep direction
   if(low[bar] < low[bar+1]) // Bullish sweep
   {
      zones[zoneCount].high = high[bar];
      zones[zoneCount].low = low[bar+1]; // The level that was swept
   }
   else if(high[bar] > high[bar+1]) // Bearish sweep
   {
      zones[zoneCount].high = high[bar+1]; // The level that was swept
      zones[zoneCount].low = low[bar];
   }

   zones[zoneCount].type = ZONE_LIQUIDITY;
   zones[zoneCount].zoneColor = liquidityColor;
   zones[zoneCount].isActive = true;
   zones[zoneCount].creationBar = bar;
   zones[zoneCount].strength = 0.9; // Liquidity sweeps are high probability

   zoneCount++;
}

//+------------------------------------------------------------------+
//| Update and Draw Zones                                            |
//+------------------------------------------------------------------+
void UpdateZones(int rates_total, const datetime &time[], double currentHigh, double currentLow)
{
   // First, remove all old objects
   ObjectsDeleteAll(0, "MMZ_");

   // Draw active zones
   for(int i = 0; i < zoneCount; i++)
   {
      if(!zones[i].isActive) continue;

      // Check if zone is still valid (not fully mitigated)
      if(zones[i].IsZoneMitigated(currentHigh, currentLow))
      {
         zones[i].isActive = false;
         continue;
      }

      // Draw zone as rectangle
      DrawZone(zones[i], i);
   }

   // Draw legend
   DrawLegend();
}
Here the code focuses on creating and managing the different Market Memory Zones once they have been detected. Each Add*Zone function is responsible for initializing a specific zone type and storing it in the shared zones array, while respecting the maximum active zone limit to prevent chart clutter. Common properties such as start and end time, price boundaries, zone type, color, activation state, and creation bar are assigned consistently, ensuring all zones follow the same internal structure and can be processed uniformly later on.
Displacement and unfilled zones are constructed using price action characteristics unique to their behavior. Displacement zones capture the full range of an impulsive candle and calculate a strength score based on how large the candle is relative to the current ATR, with slight padding added to improve visual clarity on the chart. Unfilled zones, on the other hand, are derived from Fair Value Gap formations or rapid expansions, with their boundaries defined by the imbalance left between multiple candles. These zones are given a moderate strength rating to reflect their tendency to attract price for rebalancing rather than immediate reaction.
Structure and liquidity zones emphasize intent and probability. Structure zones are created around swing highs or swing lows where a change in market behavior has occurred, using a portion of the candle’s range to define a precise reaction area. Liquidity zones mark the origin of stop runs by capturing the range around the swept level and assigning a higher strength score due to their strong historical reaction tendency. The UpdateZones function then refreshes the chart by removing outdated objects, deactivating zones that have been fully mitigated, and redrawing only valid zones, keeping the visual output clean, relevant, and aligned with current price action.
//+------------------------------------------------------------------+
//| Draw Zone as Rectangle                                           |
//+------------------------------------------------------------------+
void DrawZone(MemoryZone &zone, int index)
{
   string objName = StringFormat("MMZ_%s_%d_%d", EnumToString(zone.type), (int)zone.startTime, index);

   // Create rectangle
   if(ObjectCreate(0, objName, OBJ_RECTANGLE, 0, zone.startTime, zone.high, zone.endTime, zone.low))
   {
      // Set properties
      ObjectSetInteger(0, objName, OBJPROP_COLOR, zone.zoneColor);
      ObjectSetInteger(0, objName, OBJPROP_BACK, true);
      ObjectSetInteger(0, objName, OBJPROP_FILL, true);
      ObjectSetInteger(0, objName, OBJPROP_WIDTH, 1);

      // Set opacity based on strength and input
      int alpha = (int)(zone.strength * ZoneOpacity);
      alpha = MathMax(alpha, 10);
      alpha = MathMin(alpha, 80);

      color zoneColorWithAlpha = ColorToARGB(zone.zoneColor, alpha);
      ObjectSetInteger(0, objName, OBJPROP_COLOR, zoneColorWithAlpha);

      // Add tooltip
      string tooltip = StringFormat("MMZ Type: %s\nStrength: %.1f\nRange: %.5f - %.5f",
                                    GetZoneTypeName(zone.type),
                                    zone.strength,
                                    zone.low,
                                    zone.high);
      ObjectSetString(0, objName, OBJPROP_TOOLTIP, tooltip);
   }
}

//+------------------------------------------------------------------+
//| Draw Legend                                                      |
//+------------------------------------------------------------------+
void DrawLegend()
{
   int yPos = 20;
   int xPos = 20;

   if(ShowDisplacementZones)
   {
      CreateLabel("Legend_Displacement", "• Displacement Zones", xPos, yPos, displacementColor);
      yPos += 20;
   }

   if(ShowUnfilledAreas)
   {
      CreateLabel("Legend_Unfilled", "• Unfilled Areas", xPos, yPos, unfilledColor);
      yPos += 20;
   }

   if(ShowStructureZones)
   {
      CreateLabel("Legend_Structure", "• Structure Transitions", xPos, yPos, structureColor);
      yPos += 20;
   }

   if(ShowLiquidityZones)
   {
      CreateLabel("Legend_Liquidity", "• Liquidity Sweeps", xPos, yPos, liquidityColor);
      yPos += 20;
   }
}

void CreateLabel(string name, string text, int x, int y, color clr)
{
   ObjectCreate(0, "MMZ_" + name, OBJ_LABEL, 0, 0, 0);
   ObjectSetString(0, "MMZ_" + name, OBJPROP_TEXT, text);
   ObjectSetInteger(0, "MMZ_" + name, OBJPROP_XDISTANCE, x);
   ObjectSetInteger(0, "MMZ_" + name, OBJPROP_YDISTANCE, y);
   ObjectSetInteger(0, "MMZ_" + name, OBJPROP_COLOR, clr);
   ObjectSetInteger(0, "MMZ_" + name, OBJPROP_FONTSIZE, 10);
   ObjectSetString(0, "MMZ_" + name, OBJPROP_FONT, "Arial");
   ObjectSetInteger(0, "MMZ_" + name, OBJPROP_HIDDEN, true);
}
This section of the code is responsible for visually rendering Market Memory Zones on the chart in a clear and informative way. The DrawZone function creates a uniquely named rectangle for each active zone using its type, start time, and index to avoid object conflicts. The rectangle is drawn between the zone’s price boundaries and time range, styled to sit in the background and filled for easy visibility. Zone opacity is dynamically adjusted based on the zone’s calculated strength and the user-defined opacity setting, allowing stronger zones to stand out while weaker ones remain subtle. A tooltip is also attached to each zone, providing quick contextual information such as zone type, strength, and exact price range when hovered over.
The legend-related functions enhance usability by clearly explaining what each zone color represents. The DrawLegend function conditionally displays labels for only the zone types enabled by the user, ensuring the chart remains uncluttered and relevant. Each label is created using the CreateLabel helper function, which positions the text neatly on the chart, applies consistent styling, and hides the objects from accidental interaction. Together, these functions ensure that the indicator is not only analytically powerful but also visually intuitive, making it easy for traders to interpret and trust the zones being displayed.
Market Memory Zones Demo
Conclusion
In summary, the development of the Market Memory Zones indicator involved creating a systematic way to identify key areas on the chart where price is likely to return. We designed multiple zone types—displacement zones, unfilled price areas, structure transition zones, and liquidity sweep origins—each reflecting specific market behaviors such as impulsive moves, inefficiencies, structure shifts, and liquidity targeting. By implementing detection functions, defining a robust MemoryZone structure, and managing zones with strength ratings and visual properties, we created an indicator that not only detects these zones automatically and visualizes them clearly on the chart with rectangles, tooltips, and a legend for easy interpretation.
In conclusion, this indicator provides traders with a powerful tool to anticipate potential market reactions by highlighting zones that carry statistical importance based on past price action. By focusing on areas of market memory rather than arbitrary support and resistance, traders can make more informed decisions, improve trade entry timing, and better manage risk. The visual representation of zones and strength ratings allows for quick analysis, making it easier to identify high-probability areas for re-entry, reversal, or continuation, ultimately helping traders increase confidence and consistency in their trading strategies.
Warning: All rights to these materials are reserved by MetaQuotes Ltd. Copying or reprinting of these materials in whole or in part is prohibited.
This article was written by a user of the site and reflects their personal views. MetaQuotes Ltd is not responsible for the accuracy of the information presented, nor for any consequences resulting from the use of the solutions, strategies or recommendations described.


- Free trading apps
- Over 8,000 signals for copying
- Economic news for exploring financial markets
You agree to website policy and terms of use