
Developing Trading Strategies with the Parafrac and Parafrac V2 Oscillators: Single Entry Performance Insights
Introduction
Technical analysis continually evolves through the refinement of existing tools. TheParafrac oscillator and its subsequent V2 model are prime examples, both derived from the foundational concept of the gap between the Parabolic SAR (PSAR) value and the current price. The core distinction between these two indicators lies in their standardization methodology. The original Parafrac oscillator utilizes fractal range to normalize the PSAR-price gap, while the Parafrac V2 employs the Average True Range (ATR). This critical difference causes each indicator to reveal unique trend structures and levels, presenting distinct trading opportunities that merit thorough exploration.
This article aims to develop and test a suite of trading strategies for both the Parafrac and Parafrac V2 oscillators. By comparing their performance, we will gain valuable insights into their respective strengths and weaknesses in different market conditions.
Strategy Definitions
We will investigate the application of both oscillators under three distinct strategic frameworks. Each strategy is designed to capture specific market behaviors and signal types.
Strategy 1: Zero-Line Cross with Histogram Confirmation
- Buy Signal: When the oscillator crosses above the zero line and either of the first two histograms crosses above the positive threshold.
- Sell Signal: When the oscillator crosses below the zero line and either of the first two histograms crosses below the negative threshold.
Strategy 2: Histogram Momentum Shifts
- Sell Signal: When all three histograms are decreasing above zero.
- Buy Signal: When all three histograms are increasing below zero.
Strategy 3: Histogram-Candle Combination
- Buy Signal: When all three histograms are increasing above zero and the candle 2 closed is bearish.
- Sell Signal: When all three histograms are decreasing below zero and the candle 2 closed is bullish.
Through the systematic application of these three strategies, we will quantify the performance of both the Parafrac and Parafrac V2 oscillators. This analysis will provide traders with actionable insights, clarifying which indicator may be more effective for specific strategic approaches and how they can be best integrated into a comprehensive trading plan.
Backtest Parameters
Before delving into the results, it is essential to outline our testing parameters. All strategies were tested on the GBP/USD currency pair on the H1 (1-hour) timeframe. The backtesting period spans from January 1, 2021, to December 31, 2024, providing a robust dataset encompassing various market states.
Input Parameters
//--- Indicator Type enum
enum IndicatorType
  {
   TypParafrac=0,
   TypParafracV2=1
  };

// Input parameters for trading
input IndicatorType UseIndicator = TypParafrac;  // Select Parafrac or V2 model
input double LotSize = 0.01;                     // Lot size
input int StopLossPoints = 700;                  // Stop loss in points
input double RiskRewardRatio = 2.0;              // Risk/Reward ratio
input double pstep = 0.02;
input double pMax = 0.2;
input int AtrPeriod = 7;                         //ATRperiod for V2
input bool UseStrategy1 = true;                  // Enable Strategy 1
input double threshold4Strat1 =1.5;              //threshold for strat 1
input bool UseStrategy2 = false;                 // Enable Strategy 2
input bool UseStrategy3 = false;                 // Enable Strategy 3
The enum portion creates a custom enumerator named IndicatorType . It allows for the selection between two indicator modes:
- TypParafrac = 0. The original Parafrac Oscillator.
- TypParafracV2 = 1. The V2 Parafrac Oscillator (ATR-based).
The Expert Advisor(EA)'s behavior is controlled by the following configurable settings:
- Oscillator Selection: Chooses which oscillator generates the trading signals. Default: TypParafrac.
- Lot Size: Defines the fixed trade volume for all executed orders. A size of 0.01 lots was used for all tests in this research.
- Stop Loss Distance: Sets the stop loss level in points (not pips). Users must manually convert this value to pips if required for their analysis.
- Take Profit:Defines the profit target using a Reward-to-Risk Ratio (RRR).
- Indicator Parameters: Configures the settings for the PSAR and ATR indicators. The ATR setting only applies to the Parafrac V2 oscillator.
- Strategy 1 Threshold: Sets a specific threshold value that is used exclusively by Strategy 1.
- Strategy Activation: Allows users to enable or disable each of the three strategies (1, 2, 3) independently. The EA will only ever execute one trade at a time. Even if all strategies are enabled, only the first valid signal will trigger a trade.
   if( !TerminalInfoInteger(TERMINAL_TRADE_ALLOWED) ){
        MessageBox("Enable AutoTrading");
        return (0);
       }

   // Create indicator handle
   indicatorHandle = (UseIndicator==TypParafrac)?
    iCustom(_Symbol, _Period, "ParaFracOscillator", pstep, pMax ):
    iCustom(_Symbol, _Period, "ParaFracV2_Oscillator", pstep, pMax, AtrPeriod );

   if(indicatorHandle == INVALID_HANDLE)
   {
      Print("Error creating indicator handle");
      return(INIT_FAILED);
   }
At the initialization function, the code allows the EA to check the following:
- AutoTrading Permission Check: Verifies if AutoTradingis enabled in the platform. If disabled, shows a popup message, "Enable AutoTrading". Immediately exits the EA initialization (stops execution).
- Indicator Loading: Load either the Parafrac oscillator or the Parafrac V2 oscillator, depending on user choice. If they are missing from your system, click each name to go to its download page and install the indicator.
- Handle Management: Store its handle for buffer access. If an indicator fails to load or initialize, the EA fails gracefully.
void OnDeinit(const int reason)
{
   // Release indicator handle
   if(indicatorHandle != INVALID_HANDLE)
      IndicatorRelease(indicatorHandle);
}
During the deinitialization stage, when the EA shuts down, it makes sure the custom Parafrac (or V2) indicator that was created with iCustom() is properly released from memory.
Results and Discussions
The subsequent sections will detail the code implementation and a discussion of the results from our backtesting.
The strategies were tested on the GBPUSD H1 timeframe over a 3-year period (January 2021 – December 2024), with an initial equity of $1,000.00. Performance was evaluated using the following key metrics:
- Total Net Profit – overall gains relative to initial equity.
- Profit Factor – ratio of gross profit to gross loss.
- Total Trades – number of executed trades.
- Drawdown % – maximum equity decline from a peak.
- Win-Rate and RRR – percentage of winning trades relative to risk-to-reward ratio.
- Consecutive Losses/Wins – sequence of successive losing or winning trades.
Strategy 1: Coding and Testing
The first strategy was implemented in code using the trading rules outlined earlier. Both the Parafrac oscillator and the Parafrac V2 model were tested under this framework.
   // Strategy 1: Zero line crossover with strong momentum
   if(UseStrategy1 && !Check4TradesOpen(POSITION_TYPE_BUY) )
   {
      // Buy condition: Cross up zero and any of first 2 histograms above threshold
      if( (prevValue <= 0 && currentValue > 0 || prevValue2 <= 0 && prevValue > 0)
           && currentValue > threshold4Strat1  )
      {
         ExecuteBuy();
      }
   }

   if(UseStrategy1 && !Check4TradesOpen(POSITION_TYPE_SELL))
   {
      // Sell condition: Cross down zero and any of first 2 histograms below -threshold
      if( (prevValue >= 0 && currentValue < 0 || prevValue2 >= 0 && prevValue < 0 )
           && currentValue < -threshold4Strat1 )
      {
         ExecuteSell();
      }
   }
During this phase, the strategy was optimized using three core parameters: stop loss, RRR, and threshold levels. The goal was to identify the parameter set that would maximize performance and robustness for each specific indicator within the framework of Strategy 1. After the optimization process, the best-performing parameter set for each indicator was selected.
Results for Parafrac Oscillator
Figure 1 illustrates the performance of the Parafrac Oscillator under Strategy 1.
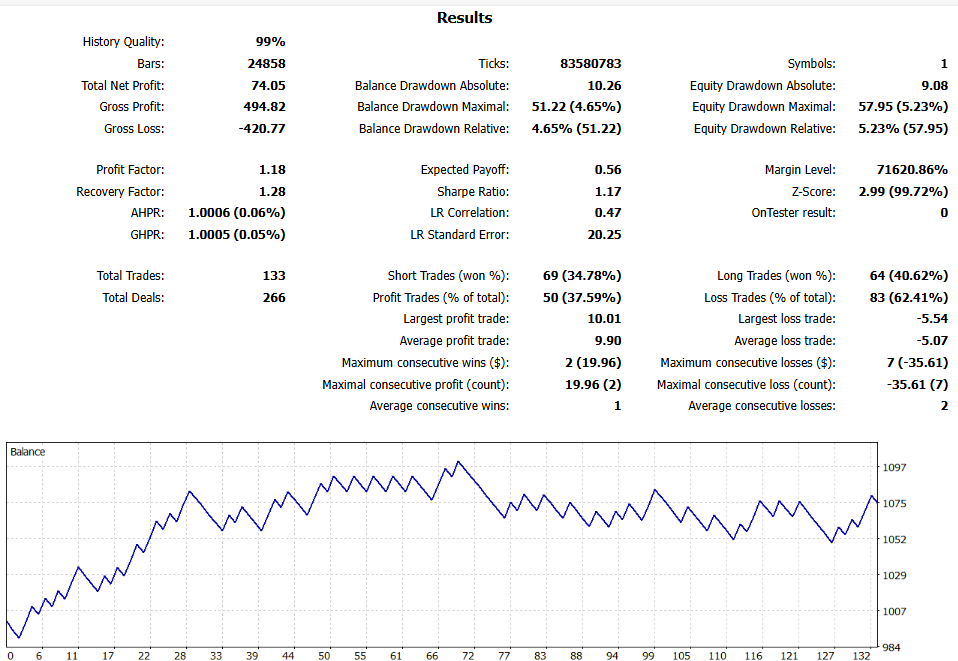
Figure 1: Strategy 1's Results for Parafrac Oscillator
Analysis:
- Total Net Profit: $74.15 (+7.4% of initial equity). This indicates modest growth, suggesting the strategy is profitable but limited in scale.
- Profit Factor: 1.18, reflecting that profits were only slightly higher than losses, leaving little margin for error.
- Total Trades: 133, showing frequent trading activity. While this provides more opportunities, it also increases exposure to noise and false signals.
- Drawdown %: 5.23%, indicating moderate risk and relatively good equity protection.
- Win-Rate and RRR: 37.59% win-rate with an RRR of 2. Despite the low win-rate, the higher RRR kept the system profitable.
- Consecutive Losses/Wins: 7 losses and 2 wins. The system struggled with long losing streaks, which may challenge trader psychology.
Results for Parafrac V2 Oscillator
Figure 2 shows the performance of the Parafrac V2 Oscillator under Strategy 1.
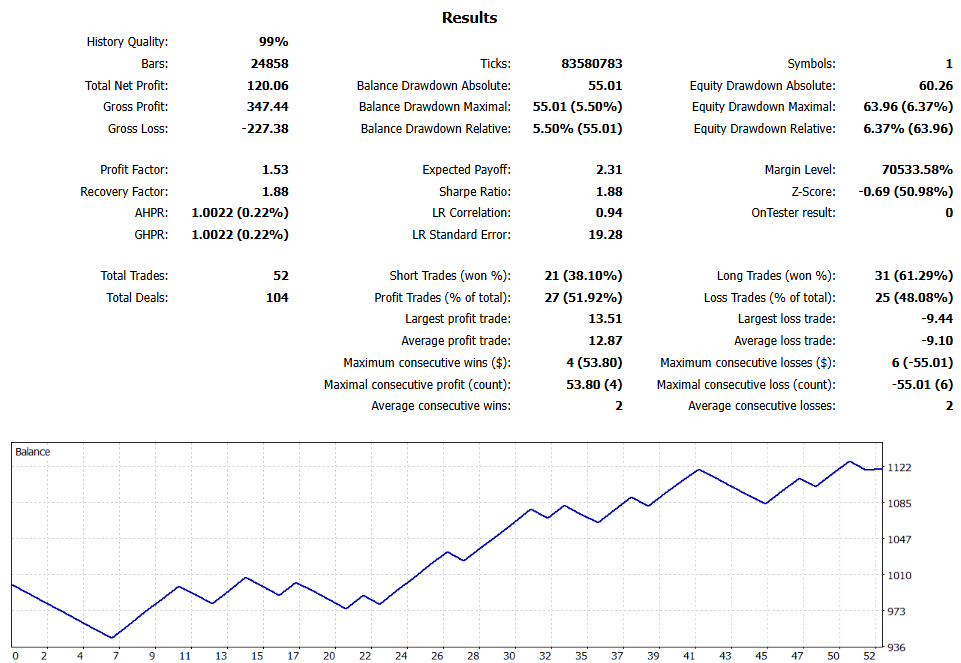
Figure 2: Strategy 1's Results for Parafrac V2 Oscillator
Analysis:
- Total Net Profit: $120.06 (+12.0% of initial equity). This represents a stronger growth rate than the original Parafrac.
- Profit Factor: 1.53, a more robust figure suggesting significantly better profitability relative to losses.
- Total Trades: 52, indicating fewer but more selective trade opportunities.
- Drawdown %: 6.37%, slightly higher than the original but still within acceptable limits.
- Win-Rate and RRR: 51.92% win-rate with an RRR of 1.5. A balanced profile, combining a solid win percentage with a reasonable RRR.
- Consecutive Losses/Wins: 6 losses and 4 wins. Compared to the original, this shows greater consistency and fewer extended losing streaks.
Comparative Analysis:
For strategy 1, when comparing the two oscillators, the Parafrac V2 clearly outperformed the original on most fronts. It delivered a higher net profit, a stronger profit factor, and a more balanced trade distribution. While the V2 had slightly higher drawdown, its improved win-rate and reduced trade frequency suggest it provides cleaner, higher-quality signals.
The original Parafrac oscillator demonstrated profitability but relied heavily on its high RRR to offset a low win-rate. This made it more vulnerable to long streaks of consecutive losses, which could erode trader confidence.
Key Observation on Signal Filtering:
A critical finding from the simulation was the sensitivity of both indicators to the confirmation threshold. At low thresholds, both indicators generated an excessive number of low-quality trades, leading to negative results due to transaction costs and whipsaws. As the threshold was raised, the number of trades reduced significantly, and performance improved markedly. This highlights that the core value of this indicator setup is not in identifying the trend direction (which the base PSAR already does) but in quantifying the strength of the momentum behind the trend break. The threshold acts as a vital filter, ensuring only meaningful momentum surges trigger a trade entry, which is the unique edge this oscillator provides over a standard PSAR crossover system.Strategy 2: Coding and Testing
The second strategy was also coded according to the trading rules defined earlier—focusing on histogram momentum shifts above and below the zero line. Both the Parafrac oscillator and the Parafrac V2 model were tested under this framework.
   // Strategy 2: Momentum reversal
   if(UseStrategy2 && !Check4TradesOpen(POSITION_TYPE_BUY))
   {
      // Buy condition: 3 histograms increasing below zero
      if(currentValue < 0 && prevValue < 0 && prevValue2 < 0 &&
         currentValue > prevValue && prevValue > prevValue2)
      {
         ExecuteBuy();
      }
   }

   if(UseStrategy2 && !Check4TradesOpen(POSITION_TYPE_SELL))
   {
      // Sell condition: 3 histograms decreasing above zero
      if(currentValue > 0 && prevValue > 0 && prevValue2 > 0 &&
         currentValue < prevValue && prevValue < prevValue2)
      {
         ExecuteSell();
      }
   }
Unlike Strategy 1, Strategy 2 does not employ a threshold filter. Instead, the optimization process focused solely on two parameters: Stop loss and RRR. After this optimization phase, the best-performing parameter set for each indicator was selected.
Results for Parafrac Oscillator
Figure 3 depicts the performance of the Parafrac Oscillator under Strategy 2.
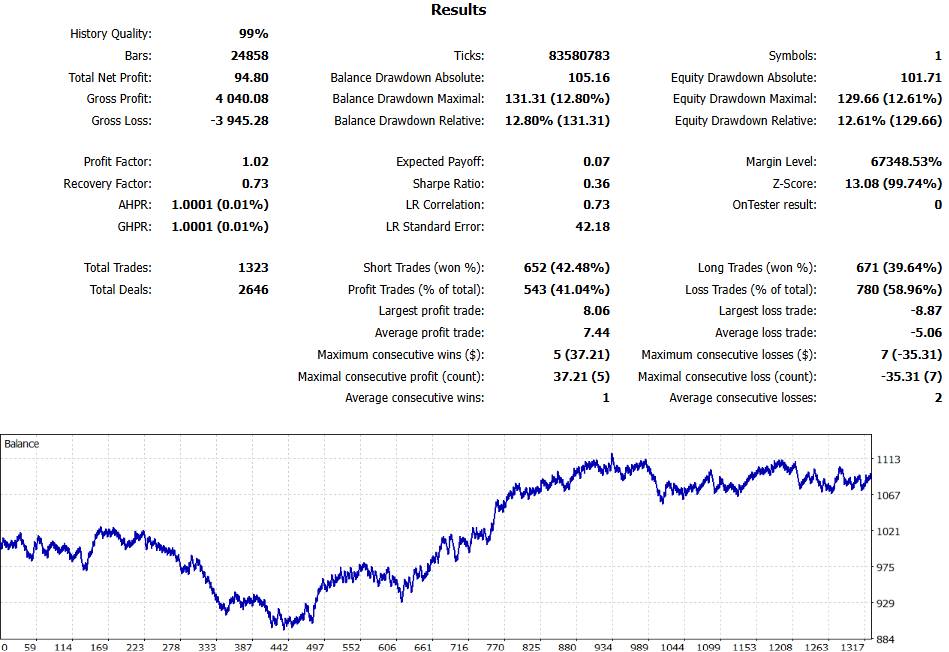
Figure 3: Strategy 2's Results for Parafrac Oscillator
Analysis:
- Total Net Profit: $94.80 (+9.4% of initial equity). While profitable, the returns are modest relative to the high number of trades.
- Profit Factor: 1.02, suggesting that profits were nearly equal to losses, leaving very little edge.
- Total Trades: 1,323, an extremely high trade count, which exposes the system to overtrading and higher transaction costs.
- Drawdown %: 12.61%, showing a deeper risk profile compared to Strategy 1.
- Win-Rate and RRR: 41.04% win-rate with RRR = 1.5. The slightly favorable RRR helped maintain profitability despite a modest win-rate.
- Consecutive Losses/Wins: 7 losses and 5 wins. The system is prone to extended losing streaks but can also string together moderate winning runs.
Results for Parafrac V2 Oscillator
Figure 4 depicts the performance of the Parafrac V2 Oscillator under Strategy 2.
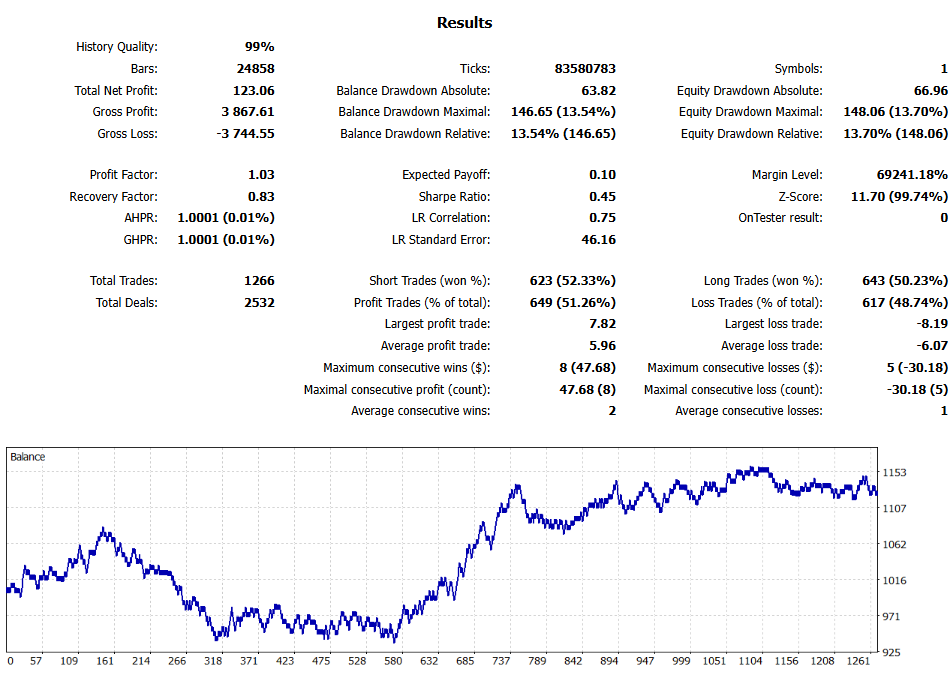
Figure 4: Strategy 2's Results for Parafrac V2 Oscillator
Analysis:
- Total Net Profit: $123.06 (+12.3% of initial equity), outperforming the original oscillator in absolute returns.
- Profit Factor: 1.03, slightly higher than the original, but still close to breakeven efficiency.
- Total Trades: 1,266, indicating slightly fewer signals than the original while still maintaining high frequency.
- Drawdown %: 13.7%, a bit higher than the original, reflecting increased risk exposure.
- Win-Rate and RRR: 51.26% win-rate with RRR = 1.0. The improved win-rate compensated for the lower RRR, producing more consistent winning outcomes.
- Consecutive Losses/Wins: 5 losses and 8 wins. Compared to the original, this shows fewer extended losing streaks and stronger clusters of wins.
Comparative Analysis:
For strategy 2, between the two, the Parafrac V2 oscillator demonstrated better overall effectiveness under Strategy 2. It generated higher net profit, maintained a stronger win-rate, and showed fewer consecutive losses. Although its drawdown was slightly higher, this was offset by its ability to produce longer winning streaks and more reliable outcomes.
The original Parafrac oscillator, while still profitable, suffered from an excessive number of trades and marginal profitability (profit factor close to 1.0). Its reliance on higher trade volume made it less efficient compared to the V2 model.
In summary, Parafrac V2 offers a more balanced performance under Strategy 2, whereas the original Parafrac is less reliable due to overtrading and vulnerability to losing streaks.
Strategy 3: Coding and Testing
The third strategy was implemented in code based on the rules outlined earlier—combining histogram movement with candle confirmation. Specifically, the system enters a position when all three histograms align in one direction while the most recent closed candle provides a confirming signal. The strategy was tested on the Parafrac oscillator as well as the Parafrac V2 model.
   // Strategy 3: Momentum continuation with confirmation
   if(UseStrategy3 && !Check4TradesOpen(POSITION_TYPE_BUY))
   {
      // Buy condition: 3 histograms increasing above zero AND bearish candle
      if(currentValue > 0 && prevValue > 0 && prevValue2 > 0 &&
         currentValue > prevValue && prevValue > prevValue2 &&
         priceData[0].close < priceData[0].open)
      {
         ExecuteBuy();
      }
   }

   if(UseStrategy3 && !Check4TradesOpen(POSITION_TYPE_SELL))
   {
      // Sell condition: 3 histograms decreasing below zero AND bullish candle
      if(currentValue < 0 && prevValue < 0 && prevValue2 < 0 &&
         currentValue < prevValue && prevValue < prevValue2 &&
         priceData[0].close > priceData[0].open)
      {
         ExecuteSell();
      }
   }
}
The optimization process focused on the following parameters: Stop loss and RRR. Optimization results were used to select the best-performing configuration for both indicators.
Results for Parafrac Oscillator
Figure 5 presents the performance results of the Parafrac Oscillator when applied under Strategy 3. 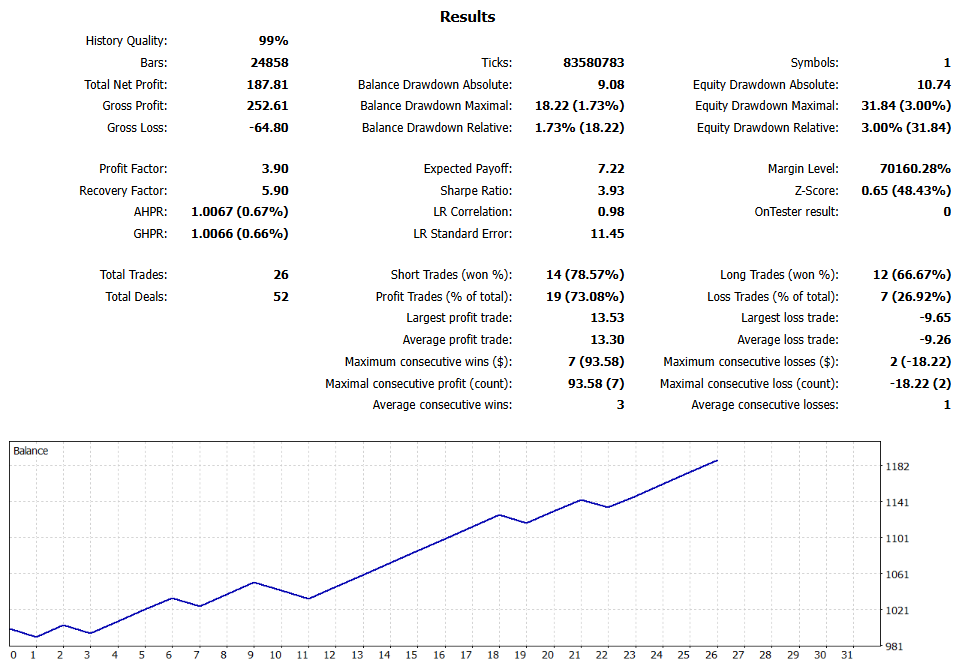
Figure 5: Strategy 3's Results for Parafrac Oscillator
Analysis:
- Total Net Profit: $187.81 (+18.8% of initial equity). This represents strong profitability, the highest observed across all strategies for this indicator.
- Profit Factor: 3.9, indicating that profits were nearly four times larger than losses, showing excellent trade efficiency.
- Total Trades: 26, reflecting a highly selective system. While this limits opportunities, it enhances the quality of trades.
- Drawdown %: 3%, very low-risk exposure, making the system stable and capital-preserving.
- Win-Rate and RRR: 73.08% win-rate with RRR = 1.5. This combination reflects a robust balance between frequent winners and favorable risk-reward.
- Consecutive Losses/Wins: 2 losses vs. 7 wins. Short losing streaks and extended winning runs provide a psychologically favorable trading experience.
Results for Parafrac V2 Oscillator
Figure 6 shows the Parafrac V2 Oscillator’s performance under Strategy 3.
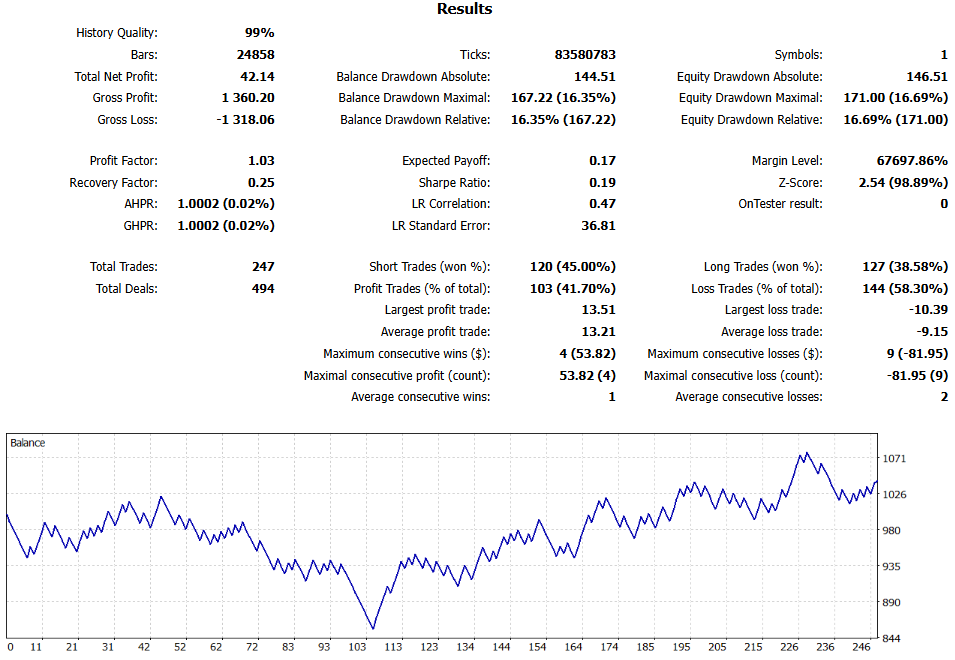
Figure 6: Strategy 3's Results for Parafrac V2 Oscillator
Analysis:
- Total Net Profit: $42.14 (+4.2% of initial equity). Although profitable, this result was much weaker compared to the original Parafrac.
- Profit Factor: 1.03, suggesting profits only marginally outweighed losses, leaving a limited trading edge.
- Total Trades: 247, a very high frequency compared to the original, which introduces significant noise and reduces selectivity.
- Drawdown %: 16.69%, a considerably higher risk profile, exposing capital to greater volatility.
- Win-Rate and RRR: 41.7% win-rate with RRR = 1.5. The modest win percentage undermines profitability despite a reasonable RRR.
- Consecutive Losses/Wins: 9 losses vs. 4 wins. The long losing streaks increase the risk of equity drawdown and psychological stress.
Comparative Analysis:
Strategy 3 clearly highlighted the strength of the original Parafrac oscillator over the V2 model. With significantly fewer trades, lower drawdown, higher win-rate, and a much stronger profit factor, the original version delivered superior efficiency and profitability.
In contrast, the V2 oscillator struggled under this strategy. Its high trade count, low profit factor, and deeper drawdown indicate it was far less effective in filtering quality signals, despite producing positive net profit.
Thus, under Strategy 3, the original Parafrac oscillator proved more effective, offering both stronger returns and greater stability.
Key Observation on Strategy 2 and 3
This simulation underscored the critical importance of signal filters. Strategy 2 suffered from excessive noise due to the lack of a confirming filter, leading to thousands of low-quality trades. Strategy 3’s incorporation of price action (the "candle bar" filter) successfully reduced noise and improved performance dramatically for the original Parafrac. However, for the Parafrac V2, the price action filter was insufficient to overcome its inherent noisiness within this strategic context, as evidenced by the still-high trade count. This suggests that for the V2 model, an additional filter (e.g., a minimum momentum threshold or trend strength filter) would be necessary to make Strategy 3 viable.Conclusion
This article explored three trading strategies applied to both the original Parafrac oscillator and its V2 model, providing valuable insights into their strengths and weaknesses.
- Strategy 1 (Zero-Line Crossover with Confirmation) showed that both oscillators could generate profit when optimized with stop-loss, reward-to-risk ratio, and threshold levels. The V2 model outperformed the original in net profit and win-rate, though both benefited significantly from higher threshold levels that filtered out excessive trades.
- Strategy 2 (Histogram Momentum Divergence) which operated without a threshold, resulted in an excessive number of trades for both indicators. While the V2 oscillator maintained a higher win-rate, profitability for both oscillators was marginal, with profit factors close to breakeven. This highlighted the vulnerability of unfiltered strategies to market noise.
- Strategy 3 (Momentum with Price Action Confirmation) introduced candle confirmation as a filter. Here, the original Parafrac oscillator significantly outperformed the V2 model, delivering higher net profit, a stronger profit factor, a much higher win-rate, and lower drawdown. The V2, by contrast, produced too many trades and suffered from extended losing streaks.
Overall, the findings emphasize that signal filtering and execution rules are critical in determining the effectiveness of either oscillator. While the V2 model performed better under Strategy 1 and marginally better under Strategy 2, the original Parafrac oscillator excelled under Strategy 3, showing the importance of combining oscillators with candle-based confirmations. In summary, the choice between oscillators is not about which is universally "better," but which is better suited to the specific trading strategy.
In our next article, we will expand this analysis by introducing threshold refinements and price action filters into all three strategies to evaluate whether performance consistency and profitability can be further enhanced.Warning: All rights to these materials are reserved by MetaQuotes Ltd. Copying or reprinting of these materials in whole or in part is prohibited.
This article was written by a user of the site and reflects their personal views. MetaQuotes Ltd is not responsible for the accuracy of the information presented, nor for any consequences resulting from the use of the solutions, strategies or recommendations described.
 Building AI-Powered Trading Systems in MQL5 (Part 2): Developing a ChatGPT-Integrated Program with User Interface
 Developing a Volatility Based Breakout System
 Automating The Market Sentiment Indicator
 Simplifying Databases in MQL5 (Part 2): Using metaprogramming to create entities
- Free trading apps
- Over 8,000 signals for copying
- Economic news for exploring financial markets
You agree to website policy and terms of use