

From Basic to Intermediate: Subwindows (IV)
 53
 1

Introduction
In the previous article, From Basic to Intermediate: Subwindows (III), we explained how to handle certain situations related to subwindows. The main idea of that article revolves around the properties we can assign to a specific indicator. These properties allow you to tell the compiler exactly how a particular subwindow should—or should not—be created.
As explained in the previous article, there are times when WE DO NOT WANT our indicator to have a second instance. We'll take a closer look at this type of situation in another article later on, when we start using certain properties to better control what MetaTrader 5 actually needs to do.
So we still have a lot to cover from what I consider to be the fundamentals of MQL5. Although MetaTrader 5 was primarily designed as a trading platform, we can make many changes to it so that it ultimately serves a completely different purpose.
Remember that we can make MetaTrader 5 do anything. In many cases, we will have to resort to methods that go beyond what MQL5 offers by default. In such cases, we'll have to switch to C or C++ and use some method to link the MQL5 code with C or C++. Once you've done that, the gates of paradise—or perhaps hell—will open before you.
This series of articles will not cover that topic, as I believe that using other languages, such as C and C++, to further extend MQL5's control over MetaTrader 5 is a truly advanced subject. And that will not be discussed here.
Subwindows (IV)
In the previous article, we covered the material needed to write the code shown below.
01. //+------------------------------------------------------------------+
02. #property copyright "Daniel Jose"
03. //+------------------------------------------------------------------+
04. #property description "DEMO Indicator"
05. //+------------------------------------------------------------------+
06. #property indicator_separate_window
07. #property indicator_height          50
08. #property indicator_plots           0
09. //+------------------------------------------------------------------+
10. int OnInit(void)
11. {
12.     IndicatorSetString(INDICATOR_SHORTNAME, "Test 123.");
13.
14.     return INIT_SUCCEEDED;
15. };
16. //+------------------------------------------------------------------+
17. int OnCalculate(const int rates_total, const int prev_calculated, const int begin, const double &price[])
18. {
19.     return rates_total;
20. };
21. //+------------------------------------------------------------------+
Code 01
Although all the code examples discussed in the previous article are functional—that is, they can be executed in MetaTrader 5—some of them may trigger a compiler warning during compilation. This can be fixed by adding what is shown on line 8 of Code 01. Since I consider the indicator shown above to be “empty,” it is ideal for demonstrating and studying all indicator properties. When I say that an indicator is empty, I mean that it does absolutely nothing and has no practical functionality when placed on a chart. Since we won't be displaying any lines or curves on the chart when using Code 01, we specify that the number of indicator plots is zero so that the compiler doesn't generate any warnings.
All right, as we saw in the previous article, line 6 of Code 01 tells MetaTrader 5 to place this indicator in a subwindow when we try to use it on a chart. The subwindow may or may not be created, as shown in previous articles. The seventh line specifies the size of this subwindow, if it needs to be created. As for these indicator properties, I don't think any of you should have any doubts, since it's all quite simple, clear, and straightforward.
I want you to understand that Code 01 serves as the basis for another approach we can use. Although this may seem a bit confusing at first, this approach allows us to have much better control over what happens in certain situations that would otherwise be much more difficult to manage.
To understand what kind of problem we can solve by thoroughly understanding what Code 01 does, you need to have mastered the material covered in the most recent articles in this series. It was shown there that MetaTrader 5 can prevent more than one instance of an indicator from appearing on a single chart. This helps avoid wasting resources. This is no longer the case when we start using a property that indicates the need for a subwindow. In this case, MetaTrader 5 ignores the existence of an already open instance and creates new instances whenever the user or trader adds the same indicator to the chart again. All of this was explained in detail in previous articles. However, there is a way to avoid this and, at least in general, prevent a new instance of a specific indicator we've implemented from being placed on the chart when we're working with subwindows.
To understand how we can do this, we need to consult the MQL5 documentation, since that's where the process is explained. If you look closely, you'll find the ChartIndicatorAdd function. This function is very interesting, although—if you go by the documentation alone—it might seem quite ordinary. If you cannot imagine using this function in ways other than those intended, this greatly limits your options and often even prevents you from understanding why the code behaves a certain way. Before we get into this, I want you to take note of one point from the documentation itself. To make it easier to understand the explanation that follows, we’ll include below the full text of an important section of the documentation on this function, which we’ll need shortly.
Note
If an indicator is supposed to be displayed in a separate subwindow (for example, when creating an iMACD or a custom indicator with the #property indicator_separate_window property) and is applied to the main chart window, it may be invisible, although it will still appear in the list of indicators. This means that the indicator's scale differs from that of the price chart, and that the value of the applied indicator falls outside the visible range of the price chart. In this case, the GetLastError() function returns Code 0, indicating that there are no errors. The values of this "invisible" indicator can be viewed in the Data Window and accessed from other MQL5 applications.
In short, the documentation states that you can load an indicator designed for use in a subwindow into the main chart window. It will not be visible and will not create a subwindow to display itself unless this is specified correctly when calling the ChartIndicatorAdd function.
It's perfectly normal if you don't understand the explanation in the documentation right away. Many good programmers face this challenge at first. This is because the documentation is intended to explain, in a simplified way, what behavior you should expect, rather than to describe things you might want to do but that were not taken into account when the system was designed. And this applies to any programming language. For those just getting started, much of the information provided in the documentation may seem quite confusing. With experience, you'll learn to extract valuable information from it to create nonstandard solutions. Precisely because I am aware of this challenge and understand how difficult it can be for many people to use the documentation, I occasionally relate the explanations in the article to what you can find in the documentation. That way, over time, you'll be able to understand any explanation you come across there and manage on your own. For this reason, we can take a closer look at what has already been said so that you can truly understand exactly what the documentation says.
01. //+------------------------------------------------------------------+
02. #property copyright "Daniel Jose"
03. //+------------------------------------------------------------------+
04. #property description "DEMO Indicator"
05. //+------------------------------------------------------------------+
06. #property indicator_chart_window
07. #property indicator_plots           0
08. //+------------------------------------------------------------------+
09. int OnInit(void)
10. {
11.     IndicatorSetString(INDICATOR_SHORTNAME, "Test 456S.");
12.
13.     return INIT_SUCCEEDED;
14. };
15. //+------------------------------------------------------------------+
16. int OnCalculate(const int rates_total, const int prev_calculated, const int begin, const double &price[])
17. {
18.     return rates_total;
19. };
20. //+------------------------------------------------------------------+
Code 02
01. //+------------------------------------------------------------------+
02. #property copyright "Daniel Jose"
03. //+------------------------------------------------------------------+
04. #property description "DEMO Indicator"
05. //+------------------------------------------------------------------+
06. #property indicator_chart_window
07. #property indicator_plots           0
08. //+------------------------------------------------------------------+
09. int OnInit(void)
10. {
11.     IndicatorSetString(INDICATOR_SHORTNAME, "Test 456.");
12.     ChartIndicatorAdd(0, 0, iCustom(NULL, NULL, "Tutor\\Code 01"));
13.
14.     return INIT_SUCCEEDED;
15. };
16. //+------------------------------------------------------------------+
17. int OnCalculate(const int rates_total, const int prev_calculated, const int begin, const double &price[])
18. {
19.     return rates_total;
20. };
21. //+------------------------------------------------------------------+
Code 03
All right, now take a look at some of the details in Code 03. Please note that in the twelfth line, we use the ChartIndicatorAdd function. We do not perform any runtime error checking here. That is precisely why you should exercise caution when attempting to run Code 03 locally. First, make sure that Code 01 has been compiled correctly. Thus, when the twelfth line of Code 03 is executed, MetaTrader 5 will access the executable file for indicator 01. Second, you'll notice that I use a call to iCustom within the ChartIndicatorAdd function. The purpose of this call is to create a handle for a custom indicator. In other words, this allows us to expand our capabilities—or, more precisely, to use indicators other than those already provided by MetaTrader 5 through MQL5.
In the article "From Basic to Intermediate: Indicator (V)" we began discussing these indicators—that is, the so-called technical indicators. Here, we continue to explore this topic. All right, at this stage, you need to make sure that both the directory and the name of the indicator to be loaded using iCustom are specified correctly. In the attached file, the required directory structure will already be set up correctly. Therefore, to test Code 03, do not modify the structure unless you really understand what you're doing. Otherwise, the final result will differ from the one shown here.
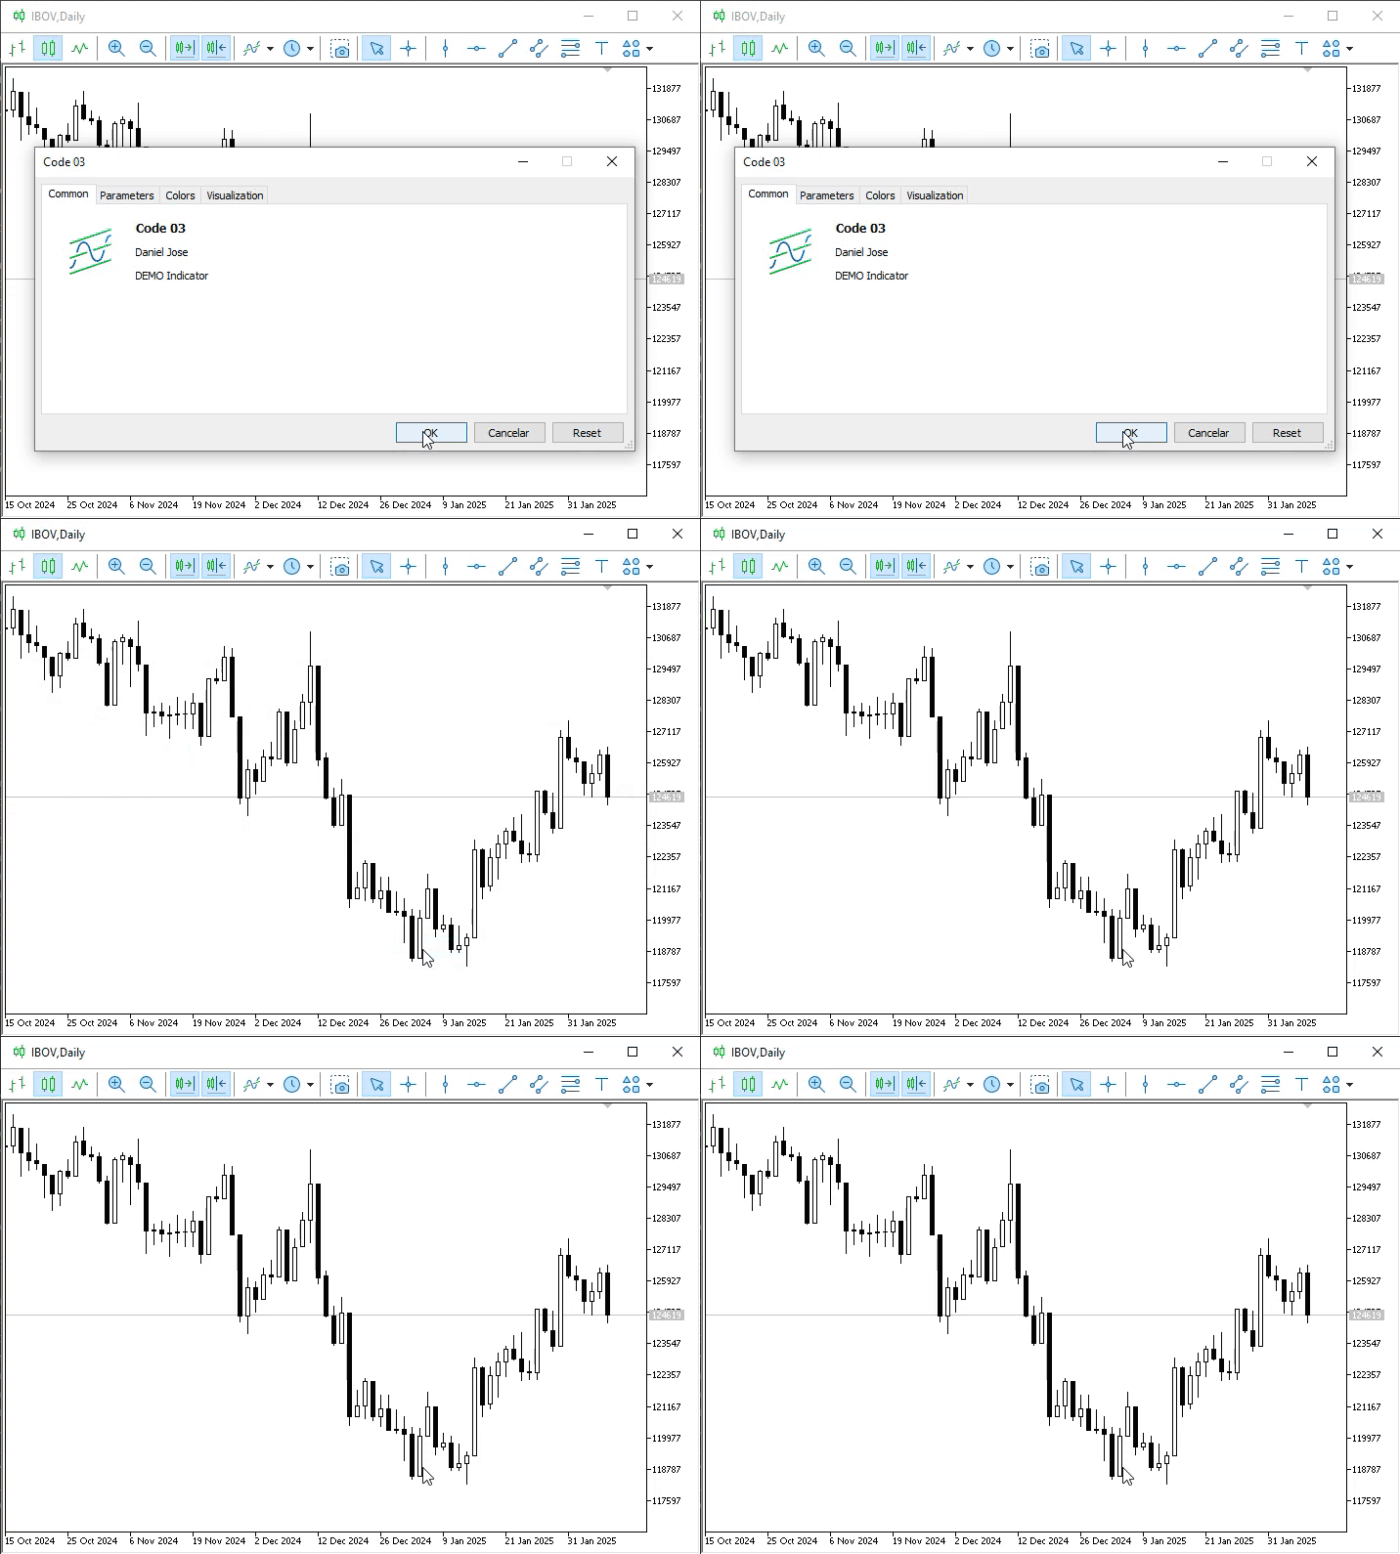
Animation 01
What just happened? I don't understand that. Didn't the indicator from Code 03 add indicator 01 to the chart? Let's see what happened. To do this, simply open the list of indicators on the chart and check which ones are displayed there. You can see this in the following image.
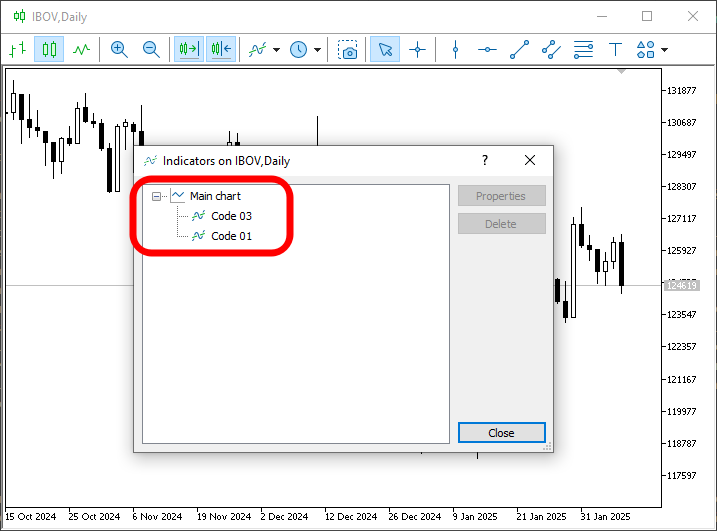
Image 01
How strange. Indicator 03 was indeed able to load indicator 01 onto the chart. Indicator 01 did not create a subwindow as expected. Or, to be more precise, I assumed that a subwindow would be created when indicator 01 was executed. Hmm, wait a minute. Is indicator 01 actually running? Because, in my opinion, what just happened makes no sense at all. To be honest, I'm a little confused.
That is why it is important, dear reader, that you try to apply all the knowledge presented in these articles and always conduct your own local tests to understand the details. Any questions you leave unresolved at this stage of your learning are bound to resurface later. In any case, if you analyze what's happening here, you'll notice that indicator 01 is not only loaded but also running. And here's the important thing: it doesn't appear on the chart. This happens because in Code 03, we do not specify that the indicator should be displayed. This is precisely what is explained in the documentation.
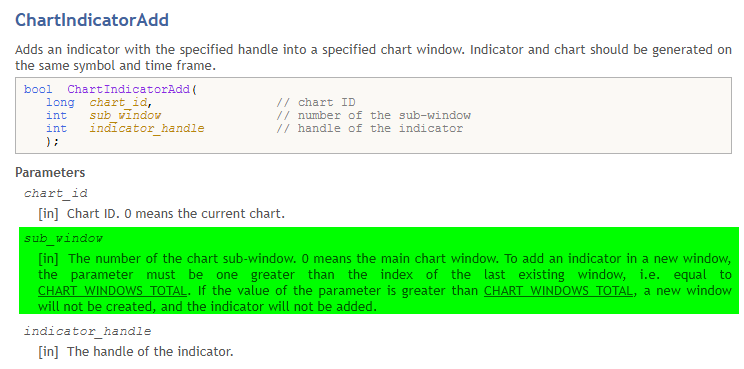
Image 02
The area highlighted in Image 02 is exactly the part we're interested in. Note that the documentation states that when adding an indicator using the ChartIndicatorAdd function, we must specify the subwindow to which it should be added. Pay very close attention to this information, my dear reader: depending on exactly what you plan to do with the code to automate a particular strategy, a clear and objective understanding of what is highlighted in Image 02 may determine whether your code works as intended.
01. //+------------------------------------------------------------------+
02. #property copyright "Daniel Jose"
03. //+------------------------------------------------------------------+
04. #property description "DEMO Indicator"
05. //+------------------------------------------------------------------+
06. #property indicator_chart_window
07. #property indicator_plots           0
08. //+------------------------------------------------------------------+
09. int OnInit(void)
10. {
11.     IndicatorSetString(INDICATOR_SHORTNAME, "Test 456.");
12.     ChartIndicatorAdd(0, (int)ChartGetInteger(0, CHART_WINDOWS_TOTAL), iCustom(NULL, NULL, "Tutor\\Code 01"));
13.
14.     return INIT_SUCCEEDED;
15. };
16. //+------------------------------------------------------------------+
17. int OnCalculate(const int rates_total, const int prev_calculated, const int begin, const double &price[])
18. {
19.     return rates_total;
20. };
21. //+------------------------------------------------------------------+
Code 04
Now, please pay close attention to what is about to be explained, because it is extremely important for understanding what we will be doing next. Note that the only difference between Code 03 and Code 04 is the second argument of the ChartIndicatorAdd function on line 12 of both listings. And here's the important thing: this simple difference is more than enough to make the indicator's executable file behave completely differently from what we saw in Animation 01.
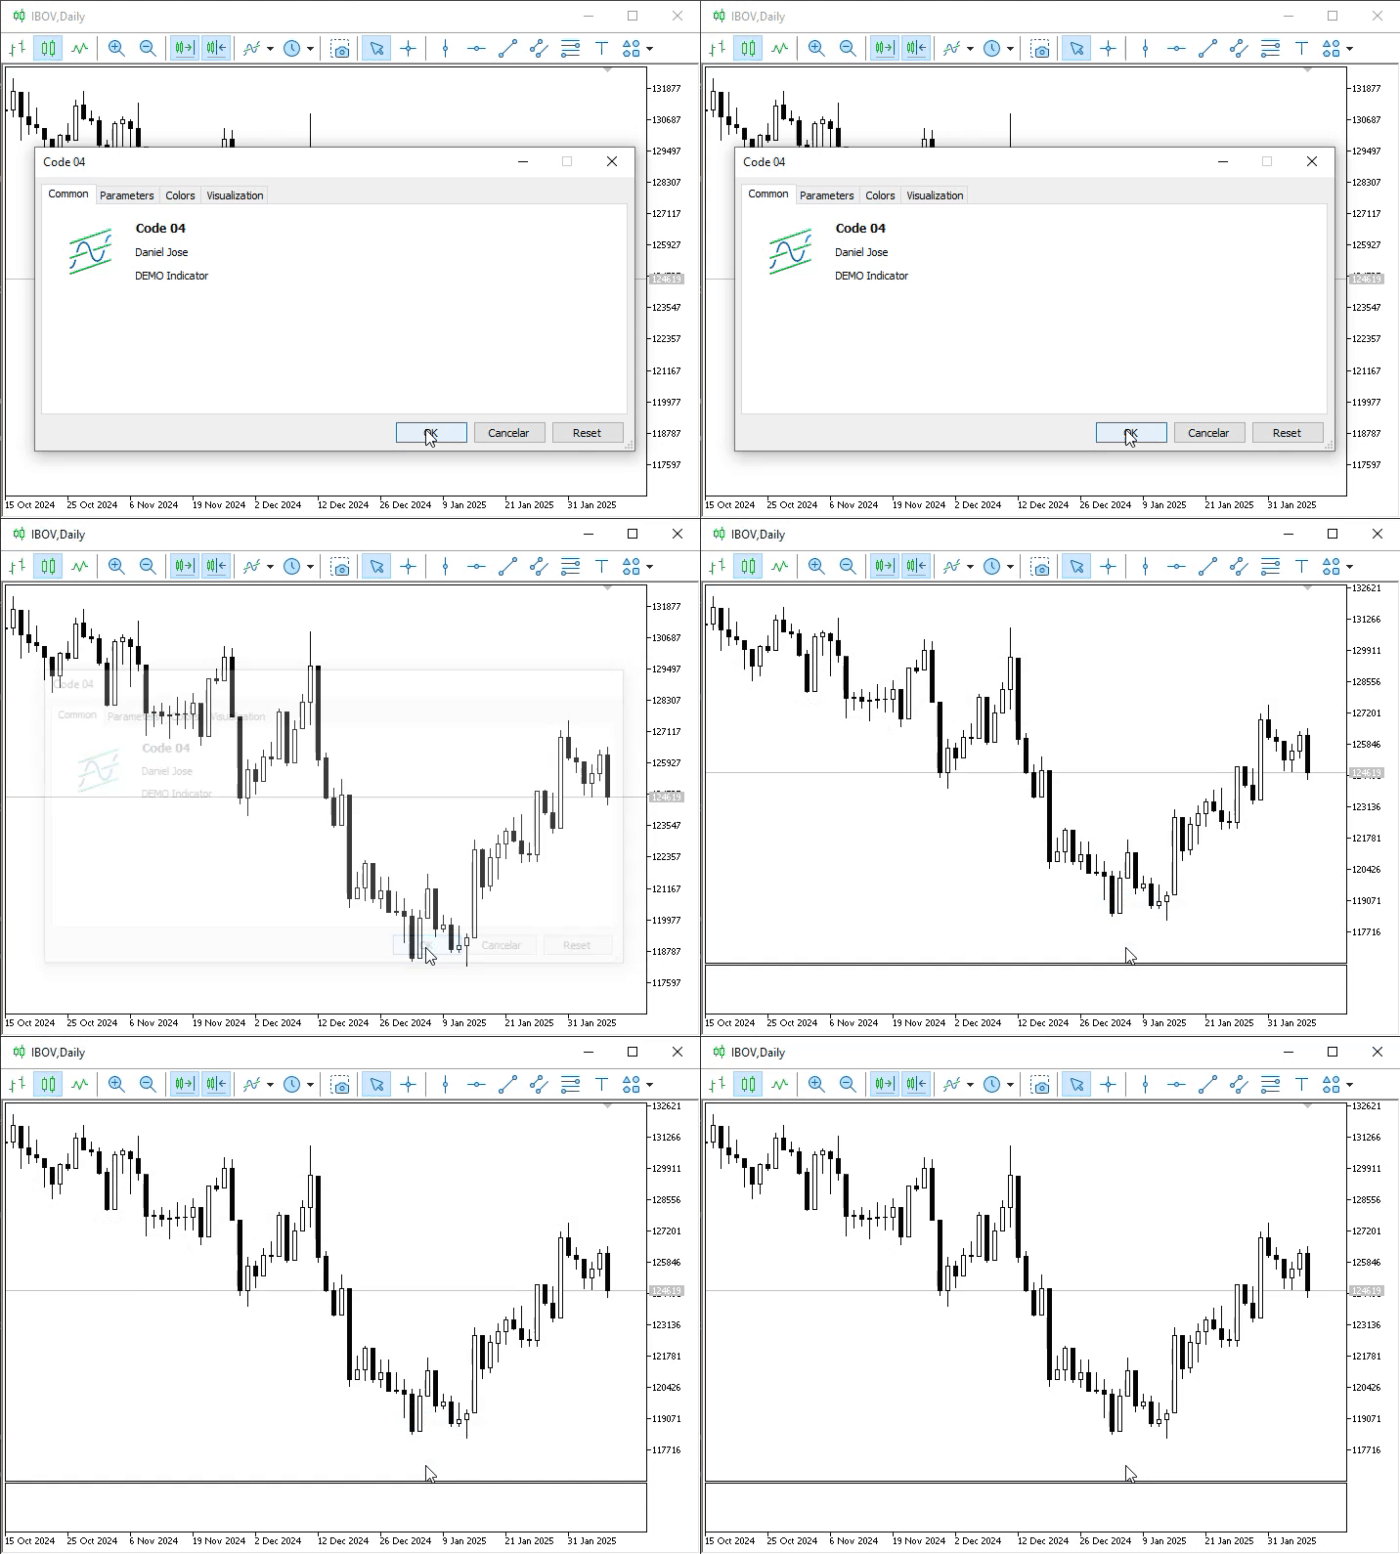
Animation 02
Isn't that interesting? Unlike what happened before, a new subwindow is now actually created, just as we expected. And when we look at the list of indicators, we'll see the following result.
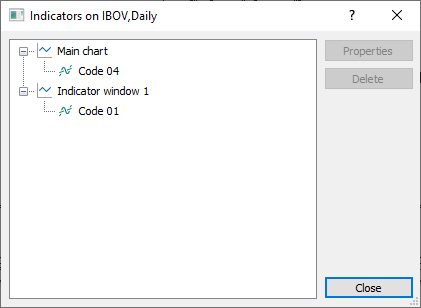
Image 03
Great. The question is: why does it work now when it didn't before? The answer is that if you look at Code 03, you'll see that the second argument passed to the ChartIndicatorAdd function instructs MetaTrader 5 to add the indicator to the main chart window. Since the indicator in Code 01 EXPECTS AND REQUIRES a subwindow, it is not displayed on the screen. Even if it displayed important information, IT WOULD NOT BE DISPLAYED and would remain invisible to the user or operator viewing the chart.
In Code 04, however, in the same argument that previously specified the main chart window, we now ask MetaTrader 5 to determine and return the number of subwindows on the chart, and then add the indicator specified in the third argument to the next subwindow. For this reason, Code 04 allows Code 01 to create a new subwindow. This is very useful and allows us to do a lot of interesting things, which we'll discuss and explore another time.
Before I wrap up this article, I want to explain one more thing about the ChartIndicatorAdd function. Think of it as a little bonus. If you've been paying close attention to what we've been doing so far, you've probably noticed something. In all cases, we can obtain some rather interesting results in a very simple way and with virtually no effort. In one case, we specified that the indicator being added should be placed in the main chart window, and in another, that a new subwindow should be created. Question: What happens if there is already a subwindow on the chart, and we load an indicator and place it in that subwindow? "Wait a minute. What are you getting at with this hypothesis?"
So, the idea I want you to understand has already been discussed in another article from this same series. I'm referring to the article "From Basic to Intermediate: Subwindows (II)". That article demonstrated that we can have one indicator use values calculated by another indicator to create a third indicator. The idea itself is quite simple and interesting. For this to happen automatically as soon as you add an indicator to the chart, you need to have a clear understanding of exactly what you're implementing.
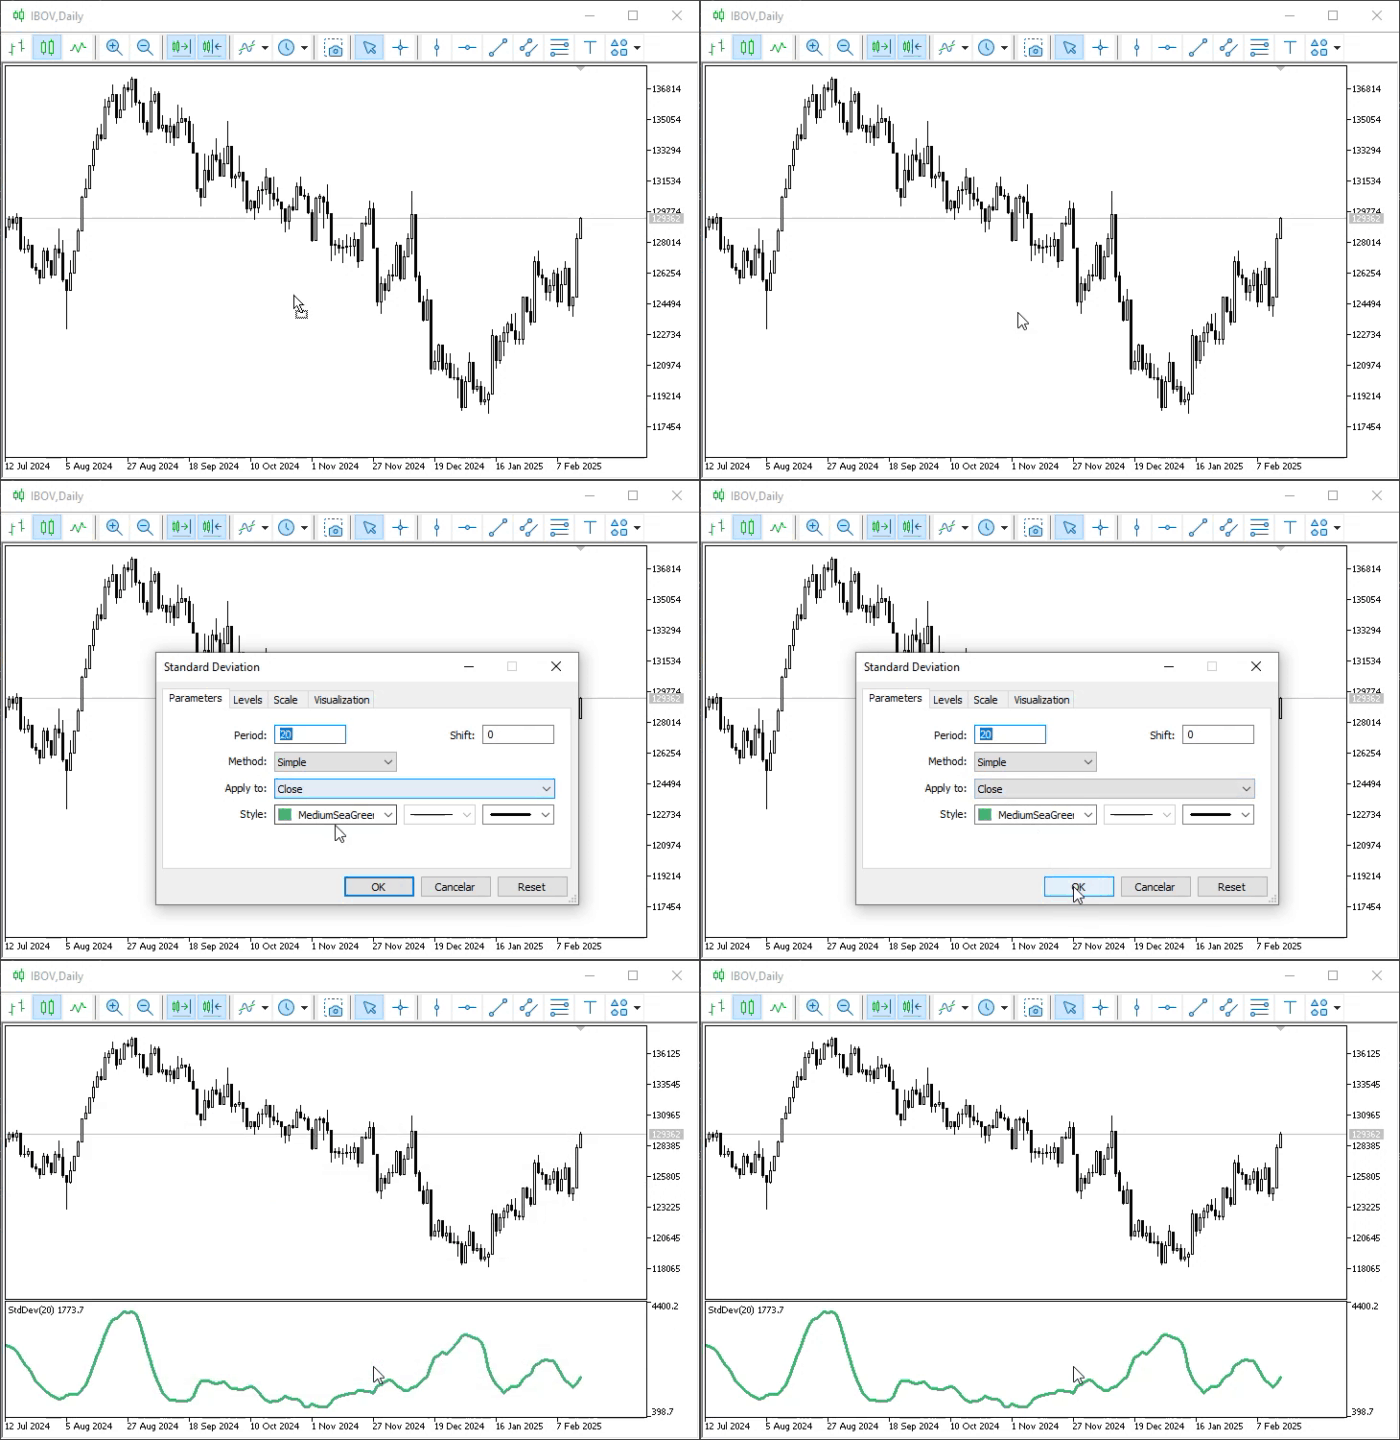
Animation 03
Now that we've done that, let's create a new indicator, and you'll immediately see why we need it. The code is shown below.
01. //+------------------------------------------------------------------+
02. #property copyright "Daniel Jose"
03. //+------------------------------------------------------------------+
04. #property description "DEMO Indicator"
05. //+------------------------------------------------------------------+
06. #property indicator_chart_window
07. #property indicator_plots           0
08. //+------------------------------------------------------------------+
09. int OnInit(void)
10. {
11.     for (int c0 = 0; c0 < (int)(ChartGetInteger(0, CHART_WINDOWS_TOTAL)); c0++)
12.         for (int c1 = (ChartIndicatorsTotal(0, c0) - 1); c1 >= 0; c1--)
13.             PrintFormat("In the sub window [%d] was found this indicator >>%s<<", c0, ChartIndicatorName(0, c0, c1));
14.
15.     return INIT_SUCCEEDED;
16. };
17. //+------------------------------------------------------------------+
18. int OnCalculate(const int rates_total, const int prev_calculated, const int begin, const double &price[])
19. {
20.     return rates_total;
21. };
22. //+------------------------------------------------------------------+
Code 05
The purpose of Code 05 is simply to display the names of the indicators present on the chart. This has already been discussed in previous articles; here, we'll go even further. So, when we run Code 05, we'll get the result shown in the following image.
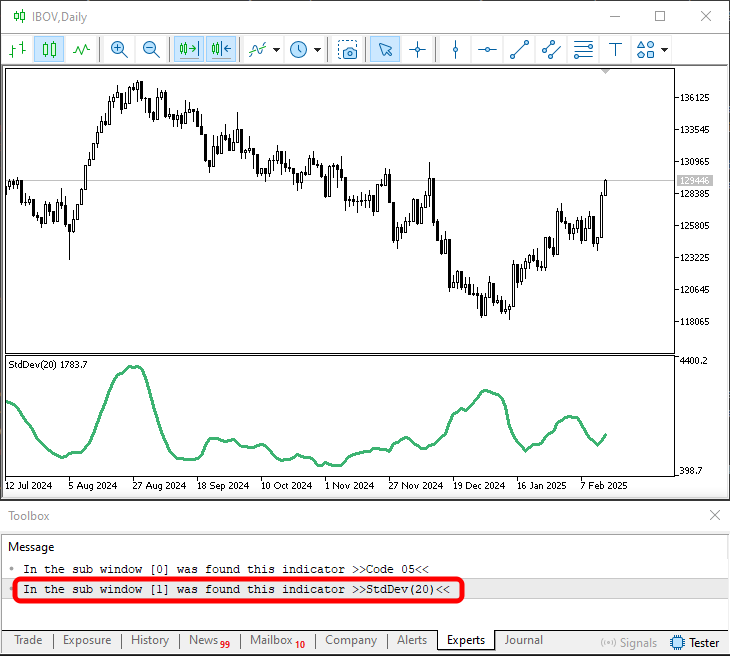
Image 04
01. //+------------------------------------------------------------------+
02. #property copyright "Daniel Jose"
03. //+------------------------------------------------------------------+
04. #property description "DEMO Indicator"
05. //+------------------------------------------------------------------+
06. #property indicator_chart_window
07. #property indicator_plots           0
08. //+------------------------------------------------------------------+
09. int OnInit(void)
10. {
11.     int index = -1;
12.
13.     for (int c0 = 0; (index < 0) && (c0 < (int)(ChartGetInteger(0, CHART_WINDOWS_TOTAL))); c0++)
14.         index = (ChartIndicatorName(0, c0, 0) == "StdDev(20)" ? c0 : index);
15.
16.     IndicatorSetString(INDICATOR_SHORTNAME, "Demo 123.");
17.     if (index >= 0)
18.         ChartIndicatorAdd(0, index, iCustom(NULL, NULL, "Examples\\Custom Moving Average", 20, 0, 0, PRICE_CLOSE));
19.
20.     return (index < 0 ? INIT_FAILED : INIT_SUCCEEDED);
21. };
22. //+------------------------------------------------------------------+
23. int OnCalculate(const int rates_total, const int prev_calculated, const int begin, const double &price[])
24. {
25.     return rates_total;
26. };
27. //+------------------------------------------------------------------+
Code 06
So, before we look at the result of running Code 06, I need to clarify one point. Please note which indicator we are using in line 18. In this case, I'm using an indicator built into MQL5 itself. This makes things much simpler and significantly reduces the number of points that would otherwise need to be explained here. However, this does not fully resolve the issue or make the code 100% functional. The reason is simple. Do you see the last argument in the iCustom call? So, this argument, PRICE_CLOSE, will cause the added indicator to perform its calculations using price data from the main chart. To use the values calculated by the indicator added in Animation 03, this argument must be different. It's not enough to simply change it; we need to take a different approach. We'll discuss this approach later, because in order to understand the reason behind it, we first need to explain another issue that hasn't yet been adequately covered in this series of articles. So please be patient.
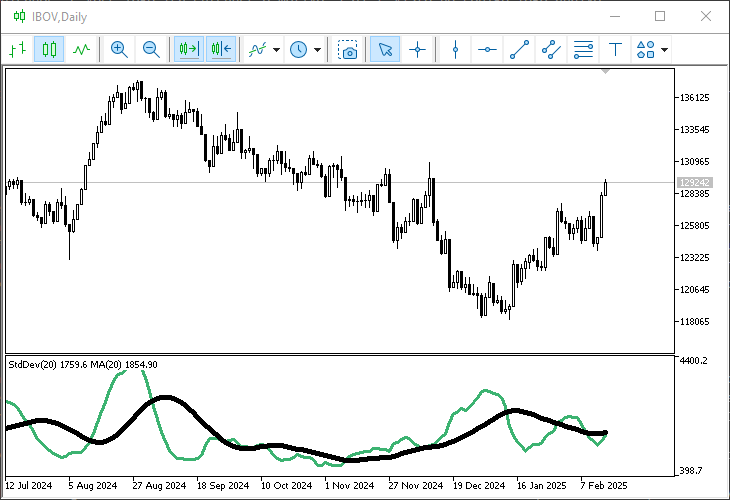
Image 05
Please note that when Code 06 is added to the chart, the indicator loaded in line 18 must look the same as the black line in Image 05. It is precisely for this reason, mentioned earlier, that the result will differ and will require adjustment by the user or operator. Check out the following animations to see how it's done.
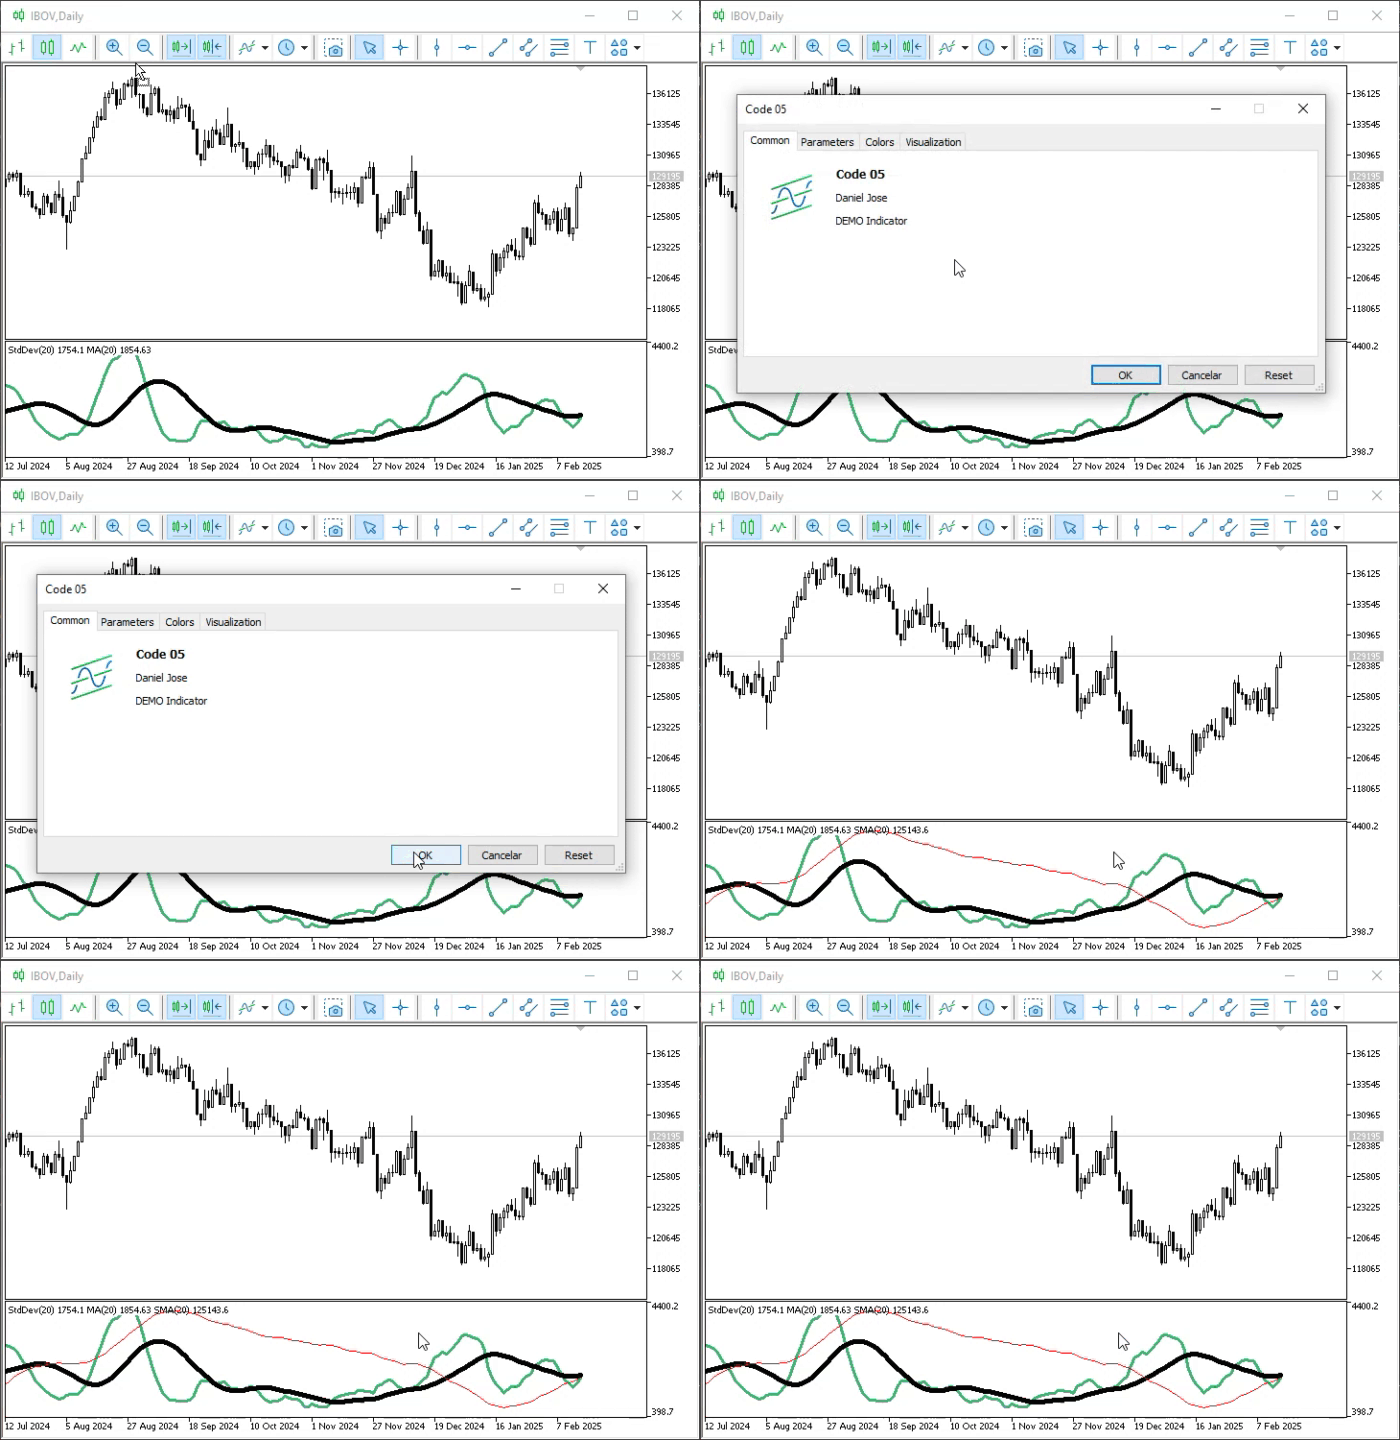
Animation 04
So, yes, Code 06 was able to add the desired indicator. However, the calculated values are incorrect because they are based on values derived from the symbol's quotes. So we'll have to make a slight adjustment.
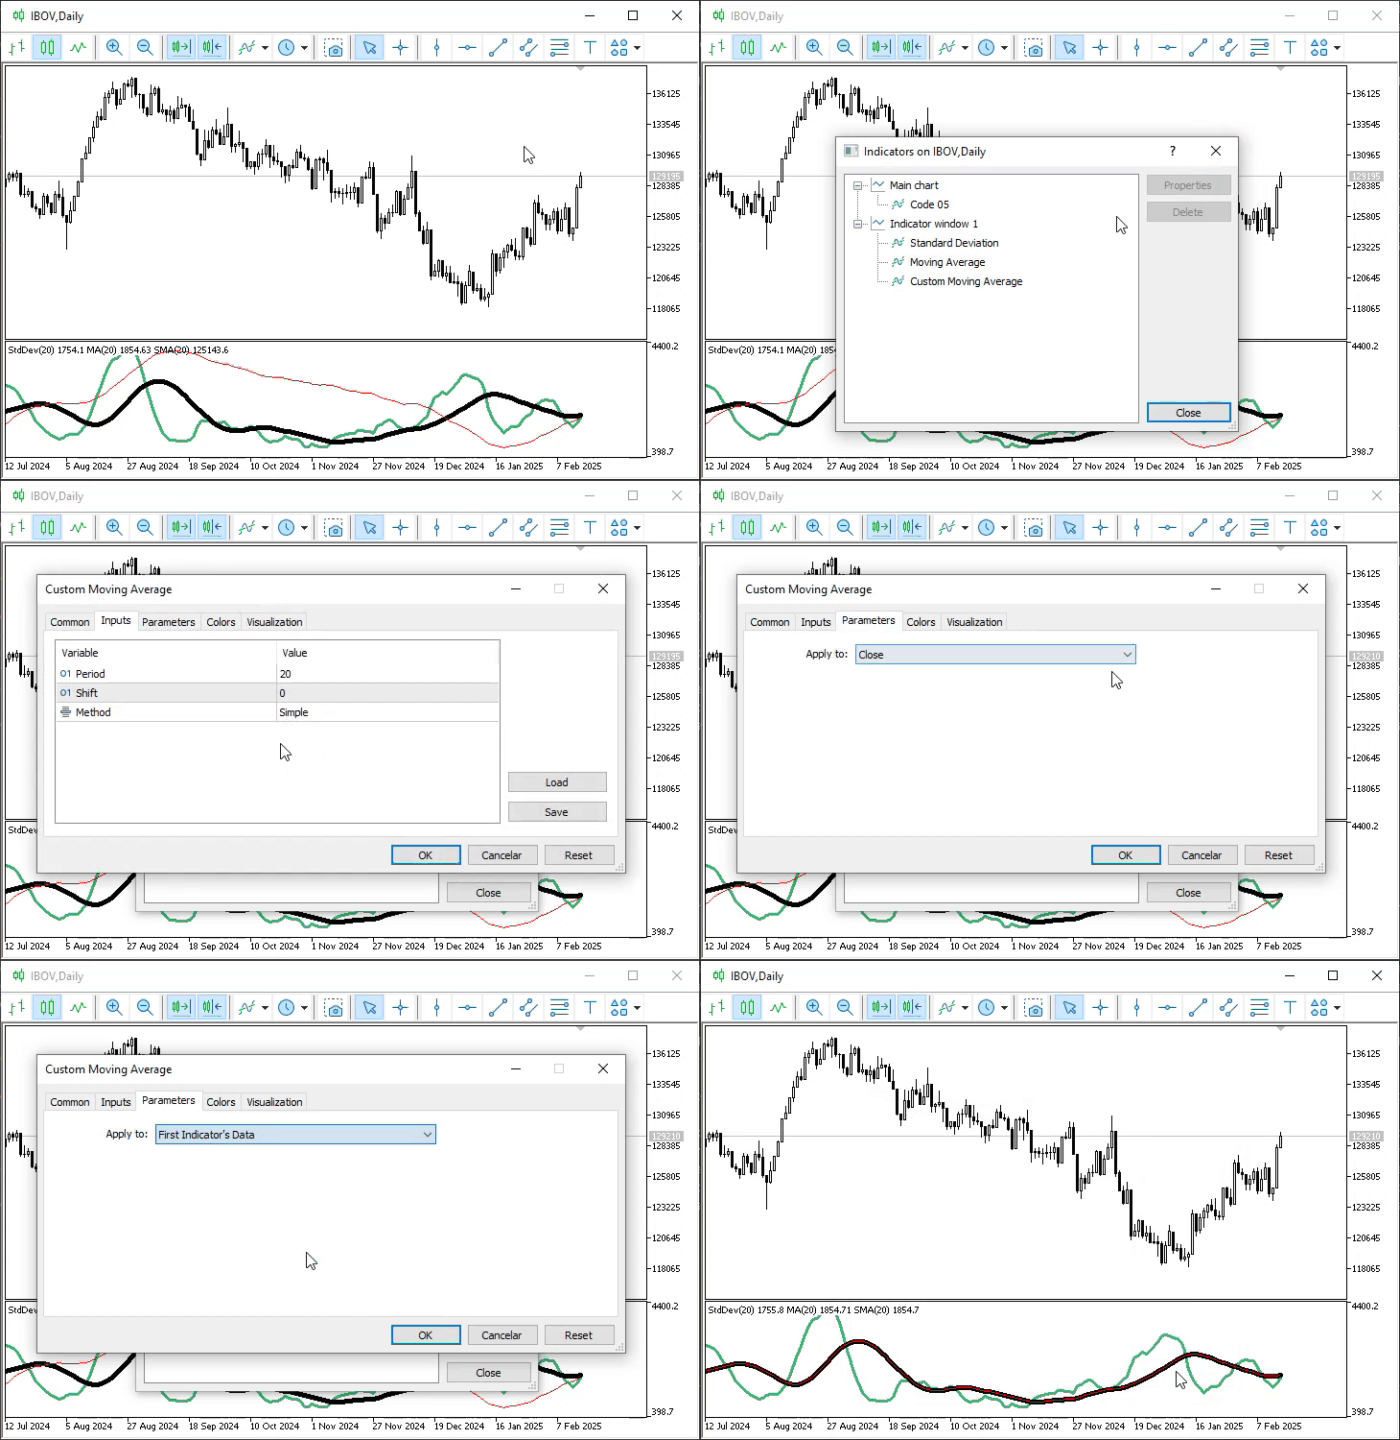
Animation 05
Concluding Thoughts
This article demonstrated a slightly more advanced approach to working with subwindows. Although what is discussed here is only a part of what I consider to be the foundation for a much more in-depth study, understanding this will help you make better use of the resources available in MetaTrader 5. To achieve this, we need to use MQL5 to better control what is displayed.
| MQ5 File | Description |
|---|---|
| Indicators\Code 01 | Basic Demonstration |
| Indicators\Code 02 | Basic Demonstration |
| Indicators\Code 03 | Basic Demonstration |
| Indicators\Code 04 | Basic Demonstration |
| Indicators\Code 05 | Basic Demonstration |
Translated from Portuguese by MetaQuotes Ltd.
Original article: https://www.mql5.com/pt/articles/17152
Warning: All rights to these materials are reserved by MetaQuotes Ltd. Copying or reprinting of these materials in whole or in part is prohibited.
This article was written by a user of the site and reflects their personal views. MetaQuotes Ltd is not responsible for the accuracy of the information presented, nor for any consequences resulting from the use of the solutions, strategies or recommendations described.



Write an article on how to create two sub-windows in a single indicator; that would be a real step forward!
Write an article on how to create two subwindows in a single indicator – that would be progress!