

From Basic to Intermediate: Subwindows (I)
 83
 0

Introduction
In my previous article, From Basic to Intermediate: Technical Indicators (II), I showed how easy it is to add several moving averages to the same indicator with almost no changes to the source code. This approach to organizing code is very useful when you need to change its behavior quickly and without unnecessary complications.
However, while this method is useful and interesting, it represents only a small part of what we can do with indicators added to a chart.
There are situations that call for a more thoughtful approach and a more effective use of MQL5's capabilities. When even that isn't enough, we also need to have a good understanding of how MetaTrader 5 works, since MQL5 is primarily used to control the platform's behavior and achieve the results we want. Many people believe that MQL5 is a general-purpose language, like C or C++, but that is not the case. Therefore, we need to understand just how far we can go with MQL5 before resorting to more drastic measures.
In some of my earliest articles published in this community, I presented one possible implementation in MetaTrader 5. At the time, I made the mistake of assuming that the community members already had sufficient programming experience. That's why I didn't explain properly why this implementation worked and what needed to be taken into account before adding it to the chart. Perhaps many people found it interesting, but they were unable to take advantage of it because they did not yet have the necessary knowledge.
And please don't get me wrong when I say that you probably aren't ready yet to understand how these applications work. On the contrary: stay motivated and eager to learn. A lack of knowledge is remedied not by pride, but by humility—which allows us to acknowledge that we still have much to learn from one another.
Well, if you're not entirely sure what I was talking about in the introduction, you can refer to the article “Multiple indicators on one chart (Part 03): Developing definitions for users”. Now it's time to put aside everything that's distracting you and focus on this article.
Using Subwindows (I)
In many cases, we need to display an indicator in a subwindow—or at least, that's more convenient for us. “Subwindow” might not be the best name, but as a friend of mine once said:
Programmers aren't very good at coming up with names.
In any case, this is the term that is used, and we will use it as well. Contrary to popular belief, it is usually not difficult to create an indicator to display in a subwindow, at least in the most common cases. However, certain situations can be confusing if you don't apply the right concepts: you develop certain expectations about how the system works, and then you discover that it works completely differently. This often happened in my early articles, which ended up raising more questions than they answered. As I said before, it was my mistake.
I assumed that articles were always intended for people with a certain level of experience, but that wasn't the case. That's why I decided to create a new profile dedicated exclusively to explaining the small details that influence the choices you make when tackling a practical task. In addition, I wanted to show beginners and enthusiasts how to approach writing code. That's how these articles came to be.
We have already covered topics ranging from the very basics, such as the syntax of basic statements, to more complex topics, such as operator overloading. There are still a few details of basic programming to explain, but that doesn't stop us from doing interesting and exciting things. I want to give you some time to get the hang of operator overloading—it is, without a doubt, the most difficult topic of all those we've covered so far. Therefore, in the next few articles, we will cover topics that are easier to understand, gradually increasing the level of difficulty.
That way, everyone can read them without feeling overwhelmed, since there's no need to read them in any particular order. Consider these articles a supplement to the MQL5 documentation, which you should always consult when you have questions.
So, what will this article be about? We'll take our first steps in working with a subwindow. Let's see how our code can use a subwindow, even if we didn't specifically program it to do so. Understanding this is essential for making sense of the other, more complex aspects that we will discuss later.
Since I don't want to write code from scratch and spend time explaining how it works, we'll use the code from the previous article to go through these first steps.
The source code is provided below.
01. //+------------------------------------------------------------------+
02. #property copyright "Daniel Jose"
03. //+------------------------------------------------------------------+
04. #property description "DEMO Indicator"
05. //+------------------------------------------------------------------+
06. const struct stAverange
07. {
08.    uint           nPeriods;
09.    ENUM_MA_METHOD Method;
10.    color          cor;
11. }Averange[] =
12. {
13.    {9, MODE_EMA, clrRed},
14.    {20, MODE_SMA, clrGreen},
15.    {50, MODE_SMA, clrBlue},
16.    {200, MODE_SMA, clrBlack}
17. };
18. //+----------------+
19. #property indicator_chart_window
20. #property indicator_applied_price   PRICE_CLOSE
21. #property indicator_buffers         Averange.Size();
22. #property indicator_plots           Averange.Size();
23. //+------------------------------------------------------------------+
24. struct stInfos
25. {
26.    double   Buff_iMA[];
27.    int      Handle;
28. }Infos[Averange.Size()];
29. //+------------------------------------------------------------------+
30. int OnInit(void)
31. {
32.    for (uint c = 0; c < Averange.Size(); c++)
33.    {
34.       SetIndexBuffer(c, Infos[c].Buff_iMA, INDICATOR_DATA);
35.       PlotIndexSetInteger(c, PLOT_DRAW_TYPE, DRAW_LINE);
36.       PlotIndexSetInteger(c, PLOT_LINE_STYLE, STYLE_SOLID);
37.       PlotIndexSetInteger(c, PLOT_LINE_WIDTH, 2);
38.       PlotIndexSetInteger(c, PLOT_LINE_COLOR, Averange[c].cor);
39.       PlotIndexSetString(c, PLOT_LABEL, StringFormat("%s of %d", (Averange[c].Method == MODE_EMA ? "Exponential" : "Arithmetica"), Averange[c].nPeriods));
40.       if ((Infos[c].Handle = iMA(NULL, NULL, Averange[c].nPeriods, 0, Averange[c].Method, _AppliedTo)) == INVALID_HANDLE)
41.       {
42.          Print("Could not start the indicator...");
43.          return INIT_FAILED;
44.       };
45.    }
46.
47.    return INIT_SUCCEEDED;
48. };
49. //+------------------------------------------------------------------+
50. int OnCalculate(const int rates_total, const int prev_calculated, const int begin, const double &price[])
51. {
52.    for (uint c = 0; c < Averange.Size(); c++)
53.    {
54.        ArrayInitialize(Infos[c].Buff_iMA, EMPTY_VALUE);
55.       CopyBuffer(Infos[c].Handle, 0, 0, Averange[c].nPeriods, Infos[c].Buff_iMA);
56.    }
57.
58.    return rates_total;
59. };
60. //+------------------------------------------------------------------+
61. void OnDeinit(const int reason)
62. {
63.    for (uint c = 0; c < Averange.Size(); c++)
64.       IndicatorRelease(Infos[c].Handle);
65. };
66. //+------------------------------------------------------------------+
Code 01
Code 01 contains an interesting compiler directive on line 19. It states that the indicator will use the window to which it is applied. "Oh, but that's obvious." You may not have realized what this means, dear reader. I DID NOT SAY that the indicator would use the window in which the bars are plotted. I said that it would use whichever window you add it to. Many people overlook this difference, make a serious mistake, and end up claiming that MetaTrader 5 is a terrible platform.
To make this easier to understand, we'll modify Code 01 by adding the snippet below.
01. //+------------------------------------------------------------------+
02. #property copyright "Daniel Jose"
03. //+------------------------------------------------------------------+
04. #property description "DEMO Indicator"
05. //+------------------------------------------------------------------+
06. const struct stAverange
07. {
08.    uint           nPeriods;
09.    ENUM_MA_METHOD Method;
10.    color          cor;
11. }Averange[] =
12. {
13.    // {9, MODE_EMA, clrRed},
14.    {20, MODE_SMA, clrGreen},
15.    // {50, MODE_SMA, clrBlue},
16.    // {200, MODE_SMA, clrBlack}
17. };
18. //+----------------+
                   .
                   .
                   .
Snippet 01
Now, only one of the moving averages will be plotted. If you're not sure what this change entails, please refer to my previous articles, where I've already explained it. I won't go into those details again here. After adding the indicator to the chart, we'll see the result shown in the following image.
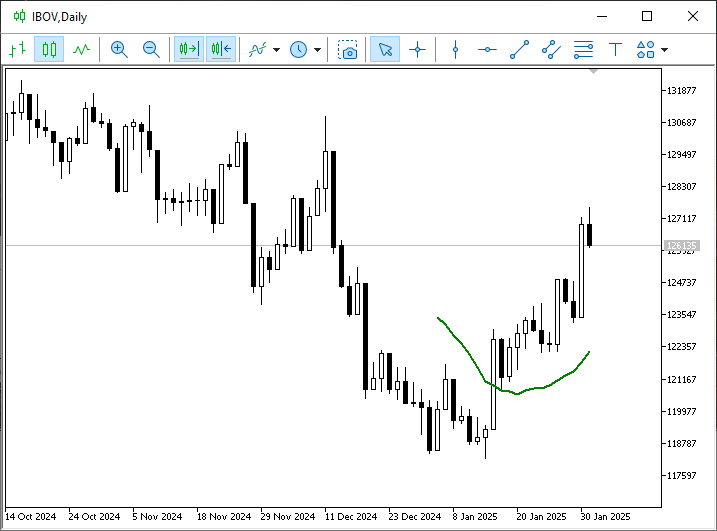
Image 01
Let's extend this moving average line so that it covers more bars. All you need to do is modify the code as shown in the following code snippet.
                   .
                   .
                   .
49. //+------------------------------------------------------------------+
50. int OnCalculate(const int rates_total, const int prev_calculated, const int begin, const double &price[])
51. {
52.    for (uint c = 0; c < Averange.Size(); c++)
53.    {
54.        ArrayInitialize(Infos[c].Buff_iMA, EMPTY_VALUE);
55.       CopyBuffer(Infos[c].Handle, 0, 0, Bars(NULL, NULL), Infos[c].Buff_iMA);
56.    }
57.
58.    return rates_total;
59. };
60. //+------------------------------------------------------------------+
                   .
                   .
                   .
Snippet 02
The result is shown below.
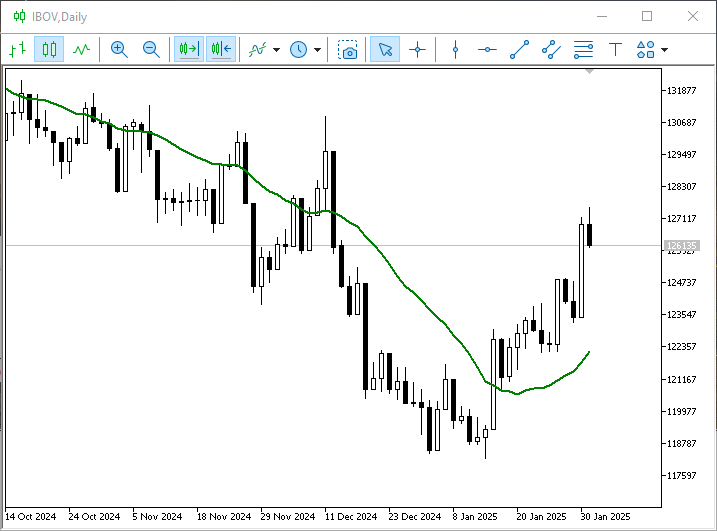
Image 02
All of this has already been explained. We have reached the point where I wanted to begin discussing another aspect.
Before writing code that uses a subwindow, you need to understand how MetaTrader 5 handles such subwindows. And yes, although this may seem simple to you, dear reader, many programmers and traders DO NOT KNOW HOW METATRADER 5 HANDLES SUBWINDOWS. Nevertheless, some people claim with absolute confidence that they have extensive experience using MetaTrader 5. Well, that's tragic, to say the least.
Among the preinstalled MetaTrader 5 indicators, there are several that use a subwindow. For our purposes, we'll choose the classic option—the Volumes indicator. After adding it to the chart, the view shown in Image 02 will change to look like the one in the following image.
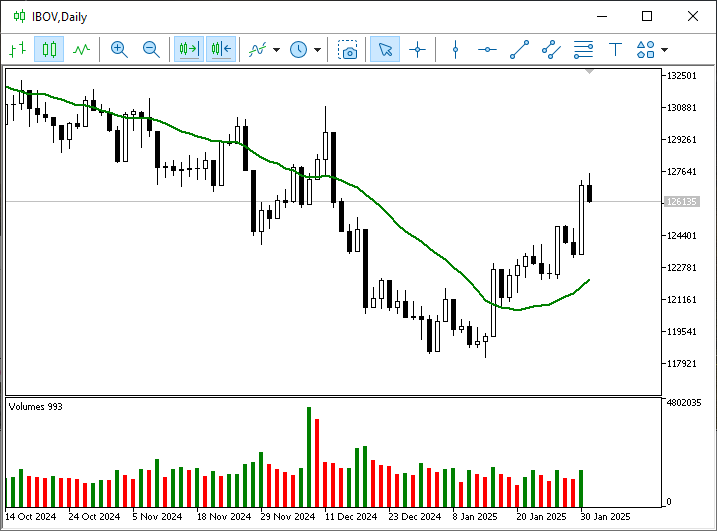
Image 03
The window you see at the bottom of the chart is a subwindow. Now, pay attention. The subwindow is linked to the main window in some way, but it has its own mechanisms and settings. We can even modify it so that it functions as what we would consider the main window. "Wait, now you've got me confused. Are you saying that the window at the bottom of the chart can be used as if it were the main window?" Yes, dear reader, that's exactly right. But if you do that, you'll have to take the consequences into account.
Since this is only the first article in which we address this topic, I won't go into detail just yet. You'll understand this better as new articles are published.
Let's get back to our main question. Do you remember line 19 of our code? So, now we want to do something that, as far as I know, is quite common. Many traders do not monitor the volume displayed in the subwindow directly; instead, they add a moving average and analyze that. But wait—how do you plot a moving average based on this volume?
This is precisely one of the steps that many people don't know how to perform. And when they try to do so, they usually make mistakes, which significantly undermines the analysis they wanted to conduct.
To see the problem, watch the following animation.
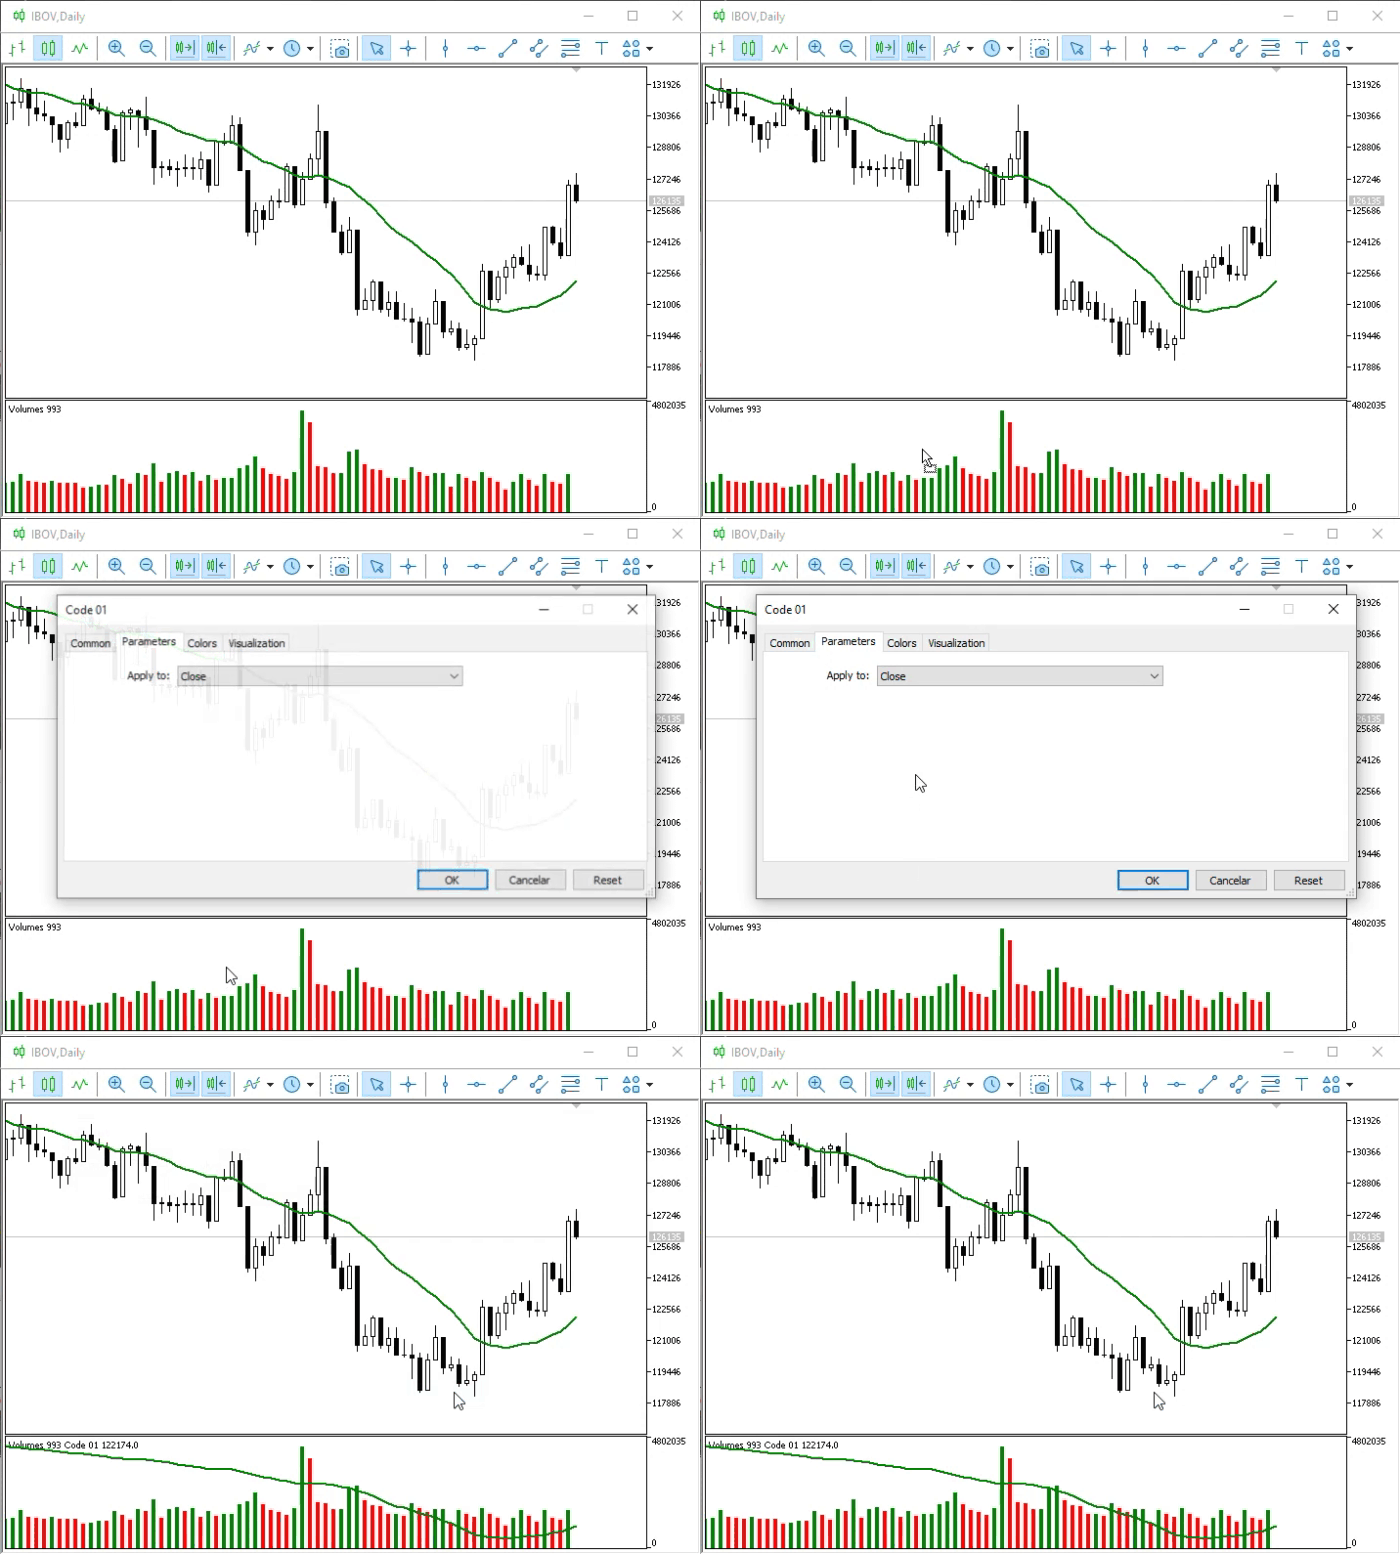
Animation 01
In a sense, Animation 01 shows the correct way to add an indicator to a subwindow. However, take a look at the curve traced by the moving average. This is clearer in the following image.
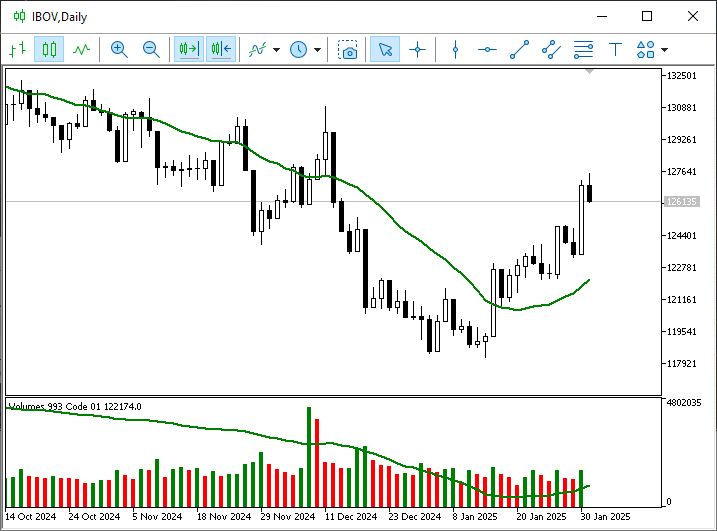
Image 04
Here we can see that the moving average curve DOES NOT REFLECT THE VOLUME CURVE. The moving average displayed in the subwindow mirrors the price movements in the main window. That's not what the trader wanted. So, drawing on his experience with MetaTrader 5, he does what is shown in the following animation.
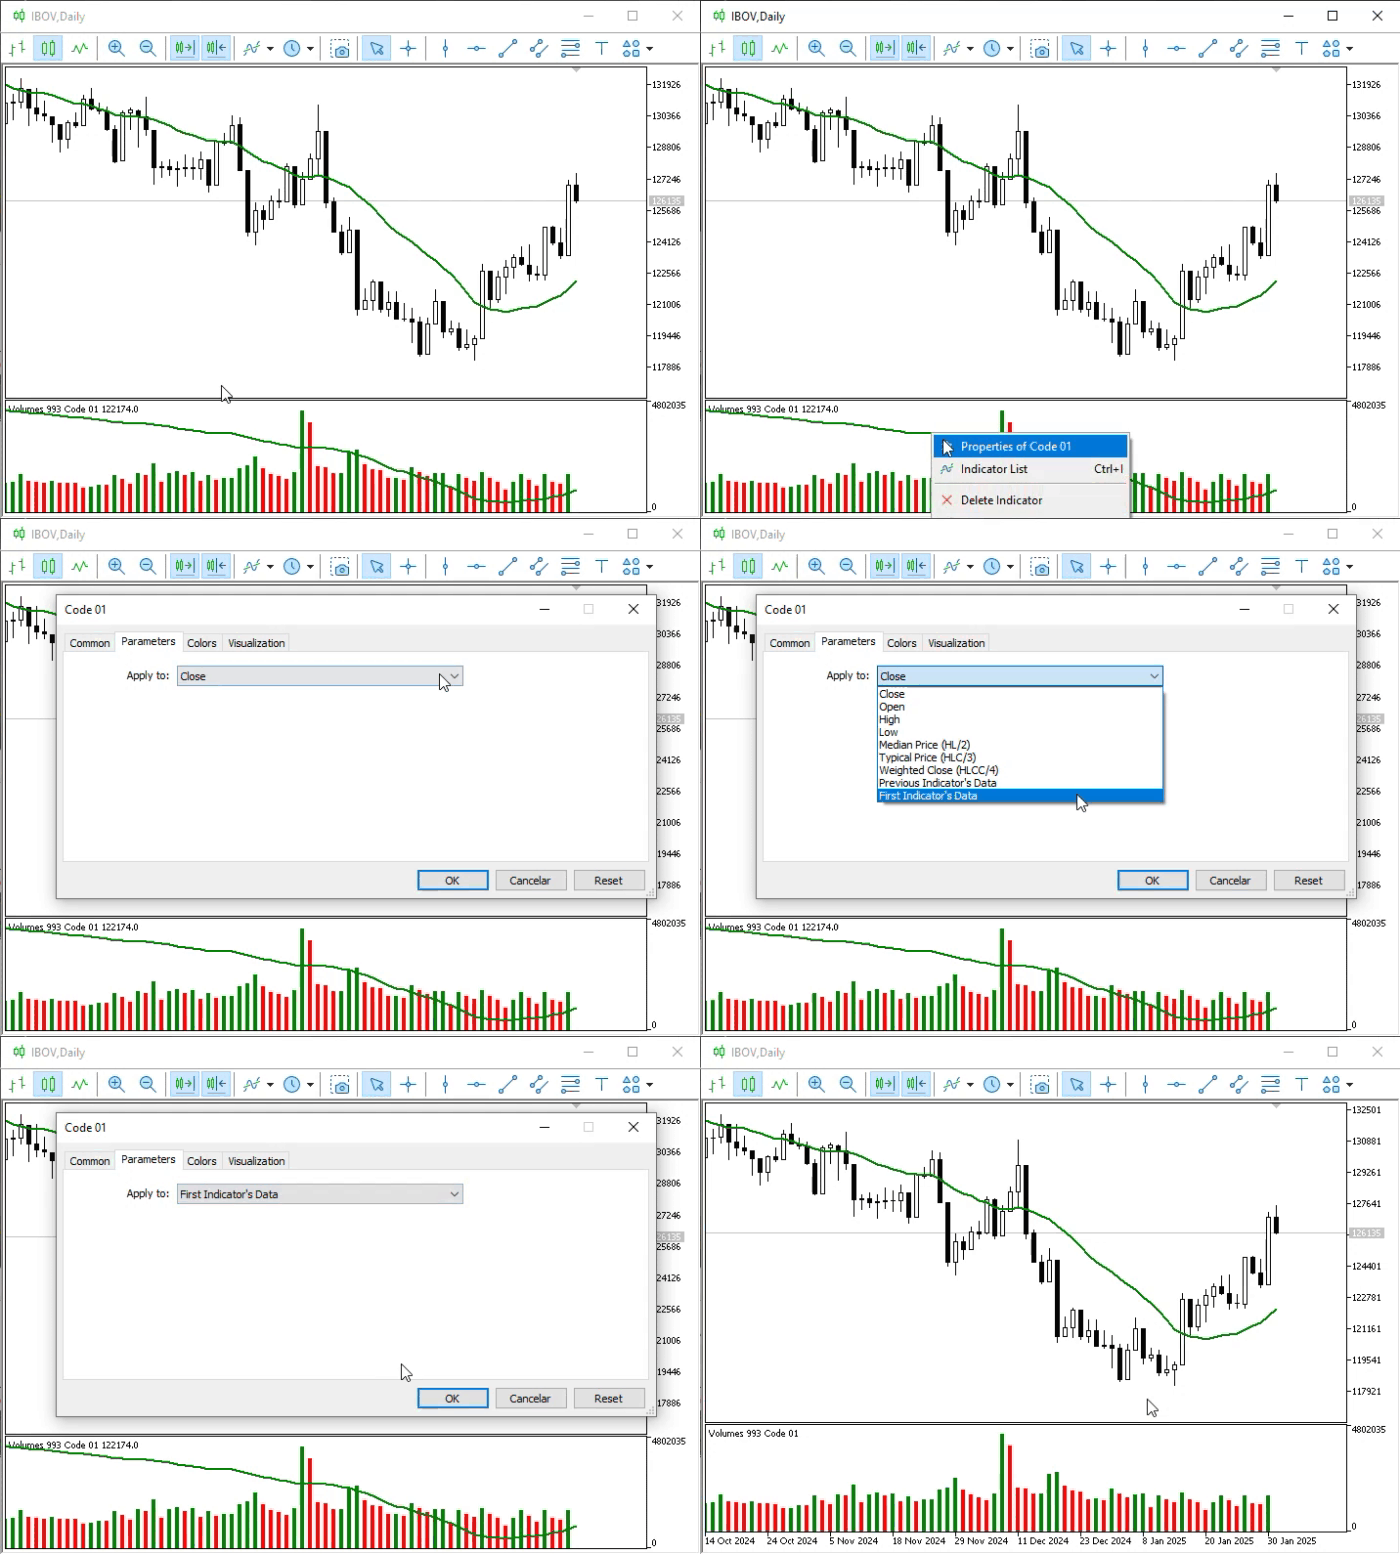
Animation 02
But what happened? Where is the moving average of volume? Something happened. To find this out, the trader opens the trading platform and sees the following message.
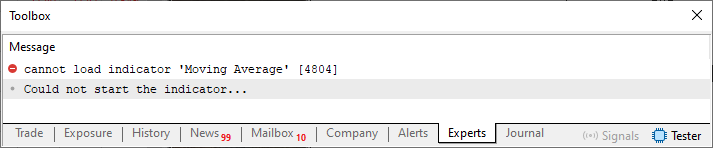
Image 05
"Well, now we really have a problem. Oh, I see: it's the platform's fault." Wait a minute, dear reader. It's not the platform's fault—it's yours, or, more precisely, the fault of the programmer who wrote the indicator's code. "Wait, did we program it? Are you saying we're incompetent?" That's not the point, dear reader. As I mentioned at the beginning of this article, we need to humbly acknowledge that we don't know everything and that we can always learn something from one another.
The problem really lies in the indicator's code. Do you remember how, in previous articles, I explained how and why technical indicators work? Its calculations work well, as the images show: the moving average curve is displayed correctly in the main window of the chart. However, THEY ARE NOT SUITABLE for calculations based on data from other indicators whose values MetaTrader 5 does not know. If we change the data source and use a different indicator—in this case, the Volumes indicator—the iMA technical indicator we are using is simply not calculated. MetaTrader 5 does not know what values the Volumes indicator contains, so the code fails, producing the result shown in Image 05. So admit it: we don't always know what we're doing. Admitting this with humility usually helps us understand the situation correctly.
"Hmm, okay. But then I'll ask you: how can we solve this? There must be some solution, right?" Yes, there is, dear reader. This is where the topic gets more interesting, though also a little more complicated. We'll have to implement the moving average calculation ourselves, without relying on MetaTrader 5; in other words, we won't be able to use the existing technical indicators. That is precisely where the difficulty lies: when programming such calculations, many people make mistakes—either in the calculation itself or when writing code that consumes far more resources than necessary.
So only do what we're going to do here as a last resort, or if you're absolutely sure of what you're doing. Any mistake you make will be your responsibility. Now that we've cleared that up, we can start writing the code.
To start, let's simplify Code 01 a little. It will look as shown below.
01. //+------------------------------------------------------------------+
02. #property copyright "Daniel Jose"
03. //+------------------------------------------------------------------+
04. #property description "DEMO Indicator"
05. //+------------------------------------------------------------------+
06. const struct stAverange
07. {
08.     int            nPeriods;
09.     ENUM_MA_METHOD Method;
10.     color          cor;
11. }Averange[] =
12. {
13.     {9, MODE_EMA, clrRed},
14.     {20, MODE_SMA, clrGreen},
15. };
16. //+----------------+
17. #property indicator_chart_window
18. #property indicator_applied_price   PRICE_CLOSE
19. #property indicator_buffers         Averange.Size();
20. #property indicator_plots           Averange.Size();
21. //+------------------------------------------------------------------+
22. struct stInfos
23. {
24.     double   Buff_iMA[];
25. }Infos[Averange.Size()];
26. //+------------------------------------------------------------------+
27. int OnInit(void)
28. {
29.     for (uint c = 0; c < Averange.Size(); c++)
30.     {
31.         SetIndexBuffer(c, Infos[c].Buff_iMA, INDICATOR_DATA);
32.         PlotIndexSetInteger(c, PLOT_DRAW_TYPE, DRAW_LINE);
33.         PlotIndexSetInteger(c, PLOT_LINE_STYLE, STYLE_SOLID);
34.         PlotIndexSetInteger(c, PLOT_LINE_WIDTH, 2);
35.         PlotIndexSetInteger(c, PLOT_LINE_COLOR, Averange[c].cor);
36.         PlotIndexSetString(c, PLOT_LABEL, StringFormat("%s of %d", (Averange[c].Method == MODE_EMA ? "Exponential" : "Arithmetica"), Averange[c].nPeriods));
37.     }
38.
39.        return INIT_SUCCEEDED;
40. };
41. //+------------------------------------------------------------------+
42. int OnCalculate(const int rates_total, const int prev_calculated, const int begin, const double &price[])
43. {
44.     for (uint c = 0; c < Averange.Size(); c++)
45.     {
46.     }
47.
48.     return rates_total;
49. };
50. //+------------------------------------------------------------------+
Code 02
This is the code we'll be using as a starting point. I removed a few sections, most notably the one that gave us access to the iMA technical indicator. Now we'll add a few elements that will help us with our calculations. To do this, we'll modify Code 02 as shown in the following code snippet.
                   .
                   .
                   .
21. //+------------------------------------------------------------------+
22. struct stInfos
23. {
24.     double  Buff_iMA[],
25.             f_Expo;
26. }Infos[Averange.Size()];
27. //+------------------------------------------------------------------+
28. int OnInit(void)
29. {
30.     for (uint c = 0; c < Averange.Size(); c++)
31.     {
32.         SetIndexBuffer(c, Infos[c].Buff_iMA, INDICATOR_DATA);
33.         Infos[c].f_Expo = (double) (2.0 / (1.0 + Averange[c].nPeriods));
34.         PlotIndexSetInteger(c, PLOT_DRAW_TYPE, DRAW_LINE);
35.         PlotIndexSetInteger(c, PLOT_LINE_STYLE, STYLE_SOLID);
36.         PlotIndexSetInteger(c, PLOT_LINE_WIDTH, 2);
37.         PlotIndexSetInteger(c, PLOT_LINE_COLOR, Averange[c].cor);
38.         PlotIndexSetString(c, PLOT_LABEL, StringFormat("%s of %d", (Averange[c].Method == MODE_EMA ? "Exponential" : "Arithmetica"), Averange[c].nPeriods));
39.     }
40.
41.        return INIT_SUCCEEDED;
42. };
43. //+------------------------------------------------------------------+
                   .
                   .
                   .
Snippet 03
Now that we have the necessary foundation, we can focus on the calculations. We'll implement this as shown in the following code snippet.
                   .
                   .
                   .
43. //+------------------------------------------------------------------+
44. int OnCalculate(const int rates_total, const int prev_calculated, const int begin, const double &price[])
45. {
46.     int c0 = 0;
47.
48.     for (uint c = 0; c < Averange.Size(); c++)
49.     {
50.         if (prev_calculated == 0)
51.         {
52.             double loc = 0;
53.             for (int c1 = 0; c1 < Averange[c].nPeriods; c1++) loc += price[Averange[c].nPeriods - c1];
54.             Infos[c].Buff_iMA[Averange[c].nPeriods] = loc / Averange[c].nPeriods;
55.         }
56.         switch (Averange[c].Method)
57.         {
58.             case MODE_EMA:
59.                 for (c0 = (prev_calculated > 0 ? prev_calculated - 1 : 0); c0 < rates_total; c0++)
60.                     Infos[c].Buff_iMA[c0] = (c0 > 0 ? (((price[c0] - Infos[c].Buff_iMA[c0 - 1])) * Infos[c].f_Expo) + Infos[c].Buff_iMA[c0 - 1] : Infos[c].Buff_iMA[c0]);
61.                 break;
62.             case MODE_SMA:
63.                 for (c0 = (prev_calculated > 0 ? prev_calculated - 1 : Averange[c].nPeriods + 1); c0 < rates_total; c0++)
64.                     Infos[c].Buff_iMA[c0] = ((Infos[c].Buff_iMA[c0 - 1] * Averange[c].nPeriods) - price[c0 - Averange[c].nPeriods] + price[c0]) / Averange[c].nPeriods;
65.                 break;
66.         }
67.     }
68.
69.     return rates_total;
70. };
71. //+------------------------------------------------------------------+
Snippet 04
I won't go into the details of these calculations, to keep the explanation brief. At this point, I'm sure you already understand what they do. Keep in mind that this example is for educational purposes only and is not the most efficient way to perform the calculation: MQL5 itself offers much faster options.
After compiling Code 02 with the changes from both code snippets, we'll be able to see how it works. First, let's add the indicator directly to the main window, as shown in the following animation.
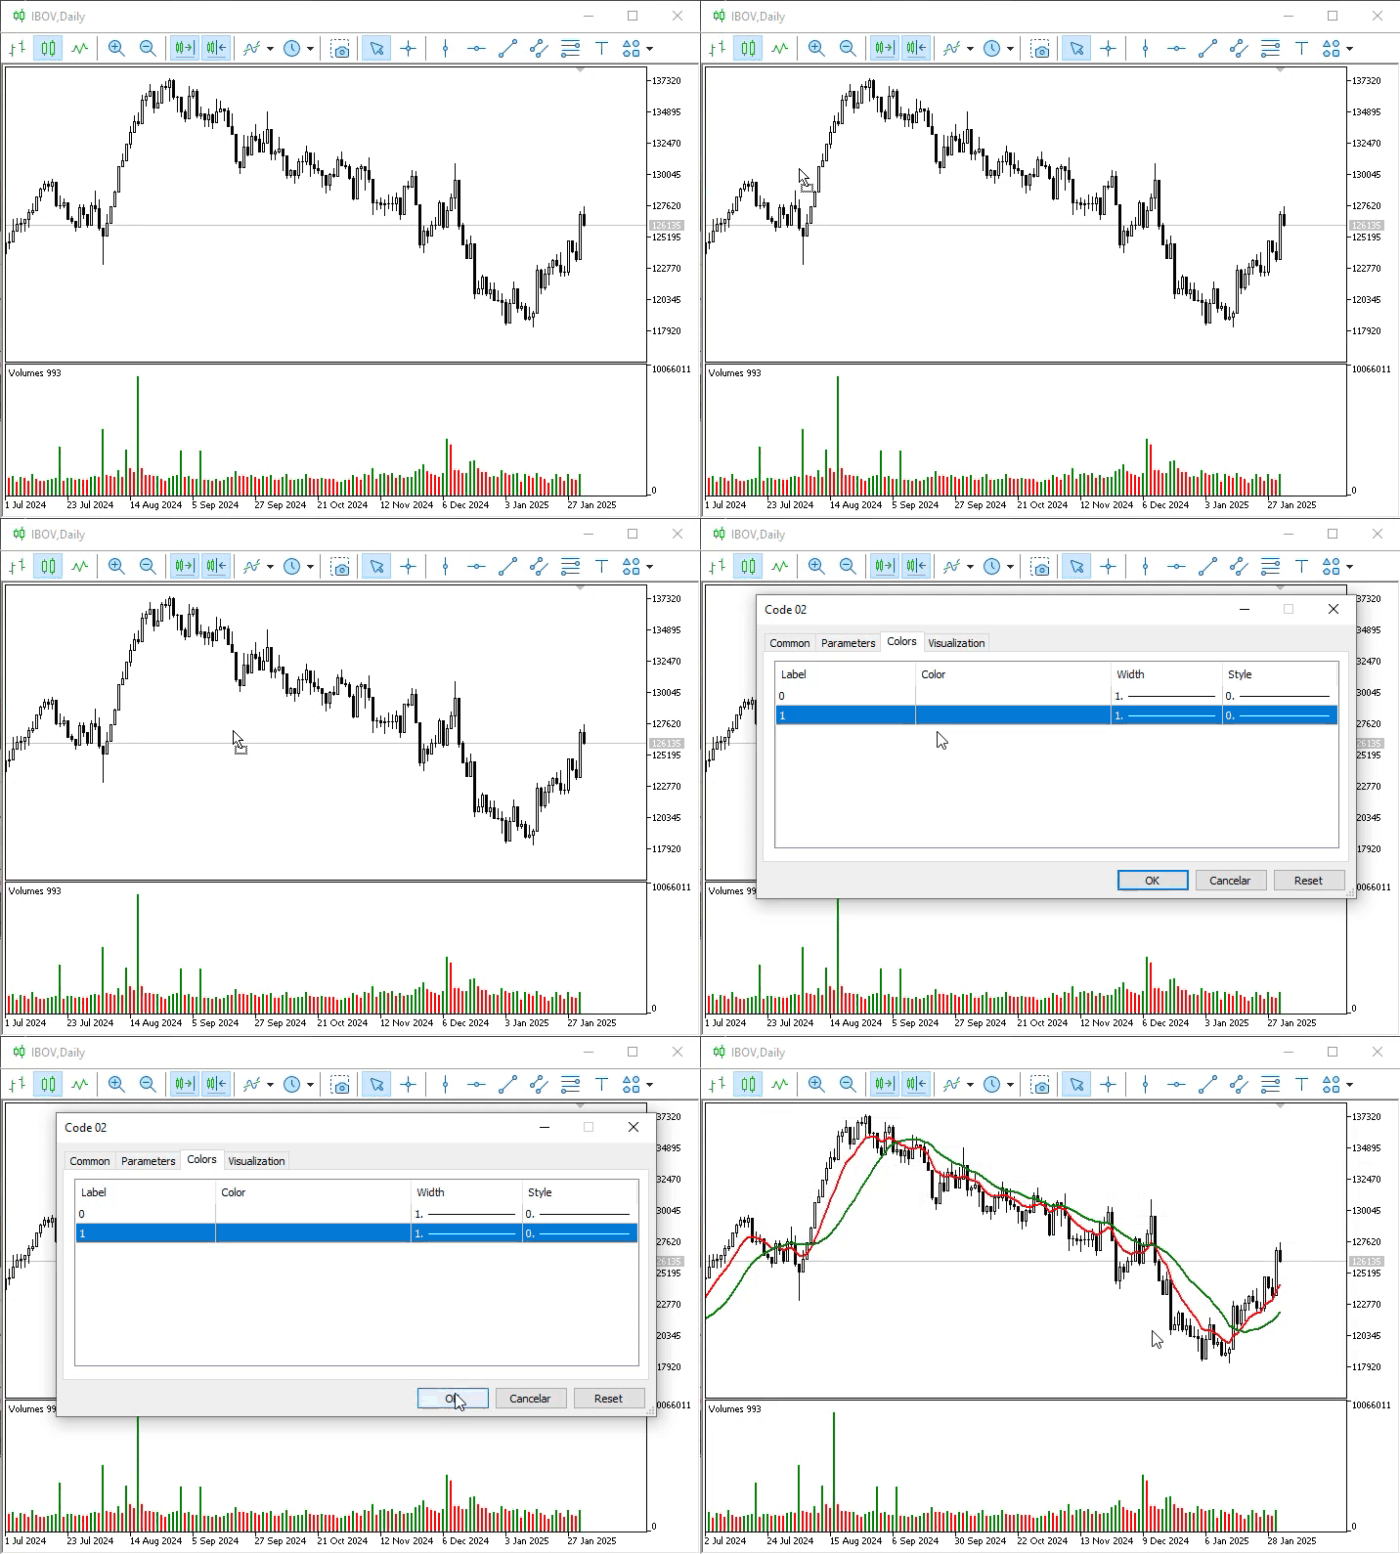
Animation 03
Please note that everything is working. To check whether the moving averages are calculated correctly, use the same principle we demonstrated in previous articles. It's always a good idea to make sure there are no errors in your calculations. Then we can move on to the next step: adding the indicator to the subwindow where volume is displayed. We'll do it the same way as before, as shown in the following animation.
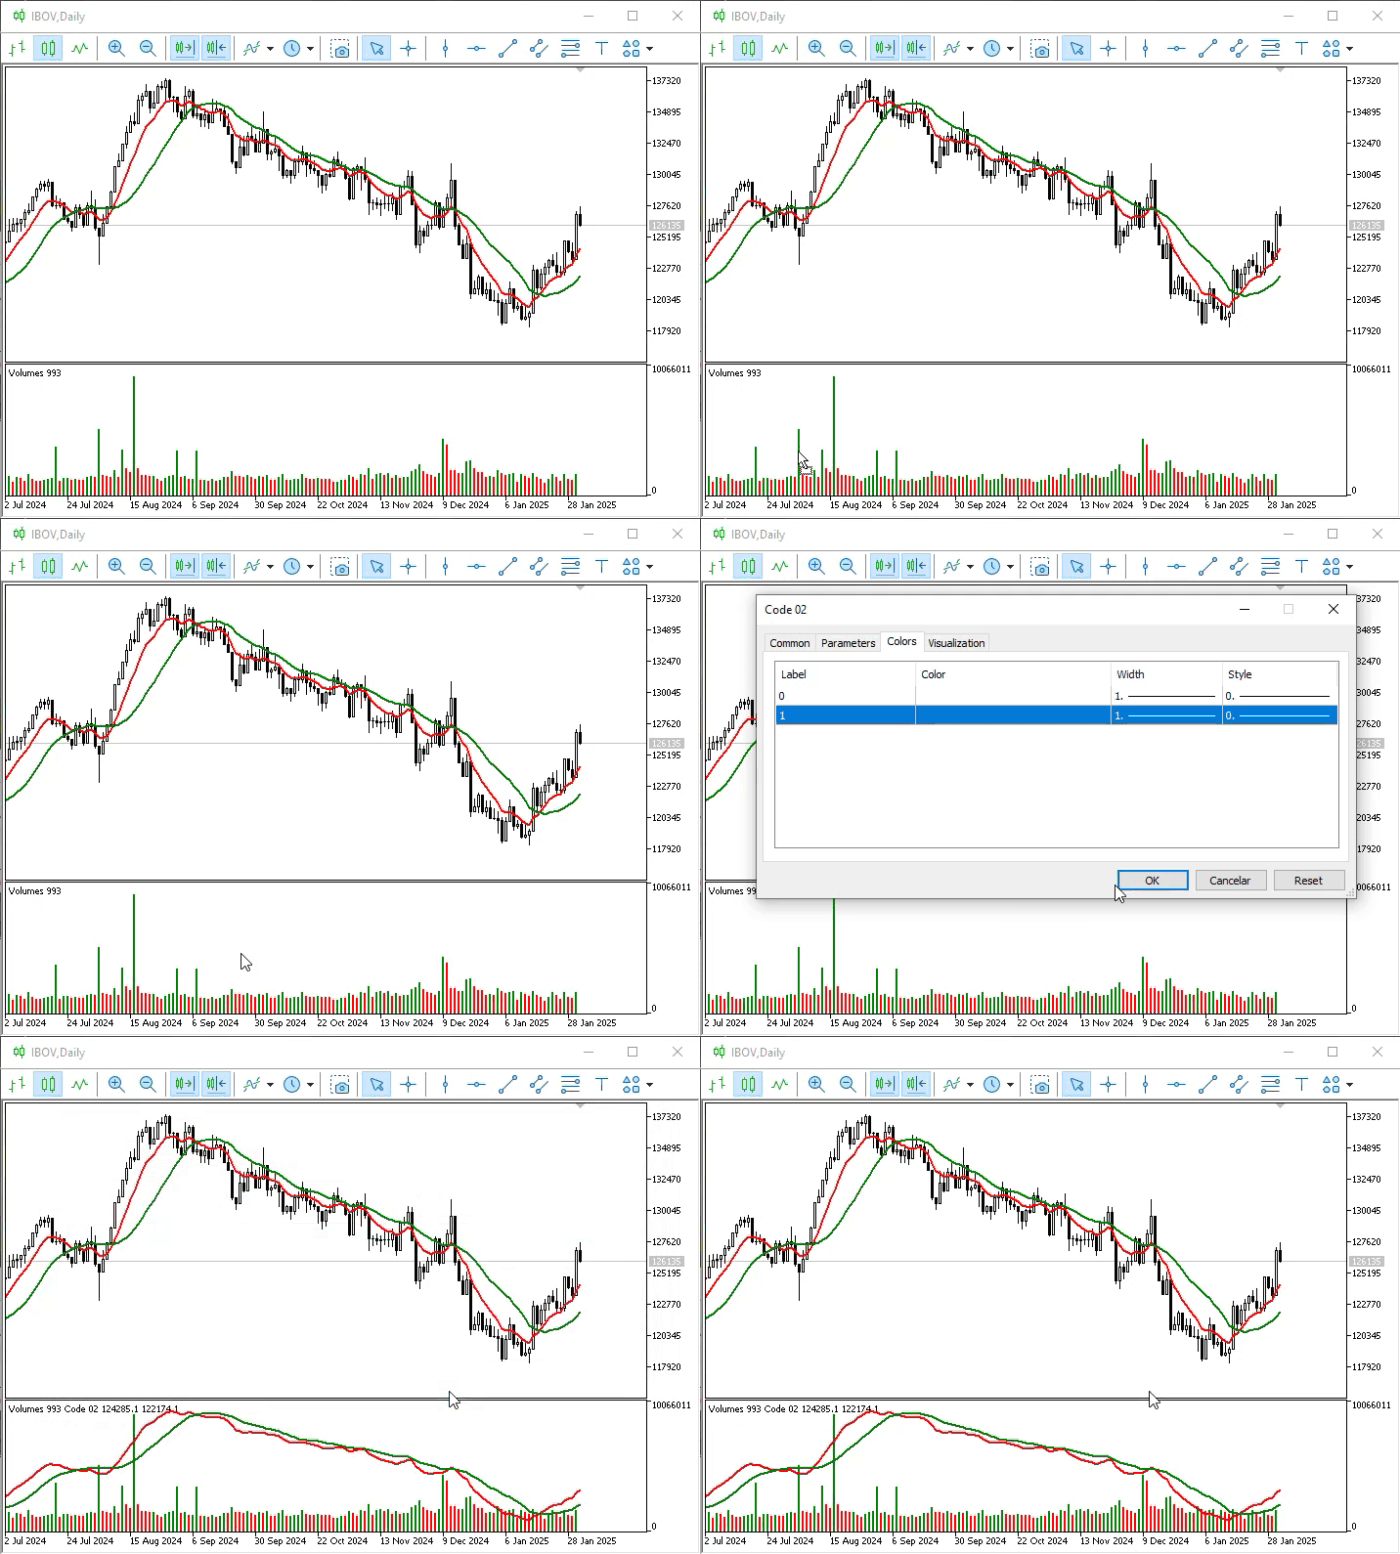
Animation 04
Please note that the moving average curve retains the same shape as in the area where the price bars are displayed. This means that we are seeing an average of prices rather than of volume, as expected. The following image clearly illustrates this.
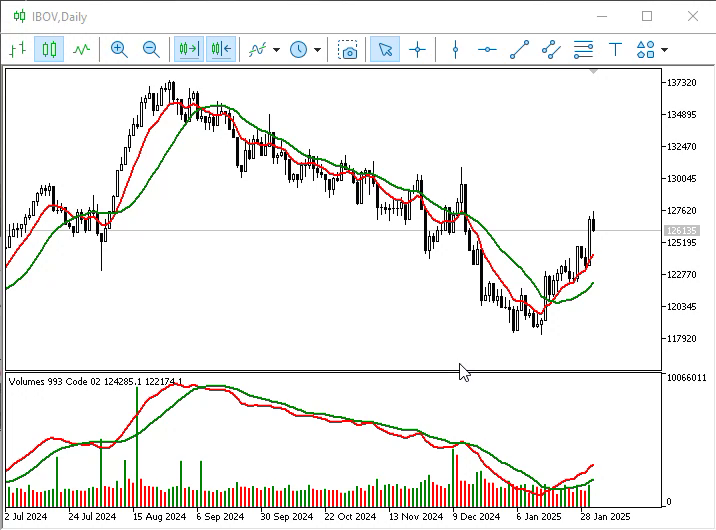
Image 06
So, the next step is to make the change shown in the following animation.
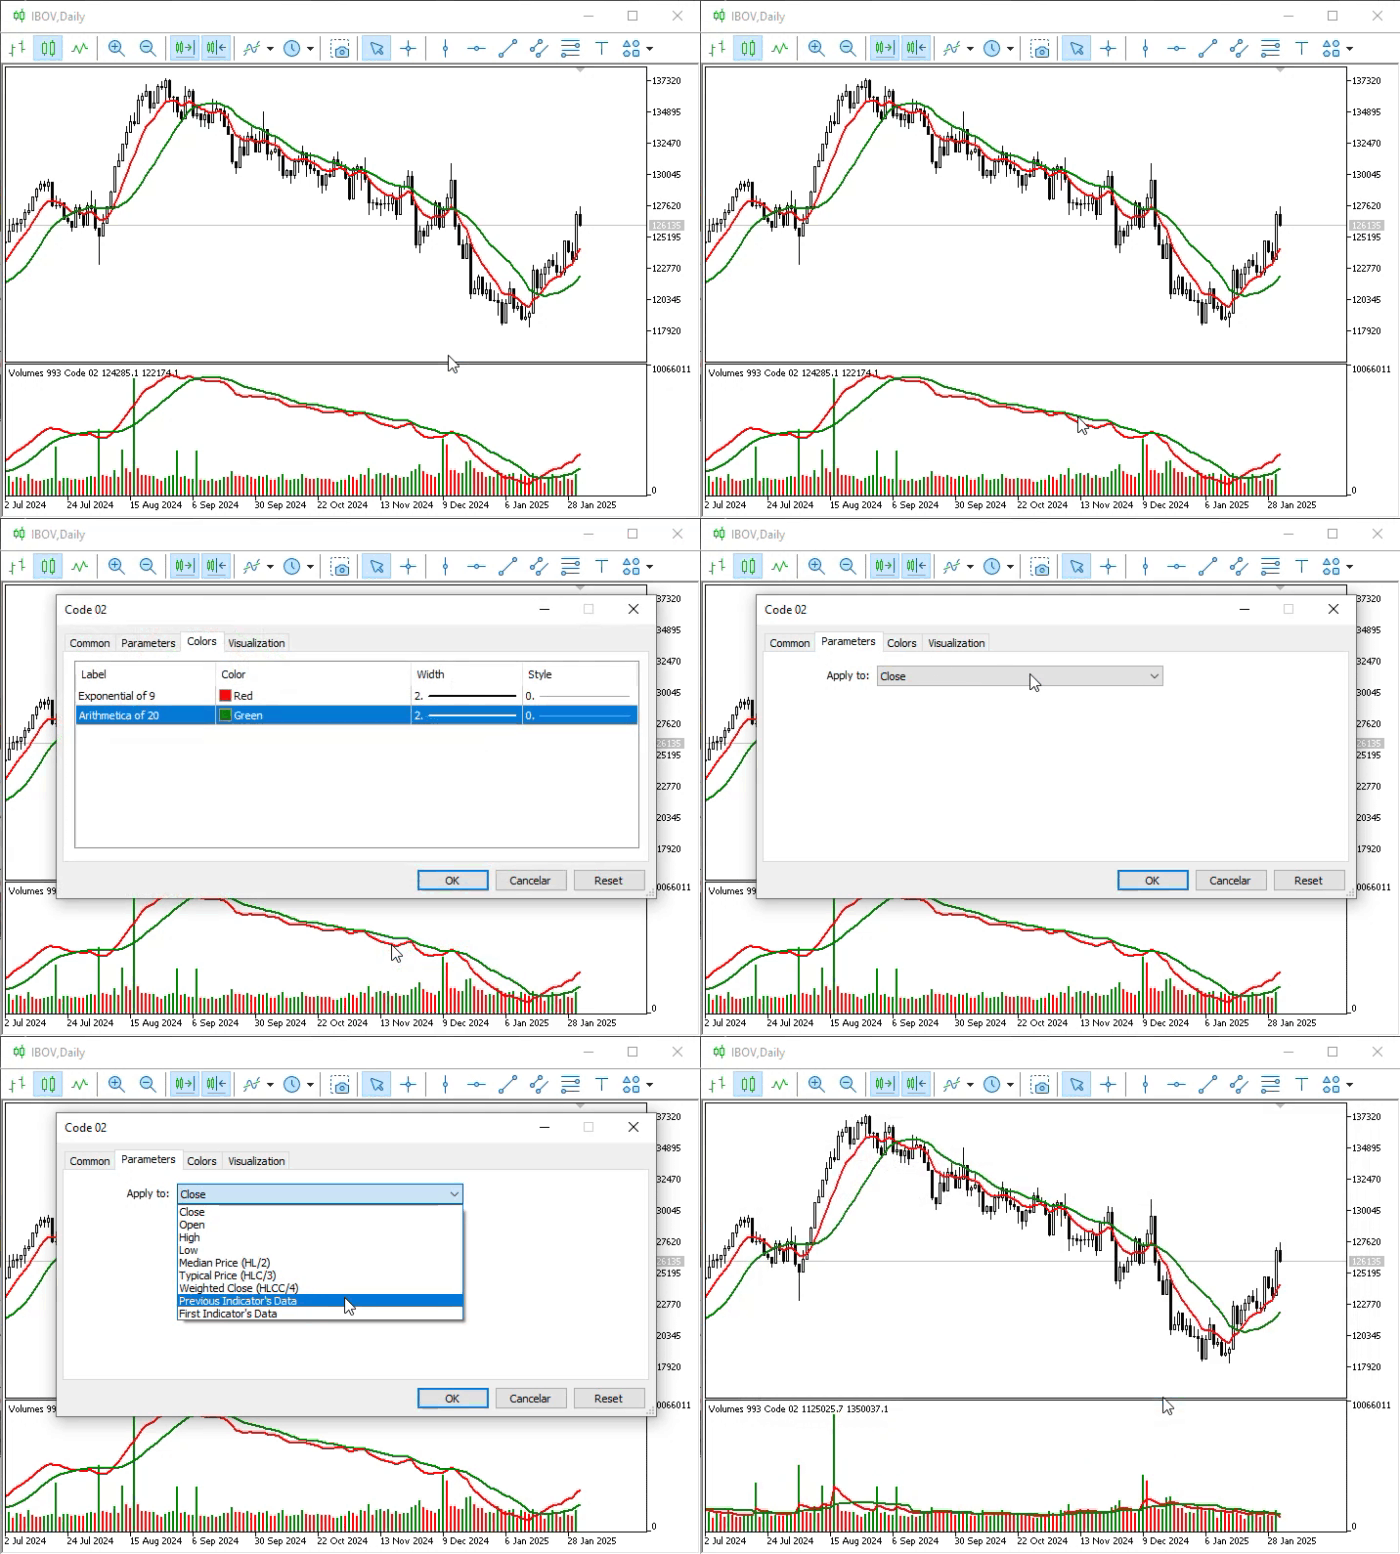
Animation 05
It finally worked out! Perhaps the animation is too fast to notice this, so let's take a closer look at the final frames of Animation 05, shown in the following image.
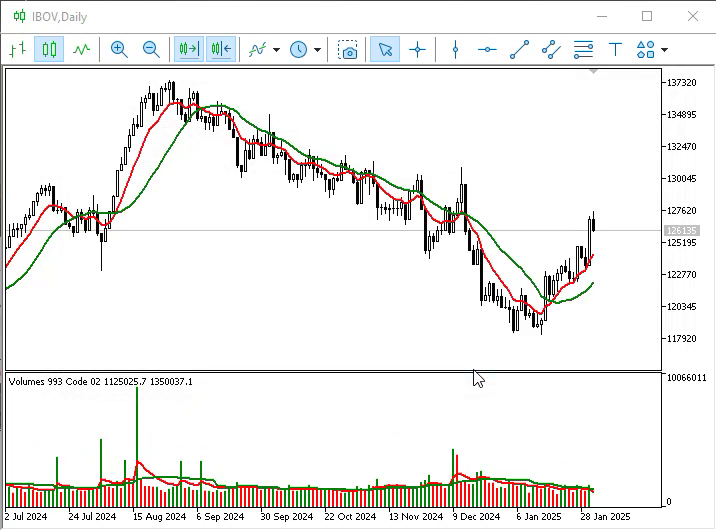
Image 07
Now we actually have an indicator that works correctly and is suitable for a much wider range of situations, including use in subwindows. But wait—before you finish the article, could you explain a few things we've covered? Of course, dear reader. Tell me what you're unsure about.
My first question is this: I’ve noticed that both Code 01 and Code 02 use the indicator_chart_window property. As far as I can tell from the documentation, this property specifies that the indicator will be displayed in the main window, rather than in any other window. However, you mentioned here that some indicators create a new window or subwindow. In the animations, the Volumes indicator creates a subwindow, and our indicator appears inside it. Why? Shouldn't it remain tied to the main window where the bars are displayed? That's an excellent question, dear reader. Before moving on to the next question, let's figure out why our indicator is displayed in a subwindow, even though we're using the `indicator_chart_window` property. It is precisely this point that often confuses many beginners.
To answer your question without overcomplicating the explanation, let's take another look at the animations—specifically 02 and 04—in which we added the indicator to the chart. Please note that in both cases, we drag the indicator and drop it in a specific location: inside the subwindow created by the Volumes indicator.
Pay special attention to this detail, because it plays a decisive role. MetaTrader 5 determines where we dropped the indicator, and when loading an indicator that uses the `indicator_chart_window` property, it treats that subwindow as the main window for that indicator. This is where most of the confusion arises: MetaTrader 5 WILL NOT AUTOMATICALLY CHANGE THE INDICATOR'S DATA SOURCE so that it uses the values from this subwindow. As a trader, you must manually change the data source used by the indicator, as we saw in the animations.
Many users are switching from other platforms where this setting is configured automatically, such as PROFIT, which is widely used by traders in Brazil. When they see that the moving average isn't behaving as they expected, they end up being dissatisfied with MetaTrader 5.
"I think I understand everything now. But I have one more question. In animations 02 and 05, when you change the input data source, you select “FIRST INDICATOR'S DATA”, although you could also select “PREVIOUS INDICATOR'S DATA”. Why do you prefer one option over the other?" Wow, we have a very attentive reader here. I like this question. It's still too early to explain this in detail, but I'll try to show you the reason without going into all the details. We'll get to that later.
To help you understand why I chose one parameter over another in these animations, we'll modify code 02 as shown below. It's a simple change, but it will help you understand the basic idea.
01. //+------------------------------------------------------------------+
02. #property copyright "Daniel Jose"
03. //+------------------------------------------------------------------+
04. #property description "DEMO Indicator"
05. //+------------------------------------------------------------------+
06. const struct stAverange
07. {
08.     int            nPeriods;
09.     ENUM_MA_METHOD Method;
10.     color          cor;
11. }Averange[] =
12. {
13.     {3, MODE_SMA, clrBlack}
14. };
15. //+----------------+
                   .
                   .
                   .
Snippet 05
Please note that the code now calculates the arithmetic mean over a very short period. That way, we'll make sure the effect is noticeable. This may not be the best explanation, but at least it will help satisfy your curiosity to some extent.
After creating and compiling it, we can add the indicator to the chart. The result is shown in the following image.
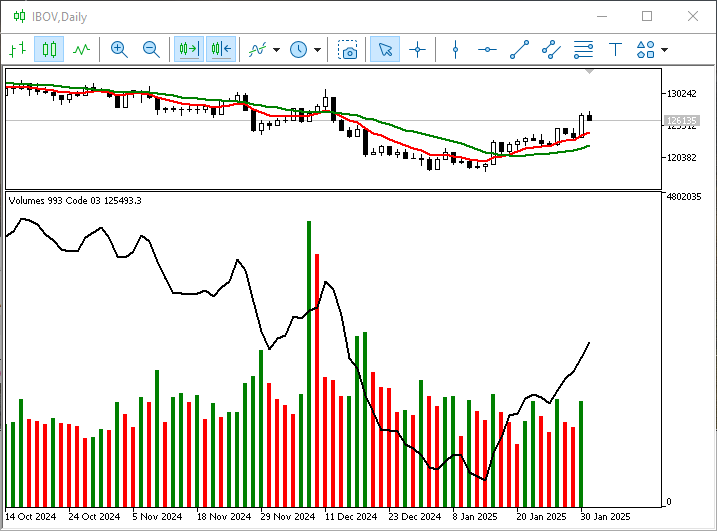
Image 08
Now we'll configure it to use the setting shown in the following image.
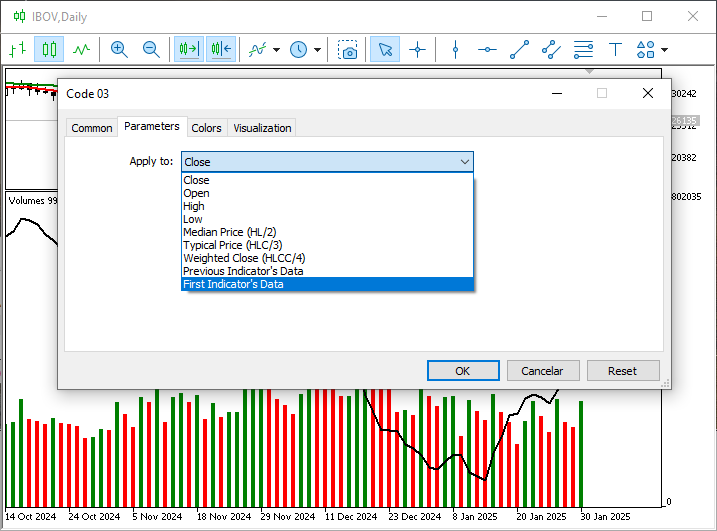
Image 09
After that, we'll get the following result.
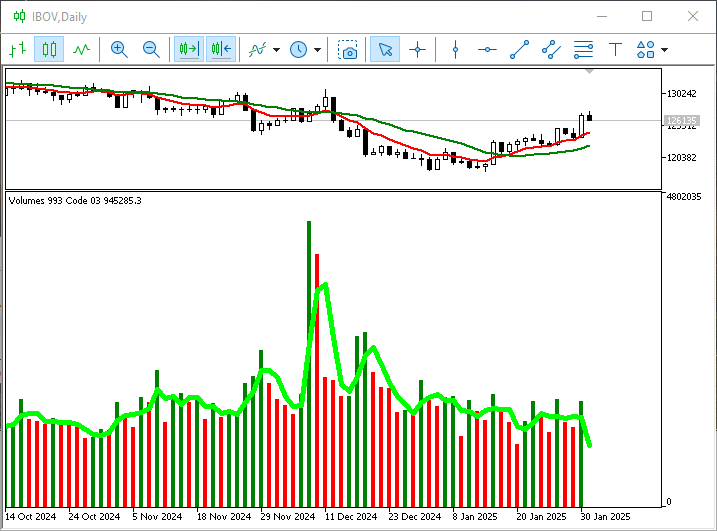
Image 10
Please note that I've changed the color and thickness of the line to make it easier to understand what will happen next. Now we'll add another instance of the same indicator. The result is shown below.
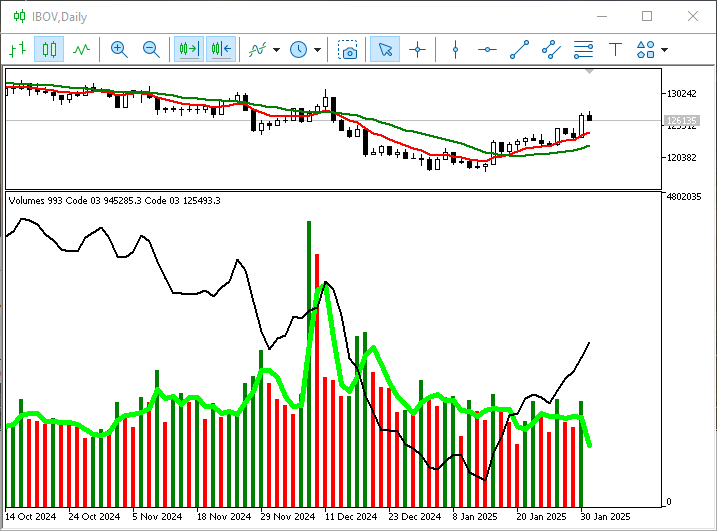
Image 11
Take a look at this setting; I'll explain it in more detail a little later. Since two moving averages are displayed on the screen, we'll configure the black one to use the setting shown in the following image.
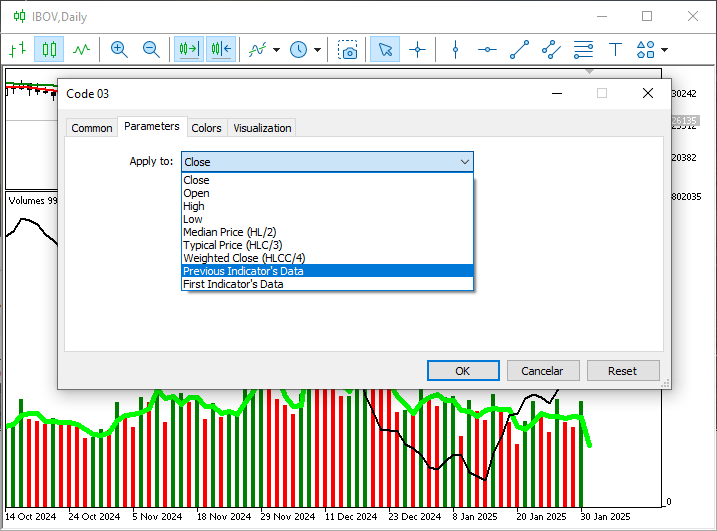
Image 12
This time, we'll choose a different setting. Nevertheless, the result will be as shown below.
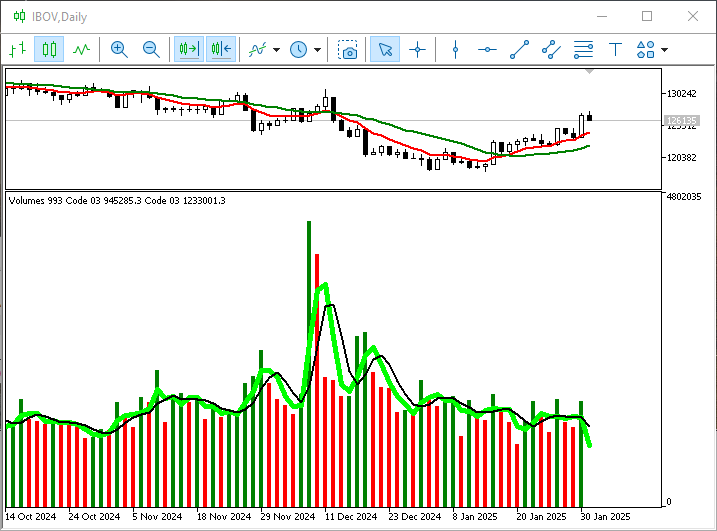
Image 13
How strange. I thought the result would be the same. Now I'm a little confused: I'd never thought about which of these settings to choose before. To me, they were both the same. That's right, dear reader. We often think that something works a certain way, only to discover that it actually works completely differently. What you see in Image 13 may seem strange, but there is an explanation for it, and in some cases it may even prove useful—though one might wonder to what extent. I know some traders who take advantage of this.
Concluding Thoughts
In this article, I discussed the basic principles of using subwindows. Some questions—such as which data source to use when calculating an indicator—have not yet been fully explained; we will address them in future articles. Nevertheless, I believe that what we've covered here shows that to use MetaTrader 5 correctly, you need to pay attention both to programming and to how you use the indicators added to the chart.
In the next article, we'll take a closer look at specific aspects of subwindows. This is a tool that can be used in various ways and could even serve as the foundation for a potential system that enables more advanced user interaction. To get to that point, you first need to better understand how to work with them.
| MQ5 File | Description |
|---|---|
| Indicators\\Code 01 | Basic Demonstration |
| Indicators\\Code 02 | Basic Demonstration |
| Indicators\\Code 03 | Basic Demonstration |
Translated from Portuguese by MetaQuotes Ltd.
Original article: https://www.mql5.com/pt/articles/17086
Warning: All rights to these materials are reserved by MetaQuotes Ltd. Copying or reprinting of these materials in whole or in part is prohibited.
This article was written by a user of the site and reflects their personal views. MetaQuotes Ltd is not responsible for the accuracy of the information presented, nor for any consequences resulting from the use of the solutions, strategies or recommendations described.

 Neural Networks in Practice: When to Use an Artificial Neuron and How It Works in MQL5
 Neural Networks in Practice: Stochastic Gradient Descent
 Property-Based Testing for Trading Rules in MQL5 (Part 1): Generate Market Scenarios, Test Invariants, Find Edge Cases
 Neural Networks in Trading: Temporal Motion Aggregation (Conclusion)

- Free trading apps
- Over 8,000 signals for copying
- Economic news for exploring financial markets
You agree to website policy and terms of use