Native MQL5 Prometheus Exporter: Real-Time Observability for Live Trading Models
 94
 0

Introduction
Most MQL5 observability articles stop at logging to a file or pushing rows into a database. That works until you need to watch a live model — equity, floating drawdown, inference latency, whether the model's confidence is drifting — continuously and without opening the terminal. Logs can answer many of those questions, especially with log shipping and alert rules on top. But questions like "is inference latency creeping up right now?" or "is this EA still pushing data at all?" are numeric and time-based. A time-series system answers them more directly: a metric is a number sampled on a schedule, queryable with rates, percentiles and thresholds, with no text parsing.
Prometheus is a natural target: it is the de facto standard for collecting numeric time series. Once your EA exports the Prometheus text format, Grafana dashboards, alert rules, and other ecosystem tools work with it without additional integration. That format itself is unremarkable — plain text, one metric per line, a HELP and a TYPE comment above each. What matters is the surrounding design: pick the correct metric type for each quantity, and reliably export the values from MQL5.
The catch is that MQL5 cannot be a Prometheus target in the way you would expect. Prometheus normally works by scraping — it polls a /metrics HTTP endpoint on your service at regular intervals. That requires your service to accept an incoming connection and answer it, which means running a listening socket. Native MQL5 sockets do not support listening sockets, which rules out the usual scrape-based design and shapes everything that follows.
Scope note: this article builds a fully native MQL5 metrics pipeline for a live EA — no external DLL, no Python sidecar process. Instead of a pull-scraped endpoint, the EA pushes its metrics outward to a Prometheus Pushgateway on a timer, and a Prometheus server needs one scrape job pointed at that gateway. The trading logic driving the metrics is a plain SMA-cross demonstration harness; it exists only to generate real activity for the metrics to describe and is not presented as a strategy. The test run covers the path from the EA to the Pushgateway; Prometheus, Grafana and alert rules were not exercised in it.
One more point before the code: everything downstream of the Pushgateway in Fig. 1 is standard software, but not zero-configuration. Prometheus needs a scrape job for the gateway (shown at the end of the PushgatewayClient section), and dashboards and alert rules need queries written against these series. The new work is the left-hand side: getting a correct, well-typed payload out of a live MQL5 process and onto the wire reliably.
Architecture: From Tick to Time Series
Why not a listening socket. MQL5's socket API — SocketCreate, SocketConnect, SocketSend, SocketReceive, SocketClose, SocketIsConnected — is outbound-only. There is no SocketBind, no SocketListen, no SocketAccept. The listening-socket examples circulating in the community typically get there by importing the Windows Winsock DLL directly (bind(), listen(), accept() via #import), a platform-specific dependency this design avoids. The starting point is therefore simple: a native MQL5 EA cannot itself be scraped.
Prometheus does ship a component for metrics that cannot be scraped: the Pushgateway. Its documentation intends it for service-level batch jobs and cautions against long-running, instance-level use, because a pushed series is kept until someone deletes it and the built-in up metric that scraping provides is lost. This design uses it anyway because it is the only receiving endpoint in the Prometheus ecosystem that a purely native EA can reach with one outbound HTTP request and no extra process besides the terminal. The costs are covered in the Limitations section, together with what a relay-based design would change. Prometheus still does the pulling: once a scrape job points at the gateway, it collects the pushed series on its normal schedule.
EA-to-Prometheus data path via an intermediary Pushgatewa
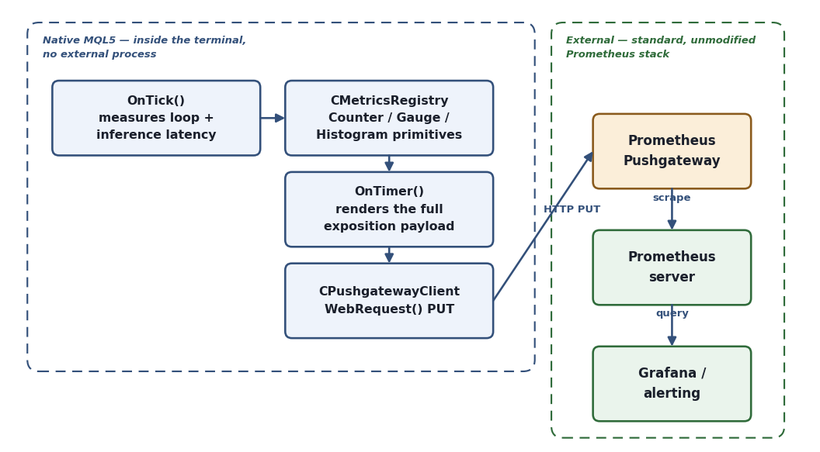
Fig. 1. The dashed boundary marks the split: everything inside runs natively in the MQL5 terminal and calls out only outbound, via periodic HTTP PUT; everything outside is the standard Prometheus stack, which needs a scrape job pointed at the Pushgateway. The EA never accepts a connection, and Prometheus never scrapes the EA directly — only the Pushgateway.
Three moving pieces. The code follows that data path in three pieces. MetricsRegistry.mqh defines the primitives — counter, gauge, histogram — and renders them into one exposition payload. PushgatewayClient.mqh sends that payload over outbound HTTP. PrometheusExporter_EA.mq5 connects both to the EA lifecycle, OnTick() and OnTimer(), and contains the SMA-cross demonstration harness that gives the metrics something real to measure.
Why Pushgateway and not Prometheus's remote-write endpoint. Remote write is a Snappy-compressed Protobuf stream over HTTP, meant for storage backends and dedicated agents. Reproducing that wire format in native MQL5, without a Protobuf library and with Snappy on top, is a far larger and more fragile job than assembling a plain-text payload by string concatenation, which is all the Pushgateway's HTTP interface asks for.
What "real-time" means for a five-second push interval. InpPushIntervalSec defaults to 5, but it is only one term in the delay between an event in the EA and a fresh value on a dashboard. The total delay also depends on the Prometheus scrape interval, the rule evaluation interval (including any "for" duration), and the WebRequest round trip. With a 5 s push and a 15 s scrape, a stored value can be roughly 20 s old. Pushing more often than the scrape interval buys nothing, because the gateway keeps only the latest value per series and Prometheus samples it once per scrape. Tune the intervals together against how quickly a person or an alert rule needs to react.
MetricsRegistry.mqh: Counter, Gauge, and Histogram Primitives
Text-format helpers — escaping and bound formatting. Three small functions come first in the file because every Render() depends on them. The text format is line-based, so a stray quote, backslash or line feed in a label value or HELP text can end a line early and make the rest of the payload unparseable. PromEscapeLabelValue() and PromEscapeHelp() apply the escapes the format defines, replacing the backslash first so the backslashes the other replacements insert are not escaped twice. Only values and free text are escaped; metric and label names are fixed identifiers.
//+------------------------------------------------------------------+
//| PromEscapeLabelValue                                             |
//| Escapes a string for use inside a double-quoted label value. The |
//| text exposition format requires exactly three escapes there:     |
//| backslash, double quote, and line feed. Only values are escaped; |
//| metric and label names are fixed identifiers written by this     |
//| file.                                                            |
//+------------------------------------------------------------------+
string PromEscapeLabelValue(const string value)
  {
   string out = value;
//--- the backslash goes first: escaping it after the quote and line
//--- feed would double-escape the backslashes those two steps insert
   StringReplace(out,"\\","\\\\");
   StringReplace(out,"\"","\\\"");
   StringReplace(out,"\n","\\n");
   return(out);
  }

//+------------------------------------------------------------------+
//| PromEscapeHelp                                                   |
//| Escapes free text for a HELP line. HELP text is not quoted, so   |
//| only the backslash and the line feed need escaping; a raw line   |
//| feed would end the comment early and turn the rest of the text   |
//| into a malformed sample line.                                    |
//+------------------------------------------------------------------+
string PromEscapeHelp(const string text)
  {
   string out = text;
   StringReplace(out,"\\","\\\\");
   StringReplace(out,"\n","\\n");
   return(out);
  }
PromFormatBound() formats bucket bounds for the "le" label. A fixed two-decimal format would print 0.005 as 0.01 and move the label away from the boundary the counts were collected against; printing eight decimals and trimming trailing zeros keeps 0.05, 2.5 and 10 exactly as written in the bound arrays.
//+------------------------------------------------------------------+
//| PromFormatBound                                                  |
//| Formats a histogram bucket bound with up to eight decimals and   |
//| trims the trailing zeros, so 0.50000000 becomes 0.5 and          |
//| 10.00000000 becomes 10. A fixed two-decimal format would round a |
//| bound such as 0.005 to 0.01 and silently shift the le label away |
//| from the real boundary.                                          |
//+------------------------------------------------------------------+
string PromFormatBound(const double bound)
  {
   string text = DoubleToString(bound,8);
   int    len  = StringLen(text);
//--- strip trailing zeros first, then a dangling decimal point; the
//--- point always exists here, so the integer digits are never touched
   while(len > 1 && StringGetCharacter(text,len-1) == '0')
      len--;
   if(len > 1 && StringGetCharacter(text,len-1) == '.')
      len--;
   return(StringSubstr(text,0,len));
  }
Why three types instead of one. Prometheus defines a handful of metric types with different contracts, and getting the type wrong for a given quantity produces numbers that are technically present but useless in PromQL. A counter promises to never decrease — rate() and increase() depend on that. A gauge can move freely in either direction. A histogram tracks a distribution as cumulative bucket counts plus a sum and count, so percentiles can be computed server-side with histogram_quantile() instead of being pre-baked into a single number here. CCounter, CGauge, and CHistogram each model exactly one of these contracts and nothing else — each gets a single class-level header box, since MQL5's declaration syntax only needs one box for the whole class; the method bodies inside are described with plain //--- block comments, not their own boxes.
//+------------------------------------------------------------------+
//| CCounter                                                         |
//| Monotonic counter primitive. Models a Prometheus 'counter': a    |
//| value that only ever increases (or resets to zero on program     |
//| restart). Used for quantities like gross profit and gross loss,  |
//| where the PromQL rate()/increase() functions require             |
//| monotonicity to be valid.                                        |
//+------------------------------------------------------------------+
class CCounter
  {
private:
   //--- identity
   string            m_name;           // metric name, e.g. "mt5_gross_profit_total"
   string            m_help;           // one-line HELP text shown in the exposition payload
   string            m_label_pairs;    // pre-rendered "{symbol="EURUSD"}" or "" if none
   //--- state
   double            m_value;          // current cumulative value, never decreases
public:
                     CCounter(void);
   void              Init(const string name,const string help,const string label_pairs="");
   void              Add(const double delta);
   string            Render(void) const;
  };
CCounter::Add — enforcing monotonicity in code, not just in the docstring. A counter is only useful to Prometheus if it genuinely never falls. That is easy to violate by accident — subtract instead of add, double-count a closed trade — so the guard lives directly in Add() rather than being left as a convention callers are expected to remember. The class also has no public Reset(): zeroing a counter while the program runs looks to rate() and increase() like a process restart, so a business-logic reset would distort every rate computed across it.
//+------------------------------------------------------------------+
//| Add                                                              |
//| Increments the counter by a non-negative delta.                  |
//+------------------------------------------------------------------+
void CCounter::Add(const double delta)
  {
//--- a Prometheus counter must never decrease; a negative delta here
//--- almost always means a bug upstream (e.g. double-counting a closed
//--- trade), not a legitimate observation, so it is rejected rather
//--- than silently absorbed into the running total
   if(delta < 0.0)
     {
      PrintFormat("CCounter::Add: rejected negative delta %.4f for '%s'",delta,m_name);
      return;
     }
   m_value += delta;
  }
CGauge — the type most metrics in this EA actually are. Equity, drawdown, and model confidence are all point-in-time readings that legitimately move in either direction, so forcing them through a counter would just trip the same guard shown above on every downward tick. A gauge drops that restriction entirely: Set() overwrites the stored value outright for a fresh snapshot, and Add() accepts a signed delta for cases like the net-P&L tracking discussed further down, where the caller wants to adjust rather than replace.
//+------------------------------------------------------------------+
//| CGauge                                                           |
//| Point-in-time value primitive. Models a Prometheus 'gauge': a    |
//| value that can move up or down freely. Used for quantities like  |
//| equity, drawdown, and model confidence, which are snapshots, not |
//| running totals.                                                  |
//+------------------------------------------------------------------+
class CGauge
  {
private:
   //--- identity
   string            m_name;
   string            m_help;
   string            m_label_pairs;
   //--- state
   double            m_value;          // current snapshot value, any sign
public:
                     CGauge(void);
   void              Init(const string name,const string help,const string label_pairs="");
   void              Set(const double value);
   void              Add(const double delta);
   string            Render(void) const;
  };
CHistogram — the type that actually needs explaining. A gauge or counter is a single number; a histogram is a small array of cumulative counters plus a running sum and count, and the exact update rule matters more than it looks like it should.
//+------------------------------------------------------------------+
//| CHistogram                                                       |
//| Latency/duration distribution primitive. Models a Prometheus     |
//| 'histogram': cumulative bucket counters plus a running sum and   |
//| count. Lets Prometheus compute percentiles server-side via       |
//| histogram_quantile(), rather than relying on a single statistic  |
//| computed here.                                                   |
//+------------------------------------------------------------------+
class CHistogram
  {
private:
   //--- identity
   string            m_name;
   string            m_help;
   string            m_label_pairs;
   //--- bucket state
   double            m_bounds[];                // ascending upper bounds ("le"), +Inf is implicit
   ulong             m_bucket_counts[];         // cumulative count per bound, same size as m_bounds
   double            m_sum;                     // running sum of every observed value
   ulong             m_count;                   // total number of observations
public:
                     CHistogram(void);
   void              Init(const string name,const string help,const double &bounds[],const string label_pairs="");
   void              Observe(const double value);
   string            Render(void) const;
  };
CHistogram::Observe — the part every hand-rolled histogram gets wrong once. The bucket bounds are ascending upper bounds — Prometheus calls the label le, meaning "less than or equal." The natural-looking implementation increments only the single narrowest bucket a value falls into, then tries to derive cumulative totals later by summing upward. That produces the wrong numbers the moment any one bucket is queried on its own, because histogram_quantile() assumes every bucket already holds a cumulative count, not an isolated one. The fix is a single loop that increments every bucket whose bound is greater than or equal to the value — cumulative by construction, with no second pass required.
//+------------------------------------------------------------------+
//| Observe                                                          |
//| Records one sample. The loop below increments EVERY bucket whose |
//| bound is greater than or equal to the value, not just the first  |
//| match: that is what makes the stored counts cumulative by        |
//| construction. A common hand-rolled histogram bug is incrementing |
//| only the single narrowest matching bucket and trying to sum      |
//| upward at render time instead — that produces the wrong shape    |
//| the moment a bucket is queried on its own via                    |
//| histogram_quantile().                                            |
//+------------------------------------------------------------------+
void CHistogram::Observe(const double value)
  {
   int n = ArraySize(m_bounds);
//--- walk every bucket bound in ascending order and increment each one
//--- the value qualifies for; because the bounds are ascending, a
//--- value that clears an early, small bound also clears every larger
//--- bound after it, so this single pass leaves every bucket already
//--- holding a cumulative count with no second summation pass needed
   for(int i=0; i<n; i++)
     {
      //--- le semantics: this bucket counts every observation <= its
      //--- own bound, matching Prometheus's own histogram_quantile()
      //--- assumption about what a bucket sample line represents
      if(value <= m_bounds[i])
         m_bucket_counts[i]++;
     }
//--- _sum and _count are tracked independently of the buckets: a
//--- histogram's HELP/TYPE contract requires both regardless of how
//--- many (if any) buckets a given value happened to fall into
   m_sum += value;
   m_count++;
  }
CHistogram::Render — folding a shared label set into a per-bucket one. Every sample line in this metric needs the registry's shared labels (for example symbol="EURUSD") plus its own le label on the same line. Prometheus's text format only allows one {...} label block per sample, so the code has to splice le into the existing label string rather than appending a second block — appending one produces a line Prometheus's parser rejects outright, not a line it partially reads. The bound goes through PromFormatBound(), the HELP line through PromEscapeHelp().
//+------------------------------------------------------------------+
//| Render                                                           |
//| Produces the HELP/TYPE line, one sample line per bucket (each    |
//| tagged with its own "le" label), an explicit "+Inf" bucket equal |
//| to the total count, then the _sum and _count lines Prometheus    |
//| requires to complete a valid histogram series.                   |
//+------------------------------------------------------------------+
string CHistogram::Render(void) const
  {
   string text = "";
   text += "# HELP " + m_name + " " + PromEscapeHelp(m_help) + "\n";
   text += "# TYPE " + m_name + " histogram\n";
   int n = ArraySize(m_bounds);
//--- emit one sample line per bucket, each carrying its own "le" label
//--- alongside whatever shared labels (e.g. symbol="EURUSD") this
//--- histogram was constructed with
   for(int i=0; i<n; i++)
     {
      string le_label = "{le=\"" + PromFormatBound(m_bounds[i]) + "\"}";
      //--- fold "le" into the existing label set rather than appending
      //--- a second, separate {..} block, which Prometheus's parser
      //--- would reject as a malformed sample line
      if(StringLen(m_label_pairs) > 0)
         le_label = "{" + StringSubstr(m_label_pairs,1,StringLen(m_label_pairs)-2) + ",le=\"" + PromFormatBound(m_bounds[i]) + "\"}";
      text += m_name + "_bucket" + le_label + " " + (string)m_bucket_counts[i] + "\n";
     }
//--- the +Inf bucket is not stored in m_bounds; it always equals the
//--- total observation count, so it is synthesized here rather than
//--- wasting an array slot carrying a sentinel value
   string inf_label = "{le=\"+Inf\"}";
   if(StringLen(m_label_pairs) > 0)
      inf_label = "{" + StringSubstr(m_label_pairs,1,StringLen(m_label_pairs)-2) + ",le=\"+Inf\"}";
   text += m_name + "_bucket" + inf_label + " " + (string)m_count + "\n";
   text += m_name + "_sum" + m_label_pairs + " " + DoubleToString(m_sum,4) + "\n";
   text += m_name + "_count" + m_label_pairs + " " + (string)m_count + "\n";
   return(text);
  }
CMetricsRegistry — the only class the EA itself calls. Everything above is a general-purpose primitive; CMetricsRegistry is where those primitives get named and pointed at this specific EA's concerns. UpdateAccountState() pulls the account-level gauges once per push interval — deliberately from OnTimer(), not OnTick(), since equity and balance do not need tick-frequency resolution and reading them once per interval keeps a single rendered payload internally consistent. These three gauges describe the whole account, not the chart's symbol; they carry the symbol label only because one payload shares one label set.
//+------------------------------------------------------------------+
//| UpdateAccountState                                               |
//| Refreshes the account-level gauges from the live terminal state. |
//| These describe the whole account, not the chart's symbol, so     |
//| every instance running on the same account reports the same      |
//| values. Called from OnTimer(), not OnTick(): equity/balance do   |
//| not need tick-frequency resolution, and reading them once per    |
//| push interval keeps the exposition payload's snapshot internally |
//| consistent.                                                      |
//+------------------------------------------------------------------+
void CMetricsRegistry::UpdateAccountState(void)
  {
   double equity  = AccountInfoDouble(ACCOUNT_EQUITY);
   double balance = AccountInfoDouble(ACCOUNT_BALANCE);
   m_equity.Set(equity);
   m_balance.Set(balance);
//--- drawdown is only meaningful while equity trails balance; clamp
//--- to zero on a flat or winning book instead of exposing a negative
//--- "drawdown", which would misread as an anomaly on a dashboard
   double drawdown_pct = 0.0;
   if(balance > 0.0 && equity < balance)
      drawdown_pct = (balance - equity) / balance * 100.0;
   m_drawdown_pct.Set(drawdown_pct);
  }
RecordTrade — why P&L needs three metrics, not one. A single "total P&L" counter is the obvious design and the wrong one: the first losing trade tries to reduce it, which CCounter::Add() correctly refuses. The answer is two separately monotonic counters, gross profit and gross loss, that PromQL can recombine, plus the raw net level as a gauge. All three start from zero when the EA instance starts, so they describe trades this instance has closed, not the account's history; for a restart-safe figure, take increase() of the two counters over a window instead of reading the gauge.
//+------------------------------------------------------------------+
//| RecordTrade                                                      |
//| Splits a closed trade's P&L into gross profit and gross loss     |
//| counters rather than one signed counter. A Prometheus counter    |
//| must never decrease, so a single "total P&L" counter would       |
//| silently break the moment a losing trade tried to reduce it.     |
//| Gross profit/loss stay individually monotonic, and PromQL can    |
//| recombine them with increase() over a window; the raw net level  |
//| is also exposed as a gauge. All three start from zero when the   |
//| EA instance starts, and they only see trades passed to this      |
//| method.                                                          |
//+------------------------------------------------------------------+
void CMetricsRegistry::RecordTrade(const double pnl)
  {
   if(pnl >= 0.0)
      m_gross_profit.Add(pnl);
   else
      m_gross_loss.Add(-pnl);
   m_net_pnl.Add(pnl);
  }
PushgatewayClient.mqh: Getting Data Out Without a Listening Socket
PUT semantics and the grouping key. A Pushgateway groups metrics by a "job" and optionally an "instance" label baked into the URL path, not into the payload body. A PUT to /metrics/job/<job>/instance/<instance> replaces every series previously pushed under that exact pair, which suits an EA that always renders its complete current state; a POST would merge and could leave behind a metric the EA stopped reporting. The grouping key is what keeps two EA instances apart on one gateway; a symbol label in the payload body is a different thing, chosen by the EA, and separates nothing by itself.
//+------------------------------------------------------------------+
//| Init                                                             |
//| Builds the Pushgateway URL once, following the gateway's own     |
//| grouping-key convention: PUT to                                  |
//| /metrics/job/<job>/instance/<inst> replaces the entire set of    |
//| series under that job+instance pair on every call, which is      |
//| exactly the "always send the full current state" model this EA   |
//| already uses internally. Both values go through                  |
//| BuildGroupingKeySegment(), which picks plain percent-encoding or |
//| the gateway's base64 path form depending on whether the value    |
//| contains a slash.                                                |
//+------------------------------------------------------------------+
void CPushgatewayClient::Init(const string host,const int port,const string job,const string instance,const int timeout_ms=2000)
  {
   m_url        = "http://" + host + ":" + (string)port + "/metrics/" + BuildGroupingKeySegment("job",job) + "/" + BuildGroupingKeySegment("instance",instance);
   m_timeout_ms = timeout_ms;
  }
UrlEncodePathSegment, and the slash case Pushgateway actually documents. Both job and instance are pasted into the URL path, so a broker symbol such as #AAPL (a fragment character), a job name with a space, or a slash would change which group a push lands in. UrlEncodePathSegment() percent-encodes every byte of the UTF-8 form except letters, digits and - _. ~, which is correct for every byte but one: a literal slash cannot appear inside a single path segment at all, encoded or not, without splitting it in two.
Silently substituting an underscore throws away the distinction between two different values and can let unrelated groups collide. Pushgateway's own documentation gives the actual mechanism: suffix the label name with @base64 and send the value's RFC 4648 URL-safe base64 encoding as the path segment instead of the raw text. BuildGroupingKeySegment() below reaches for that form only when a value actually contains a slash, so the common case — a plain symbol or job name — stays a readable percent-encoded segment, and only the rare slash-bearing value pays for base64.
//+------------------------------------------------------------------+
//| UrlEncodePathSegment                                             |
//| Percent-encodes one path segment of the Pushgateway URL.         |
//| Letters, digits and - _ . ~ pass through unchanged; every other  |
//| byte of the UTF-8 form becomes %XX, so a name such as #AAPL or   |
//| one containing a space cannot change what the URL means. Callers |
//| route any value containing a slash through                       |
//| BuildGroupingKeySegment()'s base64 form instead: a literal slash |
//| cannot be percent-encoded into a single path segment, so this    |
//| function never sees one.                                         |
//+------------------------------------------------------------------+
string UrlEncodePathSegment(const string text)
  {
   uchar bytes[];
//--- StringToCharArray() counts the trailing null terminator, which is
//--- not part of the text, so the byte count is one less than returned
   int n = StringToCharArray(text,bytes,0,WHOLE_ARRAY,CP_UTF8) - 1;
   string encoded = "";
   for(int i=0; i<n; i++)
     {
      uchar c = bytes[i];
      bool unreserved = (c >= '0' && c <= '9') || (c >= 'A' && c <= 'Z') ||
                        (c >= 'a' && c <= 'z') || c == '-' || c == '_' || c == '.' || c == '~';
      if(unreserved)
         encoded += CharToString(c);
      else
         encoded += StringFormat("%%%02X",c);
     }
   return(encoded);
  }
//+------------------------------------------------------------------+
//| BuildGroupingKeySegment                                          |
//| Builds one ' / ' grouping-key path segment. A value  |
//| containing a slash cannot be percent-encoded into a single path  |
//| segment without losing information, so it goes out as            |
//| Pushgateway's documented ' @base64/ ' form instead,  |
//| RFC 4648 base64url, matching the gateway's own README rather     |
//| than a lossy, collision-prone substitution such as mapping '/'   |
//| to '_'.                                                          |
//+------------------------------------------------------------------+
string BuildGroupingKeySegment(const string label,const string value)
  {
   if(StringFind(value,"/") < 0)
      return(label + "/" + UrlEncodePathSegment(value));

   uchar bytes[];
   int n = StringToCharArray(value,bytes,0,WHOLE_ARRAY,CP_UTF8) - 1;
   return(label + "@base64/" + Base64UrlEncode(bytes,n));
  }
Push — the allow-list, the synchronous call, and an easy-to-miss encoding bug. First, an operational point no code can fix: the gateway's host must be added under Tools > Options > Expert Advisors > "Allow WebRequest for listed URL", or WebRequest() fails closed with error 4014 before touching the network, and no MQL5 program can add itself to that list. Second, WebRequest() is synchronous: the EA's thread waits for the response or the timeout (InpPushTimeoutMs, 2000 ms by default), and since an EA handles events one at a time, OnTick() cannot run during that wait. Third, StringToCharArray() appends a trailing null terminator; left in the HTTP body, that stray 0x00 byte can make the gateway's text parser reject the payload with an error that looks like a content problem but is a framing problem.
//+------------------------------------------------------------------+
//| Push                                                             |
//| Sends the exposition payload as an HTTP PUT body via             |
//| WebRequest(). The call is synchronous: the EA's thread waits     |
//| here for the response or the timeout, and an EA handles its      |
//| events one at a time, so OnTick() cannot run while a push is in  |
//| flight. The gateway host must be on the terminal's WebRequest    |
//| allow-list (Tools > Options > Expert Advisors); otherwise the    |
//| call fails closed with error 4014, and no MQL5 program can add   |
//| itself to that list.                                             |
//+------------------------------------------------------------------+
bool CPushgatewayClient::Push(const string exposition_text)
  {
   uchar request_body[];
   uchar response_body[];
   string response_headers;

//--- StringToCharArray() always appends a trailing null terminator;
//--- left in place, that extra 0x00 byte becomes part of the HTTP
//--- body Pushgateway receives, and its own line-based parser then
//--- rejects the payload with a "text format parsing error" that has
//--- nothing to do with the metrics content itself
   int raw_len = StringToCharArray(exposition_text,request_body,0,WHOLE_ARRAY,CP_UTF8);
   if(raw_len > 0)
      ArrayResize(request_body,raw_len-1);

   string request_headers = "Content-Type: text/plain; version=0.0.4\r\n";

   ResetLastError();
   int http_code = WebRequest("PUT",m_url,request_headers,m_timeout_ms,request_body,response_body,response_headers);

   if(http_code == -1)
     {
      PrintFormat("CPushgatewayClient::Push: WebRequest failed, error %d (is %s allow-listed under Expert Advisors options?)",GetLastError(),m_url);
      m_last_http_code = -1;
      return(false);
     }

   m_last_http_code = http_code;
//--- Pushgateway returns 200 on a successful PUT; anything else means
//--- the gateway rejected or partially applied the payload
   if(http_code == 200)
     {
      m_last_success_time = TimeCurrent();
      return(true);
     }

   PrintFormat("CPushgatewayClient::Push: Pushgateway returned HTTP %d for %s",http_code,m_url);
   return(false);
  }
Getting a Pushgateway running to test against. The EA above assumes something is listening at InpPushgatewayHost:InpPushgatewayPort. For local development that is normally the official image, started once: docker run -d -p 9091:9091 prom/pushgateway (the standalone pushgateway binary works the same way). Once it is up, a successful push can be confirmed independently of the EA with the gateway's own UI at http://127.0.0.1:9091, which lists every group currently held — the fastest way to tell whether the last push arrived is to check there before suspecting the MQL5 side.
Pointing Prometheus at the gateway. The gateway only holds the series; Prometheus needs one scrape job to collect them. The setting that matters is honor_labels: true. Without it Prometheus replaces the job and instance labels of every scraped series with the gateway's own and renames the pushed ones to exported_job and exported_instance, which defeats the per-instance separation the grouping key provides. The scrape interval is also the real upper bound on how often pushed values are sampled.
scrape_configs:
  - job_name: "pushgateway"
    honor_labels: true
    scrape_interval: 15s
    static_configs:
      - targets: ["127.0.0.1:9091"]
PrometheusExporter_EA.mq5: Wiring It Into a Live Chart
OnInit — failing loudly on bad inputs. The demonstration signal only makes sense if the fast period is strictly shorter than the slow one, so that check happens before either indicator handle is created, returning INIT_PARAMETERS_INCORRECT rather than letting a nonsensical MA pair silently produce a crossing signal that never fires correctly. OnInit() is also where the new InpMagicNumber input (773311 by default) reaches CTrade via SetExpertMagicNumber(), so every position this EA opens is tagged, and FindOwnPosition() further down can tell those positions apart from a manual trade, another EA, or this same EA running on a different chart.
//+------------------------------------------------------------------+
//| OnInit                                                           |
//| Validates inputs, builds the two MA handles the demonstration    |
//| signal needs, wires the metrics registry and Pushgateway client, |
//| and starts the OnTimer() push loop.                              |
//+------------------------------------------------------------------+
int OnInit(void)
  {
   if(InpFastPeriod <= 0 || InpSlowPeriod <= 0 || InpFastPeriod >= InpSlowPeriod)
     {
      Print("OnInit: InpFastPeriod must be positive and strictly less than InpSlowPeriod");
      return(INIT_PARAMETERS_INCORRECT);
     }

   g_fast_ma_handle = iMA(_Symbol,_Period,InpFastPeriod,0,MODE_SMA,PRICE_CLOSE);
   g_slow_ma_handle = iMA(_Symbol,_Period,InpSlowPeriod,0,MODE_SMA,PRICE_CLOSE);
   if(g_fast_ma_handle == INVALID_HANDLE || g_slow_ma_handle == INVALID_HANDLE)
     {
      Print("OnInit: failed to create one or both iMA handles");
      return(INIT_FAILED);
     }

   g_registry.Init(_Symbol);
   g_pusher.Init(InpPushgatewayHost,InpPushgatewayPort,InpJobName,_Symbol,InpPushTimeoutMs);
//--- every position this EA opens carries this magic number, so
//--- FindOwnPosition() can later tell its own positions apart from
//--- a manual trade, another EA, or this same EA on a different chart
   g_trade.SetExpertMagicNumber(InpMagicNumber);

   g_last_bar_time = 0;
   EventSetTimer(InpPushIntervalSec);
   return(INIT_SUCCEEDED);
  }
OnTimer — where the timer actually becomes a push. EventSetTimer() in OnInit() only arms the timer; the push itself happens here, on every fire: refresh the account-level gauges, render the full exposition payload, and PUT it to the gateway. This is the fragment that ties the three pieces together — UpdateAccountState(), RenderExposition() and Push() — the connection the rest of the article describes in prose.
//+------------------------------------------------------------------+
//| OnTimer                                                          |
//| Fires every InpPushIntervalSec seconds. Refreshes the account-   |
//| level gauges, renders the complete exposition payload, and PUTs  |
//| it to the Pushgateway. This is the only place Push() is called;  |
//| a failed push is logged and retried on the next timer tick, not  |
//| retried immediately.                                             |
//+------------------------------------------------------------------+
void OnTimer(void)
  {
   g_registry.UpdateAccountState();
   string payload = g_registry.RenderExposition();
   if(!g_pusher.Push(payload))
      Print("OnTimer: push to Pushgateway failed, see the Push() log line above for the HTTP code");
  }
OnTick — timing the handler, not a decision. The handler-latency histogram is fed from GetMicrosecondCount() around the whole OnTick() body on every tick. Most ticks take the early path that only compares the bar time, so most samples are cheap; the once-per-bar decision pass, with its buffer reads and any order request, is a small minority visible mainly in the upper buckets. The percentiles therefore describe the tick handler, and mt5_inference_latency_ms is what isolates the decision step. The timer also starts only when OnTick() starts, so time a tick spent waiting behind a push in OnTimer() is not counted. The metric keeps the name mt5_decision_loop_latency_ms, but its HELP text describes what it measures.
//+------------------------------------------------------------------+
//| OnTick                                                           |
//| Times the whole handler on every tick and runs the demonstration |
//| signal once per new bar, on that bar's first tick. Both the      |
//| handler-latency and the signal-latency histograms are fed with   |
//| measured durations. The handler timer starts when OnTick()       |
//| starts, so time a tick spent waiting behind another handler,     |
//| such as a push in OnTimer(), is not part of it.                  |
//+------------------------------------------------------------------+
void OnTick(void)
  {
   ulong loop_start_us = GetMicrosecondCount();

   datetime current_bar_time = iTime(_Symbol,_Period,0);
   if(current_bar_time != g_last_bar_time)
     {
      g_last_bar_time = current_bar_time;
      EvaluateAndTrade();
     }

   double loop_latency_ms = (double)(GetMicrosecondCount() - loop_start_us) / 1000.0;
   g_registry.RecordLoop(loop_latency_ms);
  }
//+------------------------------------------------------------------+
//| FindOwnPosition                                                  |
//| Scans open positions for this EA's own position on _Symbol,      |
//| identified by symbol and POSITION_MAGIC, so a position opened by |
//| another EA or by hand is never read or closed as if it belonged  |
//| here. On a hedging account more than one of this EA's own        |
//| positions can exist on the same symbol; this returns the first   |
//| one found, which matches the single-position-per-symbol logic    |
//| EvaluateAndTrade() uses, not a general hedging-aware manager.    |
//+------------------------------------------------------------------+
bool FindOwnPosition(ulong &ticket_out)
  {
   for(int i=PositionsTotal()-1; i>=0; i--)
     {
      ulong ticket = PositionGetTicket(i);
      if(ticket == 0)
         continue;
      if(PositionGetString(POSITION_SYMBOL) != _Symbol)
         continue;
      if(PositionGetInteger(POSITION_MAGIC) != InpMagicNumber)
         continue;
      ticket_out = ticket;
      return(true);
     }
   return(false);
  }
EvaluateAndTrade — where the demonstration signal and the inference metrics meet. The SMA cross is intentionally uninteresting; what matters is when it runs and how it is timed. It runs on the first tick of each new bar and reads buffer index 0 — the bar that just opened, averaged with the live price — and index 1, the last closed bar, so it is an at-the-open signal rather than a closed-bar one; a closed-bar version would read indices 1 and 2. RecordInference() is fed from a measurement wrapped tightly around the buffer reads and calculation, plus a confidence value from the normalized distance between the two averages. If a CopyBuffer() call fails, the attempt is still timed and passed to RecordInferenceFailure(), so failed or slow reads show up in the histogram and a failure counter. A real ONNX-backed model would report its own output probability through the same call.
//+------------------------------------------------------------------+
//| EvaluateAndTrade                                                 |
//| Demonstration signal harness: a plain fast/slow SMA cross exists |
//| purely to generate real trading activity for the metrics to      |
//| describe, and is not presented as an edge. It runs on the first  |
//| tick of each new bar and reads buffer index 0 (the bar that just |
//| opened, averaged with the live price) and index 1 (the last      |
//| closed bar); a strictly closed-bar signal would read indices 1   |
//| and 2. Confidence is the normalized separation between the two   |
//| SMAs, a stand-in for a real model's output-probability channel.  |
//+------------------------------------------------------------------+
void EvaluateAndTrade(void)
  {
   ulong inference_start_us = GetMicrosecondCount();

   double fast_buf[], slow_buf[];
   ArraySetAsSeries(fast_buf,true);
   ArraySetAsSeries(slow_buf,true);
   if(CopyBuffer(g_fast_ma_handle,0,0,2,fast_buf) < 2 || CopyBuffer(g_slow_ma_handle,0,0,2,slow_buf) < 2)
     {
      //--- a failed read is still an attempt: its duration goes into the
      //--- latency histogram and the failure counter, so slow or failing
      //--- reads are not silently absent from the metric
      double failed_latency_ms = (double)(GetMicrosecondCount() - inference_start_us) / 1000.0;
      g_registry.RecordInferenceFailure(failed_latency_ms);
      Print("EvaluateAndTrade: CopyBuffer failed, skipping this bar");
      return;
     }

   double spread_now  = fast_buf[0] - slow_buf[0];
   double spread_prev = fast_buf[1] - slow_buf[1];
   double point       = SymbolInfoDouble(_Symbol,SYMBOL_POINT);

//--- confidence is deliberately bounded to [0,1] via a fixed 50-point
//--- normalization window; a real ONNX model would report its own
//--- native output range here instead of this proxy calculation
   double confidence = MathMin(MathAbs(spread_now) / (50.0 * point),1.0);

   double inference_latency_ms = (double)(GetMicrosecondCount() - inference_start_us) / 1000.0;
   g_registry.RecordInference(inference_latency_ms,confidence);

   bool cross_up   = (spread_prev <= 0.0 && spread_now > 0.0);
   bool cross_down = (spread_prev >= 0.0 && spread_now < 0.0);

//--- only ever act on THIS EA's own position: FindOwnPosition() scans
//--- by symbol and POSITION_MAGIC, so a position opened by hand, by
//--- another EA, or by this EA on a different chart is never read or
//--- closed here
   ulong own_ticket = 0;
   if(FindOwnPosition(own_ticket))
     {
      if(!PositionSelectByTicket(own_ticket))
         return;
      long pos_type = PositionGetInteger(POSITION_TYPE);
      //--- a position is stale only when the cross has flipped against
      //--- the side it was opened on; a same-direction cross (or no
      //--- cross at all) leaves it open
      bool should_close = (pos_type == POSITION_TYPE_BUY && cross_down) ||
                           (pos_type == POSITION_TYPE_SELL && cross_up);
      if(should_close)
         ClosePositionAndRecord(own_ticket);
      return;
     }

//--- flat book: a fresh cross in either direction opens exactly one
//--- position, sized by the fixed InpLotSize demonstration input
   if(cross_up)
      g_trade.Buy(InpLotSize,_Symbol);
   else
      if(cross_down)
         g_trade.Sell(InpLotSize,_Symbol);
  }
RecordInferenceFailure — counting attempts that never produced a decision. A latency histogram that only sees successful calls hides the cases an operator most wants to see: reads that fail, and reads that fail slowly. The method observes the elapsed time in the same histogram and increments mt5_inference_failures_total.
//+------------------------------------------------------------------+
//| RecordInferenceFailure                                           |
//| Records a signal-evaluation attempt that failed before producing |
//| a decision. The time spent is still observed in the latency      |
//| histogram, so slow failures are not hidden from it, and the      |
//| failure counter makes the failure rate visible on its own.       |
//+------------------------------------------------------------------+
void CMetricsRegistry::RecordInferenceFailure(const double latency_ms)
  {
   m_inference_latency_ms.Observe(latency_ms);
   m_inference_failures.Add(1.0);
  }
ClosePositionAndRecord — pulling real P&L off the closing deal. Profit is not read from the position before it closes; it is read from the closing deal itself, via HistoryDealGetDouble(), including swap and commission — the same fields a Strategy Tester report would total. That value flows straight into RecordTrade(), where the gross-profit/gross-loss split is exercised. It takes the ticket FindOwnPosition() already verified, and closes that specific ticket rather than "whatever is open on _Symbol" — on a hedging account where more than one position can share a symbol, closing by ticket is the only way to be sure which position actually closed. It is also the only path into RecordTrade(): a position closed by a stop-loss or take-profit, manually, by a stop-out, partially, or by another EA never passes through here, so the P&L series describe only positions this EA closed through its own exit rule.
//+------------------------------------------------------------------+
//| ClosePositionAndRecord                                           |
//| Closes the given ticket — already confirmed by FindOwnPosition() |
//| to belong to this EA, on this symbol — then pulls the realized   |
//| profit off the closing deal and feeds it into the registry's     |
//| P&L metrics. This is the only path into RecordTrade(): positions |
//| closed by a stop-loss or take-profit, manually, by a stop-out,   |
//| partially, or by another EA never pass through it.               |
//+------------------------------------------------------------------+
void ClosePositionAndRecord(const ulong ticket)
  {
   if(!g_trade.PositionClose(ticket))
     {
      PrintFormat("ClosePositionAndRecord: PositionClose failed for ticket %I64u, error %d",ticket,GetLastError());
      return;
     }

   ulong deal_ticket = g_trade.ResultDeal();
   if(deal_ticket == 0 || !HistoryDealSelect(deal_ticket))
     {
      Print("ClosePositionAndRecord: could not select the closing deal for P&L");
      return;
     }

   double profit = HistoryDealGetDouble(deal_ticket,DEAL_PROFIT) +
                   HistoryDealGetDouble(deal_ticket,DEAL_SWAP) +
                   HistoryDealGetDouble(deal_ticket,DEAL_COMMISSION);
   g_registry.RecordTrade(profit);
  }
Testing: What the Payload Looks Like on the Wire
There is no Strategy Tester profit/loss result to report here — this is an observability layer, not a trading edge. Testing means confirming three things about the path from the EA to the Pushgateway: that a payload arrives, that the gateway accepts its format, and that two EA instances, one per symbol, land in separate groups under the grouping key instead of overwriting each other. The Prometheus server, Grafana and alert rules were not part of this run, so the queries at the end of the section are examples, not results.
This section reports a real run, not a simulated one. The EA was compiled, attached to a live EURUSD M5 chart and a live GBPUSD M5 chart simultaneously, pointed at a local Pushgateway instance, and left running on a demo account on 17 September 2026, from roughly 19:20 UTC to at least 22:24 UTC by the gateway's own push_time_seconds timestamps — a span of at least three hours; the broker/quote source for that demo account was not separately logged, so it is not stated here. The numbers and figure below are pulled directly from curl http://127.0.0.1:9091/metrics against that gateway, on the same local machine as the terminal, with no intervening network hop; every value in this section is measured.
| Setting | Value |
|---|---|
| Symbols | EURUSD and GBPUSD, two simultaneous chart instances |
| Timeframe | M5 (demonstration harness only) |
| InpFastPeriod/InpSlowPeriod | 10/30 |
| InpPushgatewayHost / Port | 127.0.0.1/9091 (single shared local Pushgateway instance) |
| InpJobName | mt5_prometheus_exporter (shared job; the instance grouping key separates the two EAs) |
| InpPushIntervalSec | 5 |
| WebRequest timeout | 2000 ms |
| Account | Demo account, both charts; broker/quote source not separately logged |
| Test window | 17 September 2026, ~19:20–22:24+ UTC (at least ~3h, by push_time_seconds) |
P&L: no trade closed in this run. No position closed on either symbol, so mt5_gross_profit_total, mt5_gross_loss_total and mt5_net_pnl all read 0 on both instances for the whole run — the counters' correct idle state, since they only move inside RecordTrade(), and RecordTrade() is only reached from ClosePositionAndRecord(). This run does not exercise that path or confirm the gross-profit/gross-loss split on a real loss or gain; that needs a separate run where a position actually closes.
The sample below is GBPUSD's account and P&L series as the gateway returned them, without the HELP and TYPE lines. Job and instance come from the grouping key in the push URL, which the gateway attaches to every series in the group; symbol is a label the EA wrote into the payload body.
mt5_account_balance{instance="GBPUSD",job="mt5_prometheus_exporter",symbol="GBPUSD"} 625.89
mt5_account_equity{instance="GBPUSD",job="mt5_prometheus_exporter",symbol="GBPUSD"} 625.89
mt5_floating_drawdown_percent{instance="GBPUSD",job="mt5_prometheus_exporter",symbol="GBPUSD"} 0
mt5_gross_profit_total{instance="GBPUSD",job="mt5_prometheus_exporter",symbol="GBPUSD"} 0
mt5_gross_loss_total{instance="GBPUSD",job="mt5_prometheus_exporter",symbol="GBPUSD"} 0
mt5_net_pnl{instance="GBPUSD",job="mt5_prometheus_exporter",symbol="GBPUSD"} 0
mt5_model_confidence{instance="GBPUSD",job="mt5_prometheus_exporter",symbol="GBPUSD"} 0.926
Tick-handler latency: almost everything in the fastest bucket. With 16,495 EURUSD tick samples and 18,309 GBPUSD tick samples, both histograms sit in the fastest bucket: 16,490 of 16,495 (99.97%) and 18,305 of 18,309 (99.98%) samples finished in 0.05 ms or less. That is expected, because every tick is recorded and most ticks only compare the bar time and return; the once-per-bar decision passes can only show up in the tail. EURUSD has 1 sample above 10 ms; GBPUSD has 2.
The data cannot say why: the buckets do not preserve per-observation timestamps, so the slow samples cannot be matched to trade events. A decision pass that sends an order includes a broker round trip, which makes that one candidate, but terminal or operating-system scheduling delays would produce the same numbers. Telling them apart needs timestamps for the slow samples and a way to separate tick passes from decision passes.
Measured OnTick handler latency buckets, EURUSD vs GBPUSD
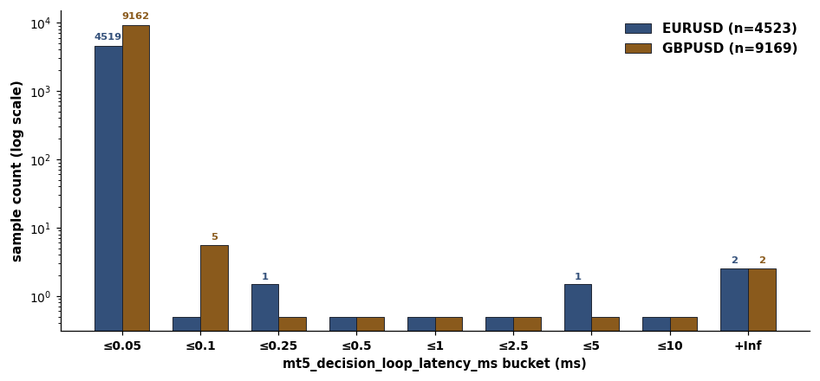
Fig. 2. Per-bucket sample counts of mt5_decision_loop_latency_ms (OnTick handler latency, one sample per tick) read from the live Pushgateway, log-scaled on the y-axis; bars are offset by 0.5 so a zero count still renders a visible sliver rather than vanishing on the log scale.
Signal-evaluation latency: too few samples to describe a distribution. mt5_inference_latency_ms reached 19 samples on each symbol, one per new bar — too few to say anything about a distribution. On both symbols 18 of the 19 samples fall in the ≤0.5 ms bucket, and the last sample is the only one above 100 ms; that single sample accounts for at least 306 ms of EURUSD's 315.333 ms sum and at least 102 ms of GBPUSD's 110.806 ms sum. No conclusion about either symbol is drawn from these numbers.
| Symbol | Samples | Sum (ms) | Mean (ms) |
|---|---|---|---|
| EURUSD | 19 | 315.333 | 16.596 |
| GBPUSD | 19 | 110.806 | 5.832 |
Confirming the two instances stayed separate. The property to check lives in the grouping key, not in the payload. The gateway's status page listed two groups under the same job, instance="EURUSD" and instance="GBPUSD" — that listing, not a saved copy of the raw text, is what this check was confirmed against during the run, so the command below is given for self-checking rather than as output already captured here. Running it against a live gateway holding both groups prints every mt5_ series twice, once per instance, each carrying its own instance label; the GBPUSD sample earlier in this section is one line from exactly that output. The symbol label is separate and user-chosen: two EAs sharing a grouping key would overwrite each other while each still wrote its own symbol, so distinct symbol values alone would prove nothing.
curl.exe http://127.0.0.1:9091/metrics | findstr mt5_ // run this against a live gateway to self-check; see the GBPUSD sample above for one real line it produces
That doubling — every mt5_ series once per instance, with its own instance label carried through — is what this check is confirming, independent of whatever the P&L values happen to be. The account-level gauges look per-symbol but are not: in this run balance and equity both matched exactly at 625.89 on both instances, because AccountInfoDouble() reports the same account either way; a pull taken mid-tick on one instance and not the other can show a brief mismatch instead, which would not mean anything symbol-specific either.
Example queries. Prometheus was not part of this run, so these are examples written against the series above, not results. They assume the scrape job with honor_labels: true, so job and instance keep their pushed values. Account-level series are identical on every instance, so they are aggregated with max(); sum() would count the account once per instance. The staleness alert uses push_time_seconds, which the gateway writes for every group itself.
| Goal | PromQL |
|---|---|
| Account-wide floating drawdown | max(mt5_floating_drawdown_percent{job="mt5_prometheus_exporter"}) |
| p95 tick-handler latency for GBPUSD, 5m window | histogram_quantile(0.95, sum by (le) (rate(mt5_decision_loop_latency_ms_bucket{instance="GBPUSD"}[5m]))) |
| Net realized P&L per instance over one day | sum by (instance) (increase(mt5_gross_profit_total[1d])) - sum by (instance) (increase(mt5_gross_loss_total[1d])) |
| Failed signal evaluations per second, GBPUSD | rate(mt5_inference_failures_total{instance="GBPUSD"}[15m]) |
| Alert if an instance stops pushing | time() - push_time_seconds{job="mt5_prometheus_exporter"} > 60 |
Limitations and Practical Considerations
The account-level gauges are account-wide, not per-symbol, despite the label. mt5_account_equity, mt5_account_balance and mt5_floating_drawdown_percent come from AccountInfoDouble(), which reports the whole account, not the chart's symbol. Two instances on one account read the same account at different moments in their own OnTimer() calls, so nothing stops their series from drifting apart even though nothing symbol-specific changed; an earlier pull during testing showed exactly that, with the balance matching across both instances while the two equity readings differed by tens of currency units. These series should therefore not be compared between symbols or summed across instances; aggregate them with max() and keep per-symbol comparisons to the truly per-instance metrics: trade P&L, latency, confidence. A cleaner design pushes the account metrics from one dedicated instance with its own grouping key.
The Pushgateway is a workaround for a native EA, and it has known costs. Pushed series stay on the gateway until deleted or the gateway restarts, so a crashed EA leaves its last equity and drawdown looking current, and the up metric stops saying whether the EA is alive — it only says whether the gateway is. The push_time_seconds alert is a mitigation, not a cure; a DELETE request from OnDeinit() would clear the final values on a normal removal but does nothing after a crash. A relay process on the terminal machine, which the EA posts to and Prometheus scrapes as an ordinary /metrics target, restores the up metric and removes the stale-series problem, at the price of a second process — the thing this design set out to avoid. One gateway per terminal at least limits how many series a single failure can leave stale.
WebRequest is synchronous, and an EA is single-threaded. While Push() waits, up to InpPushTimeoutMs (2000 ms by default), the EA does nothing else: OnTick() cannot run during a push, and ticks arriving meanwhile may be delayed or skipped by the terminal. On a healthy local gateway the wait is short, but an unreachable gateway can cost the full timeout on every push, delaying the trading logic by the same amount, and the handler-latency histogram will not show it, because its timer starts when OnTick() starts. Keep the push interval well above the timeout and treat a remote gateway as a risk to the trading loop.
The P&L series cover only what this EA closes, and only since it started. RecordTrade() is fed only by ClosePositionAndRecord(), so trades closed by stop-loss, take-profit, by hand, by a stop-out, partially, or by another EA are absent; the HELP text says "closed by this EA instance" for that reason. FindOwnPosition()'s magic-number and symbol filter keeps EvaluateAndTrade() itself from touching a position it does not own, but it only guards the one close path this EA drives — it does not watch for closes that happen outside it. Values restart from zero whenever the EA is re-attached: the counters tolerate that, since increase() treats the drop as a restart, but mt5_net_pnl is a gauge and simply loses its value.
A fuller design would also record closing deals from OnTradeTransaction(), filtered the same way, and rebuild totals from HistorySelect() on start, so a restart does not lose history; that part is not implemented here. Nor does FindOwnPosition() handle more than one of this EA's own positions on the same symbol: on a hedging account it acts on whichever one it finds first, which is adequate for this single-position-per-symbol demonstration but not for a general hedging-aware manager.
One histogram, two kinds of pass. mt5_decision_loop_latency_ms records every tick, but the decision step runs only on the first tick of a new bar, so the histogram mixes many cheap passes with a few expensive ones. Its p95 and p99 can remain in the fastest bucket even when the decision pass is slow. Separating tick passes and decision passes with a label, or using a dedicated histogram for the decision pass, gives percentiles that mean what their names suggest.
The confidence metric is a proxy, not a probability. EvaluateAndTrade()'s confidence value is a normalized MA-separation distance, bounded into [0,1] by a fixed 50-point window that was picked by inspection, not calibration. mt5_model_confidence's own HELP line says so directly — # HELP mt5_model_confidence Demonstration proxy derived from SMA separation; not a calibrated probability or a model-quality signal. — and the same reason it is unsuitable as a probability is why it stays out of the alerting examples above: a threshold on an uncalibrated proxy has no principled meaning. A real ONNX classification head reports an actual probability with its own natural range and calibration properties; swapping one in means replacing that one calculation and the HELP string with it, not touching RecordInference() or anything downstream of it.
The Pushgateway has no authentication by default. The official image accepts a PUT from anyone who can reach its port, with no API key and no TLS unless it sits behind a reverse proxy configured to terminate TLS and enforce authentication. That is a reasonable default for a gateway running on the same host or a trusted local network — which is the deployment this article assumes — but it means the gateway should never be exposed directly to the open internet. A terminal running on a VPS reachable from outside needs that port firewalled to the Prometheus server's own address, not left open on the assumption that an obscure port number is protection enough.
The job/instance grouping key is a real collision hazard with more than one chart. CPushgatewayClient::Init() is called with _Symbol as the instance label, which is enough to keep an EURUSD instance and a GBPUSD instance of this same EA — both running against the same Pushgateway — from overwriting each other's series. It is not enough if two EAs are both watching the same symbol on different timeframes, or if the same EA is attached to two charts of the same symbol at once for a live/shadow comparison — both would push to the identical job+instance pair and silently replace each other's metrics on every interval, with no error from either side. Anywhere that can happen, the instance label needs something more specific folded in, such as _Symbol + "_" + EnumToString(_Period), before the first deployment, not after the collision is noticed on a dashboard.
Histogram bucket bounds are fixed at compile time and chosen once, up front. mt5_inference_latency_ms and mt5_decision_loop_latency_ms use different bound sets because their expected scales differ by roughly an order of magnitude; if a bound set turns out too coarse (everything lands in the last bucket) or too fine (nothing ever reaches the upper bounds) once real data comes in, the fix is to adjust the bound arrays passed into CHistogram::Init() in CMetricsRegistry::Init() and recompile — Prometheus histograms cannot be re-bucketed after the fact without losing history.
String concatenation for the exposition payload is fine at this scale, not at every scale. RenderExposition() builds its output with repeated MQL5 string concatenation, which is adequate for the roughly a dozen metric lines this EA produces. An exporter tracking hundreds of symbols or exposing a much larger metric set would want to profile that path before assuming it stays cheap — MQL5 strings are copy-on-write, and concatenation in a loop has the usual quadratic-cost failure mode if it is not watched.
What carries over to a real deployment. The demonstration signal is not production trading logic, and the observability layer is not finished infrastructure either: it needs the scrape job, the staleness alert, broader capture of closed deals and a decision about the account-level series. What carries over to a real strategy unchanged is the metric-type discipline, the escaping and encoding helpers, and the grouping-key rule for avoiding collisions.
Conclusion
The interesting constraint in this build was not Prometheus — its text format and Pushgateway model are simple and well documented — but discovering, before writing any exporter code, that MQL5 cannot run the listening server the topic seems to call for. The design that follows needs no DLL or invented socket functions, and the EA never has to defend an open port. In exchange, the Pushgateway moves the reachability question instead of removing it: Prometheus can see whether the gateway is up, but not whether the EA is alive, which is why the push_time_seconds alert belongs to the design.
What is left is a small, typed metrics layer — a counter that refuses to go backward, a gauge that does not pretend to be one, a histogram whose bucket math is cumulative by construction rather than by convention, and escaping and encoding helpers so free text cannot corrupt the payload — wired into an EA's existing tick and timer loop with measured latency numbers. That combination is reusable well beyond the SMA-cross harness shown here: point RecordInference() and RecordTrade() at any real model or strategy and the observability underneath it does not change.
| File | Type | Description |
|---|---|---|
| MetricsRegistry.mqh | Include | CCounter/CGauge/CHistogram primitives, escaping and bound-formatting helpers, and CMetricsRegistry, which owns and renders every metric this EA exposes. |
| PushgatewayClient.mqh | Include | Outbound WebRequest() client that PUTs the rendered payload to a Prometheus Pushgateway, with URL path-segment encoding. |
| PrometheusExporter_EA.mq5 | Expert Advisor | Wires the registry and pushgateway client into OnTick()/OnTimer(), with a demonstration SMA-cross signal harness. |
Warning: All rights to these materials are reserved by MetaQuotes Ltd. Copying or reprinting of these materials in whole or in part is prohibited.
This article was written by a user of the site and reflects their personal views. MetaQuotes Ltd is not responsible for the accuracy of the information presented, nor for any consequences resulting from the use of the solutions, strategies or recommendations described.