

From Basic to Intermediate: Subwindows (II)
 144
 0

Introduction
In the previous article, From Basic to Intermediate: Subwindows (I), we began discussing subwindows. Although this was just a brief introduction, what we saw there is extremely important for understanding what comes next. No matter how simple this introductory section may seem, don't assume that you already know how to work with subwindows just because you can do a few simple things with them. Subwindows offer some very interesting possibilities, and if you plan their use carefully in your code, you can implement solutions that would otherwise be impossible—or at least not as easy to implement.
Well, I don't want to dwell on this for too long before moving on to the main topic, so let's continue with our usual routine. It's time to set aside all distractions and focus on what I'm about to explain. So, let's get down to business.
Subwindows (II)
One of the first things many beginner programmers try to do is create an Expert Advisor for trading. In doing so, they usually add a large number of controls. As a result, the chart ends up cluttered with objects that would be better placed elsewhere—in a subwindow. That way, the main chart will remain uncluttered, and we'll be able to clearly see what's happening on each bar.
So, placing controls in a subwindow is a good idea. However, there is one condition:SUBWINDOWS CAN ONLY BE CREATED USING AN INDICATOR.
This is where things start to get complicated, especially if you don't yet have experience implementing solutions like this. Later, I'll explain clearly and simply how to do this. For now, dear reader, I ask you to be patient, since we're just beginning to explore subwindows. I wanted to give this example to encourage you to read these articles carefully. Some people might think this is a waste of time, but each point we'll cover will be important for understanding the articles that follow.
To start, let's take a closer look at the issue we touched on in the previous article: how your indicator calculates the curve that will be displayed in the subwindow. This again? I think I've figured out how to get my indicator to perform the calculation correctly. Oh, is that so, dear reader? Do you really know how to do that?
I don't think many people know how to do that. Not because I consider myself a genius, but because I've seen what other programmers do. To explain this as simply as possible, we'll use one of the code examples from the previous article. This time, we'll use an even simpler calculation in the example: the more elements there are in the code, the harder it is to explain and understand. Below is the code we'll be using.
01. //+------------------------------------------------------------------+
02. #property copyright "Daniel Jose"
03. //+------------------------------------------------------------------+
04. #property description "DEMO Indicator"
05. //+------------------------------------------------------------------+
06. const struct stAverange
07. {
08.     int            nPeriods;
09.     ENUM_MA_METHOD Method;
10.     color          cor;
11. }Averange[] =
12. {
13.     {20, MODE_SMA, clrBlack}
14. };
15. //+----------------+
16. #property indicator_chart_window
17. #property indicator_applied_price   PRICE_CLOSE
18. #property indicator_buffers         Averange.Size();
19. #property indicator_plots           Averange.Size();
20. //+------------------------------------------------------------------+
21. struct stInfos
22. {
23.     double  Buff[];
24. }Infos[Averange.Size()];
25. //+------------------------------------------------------------------+
26. int OnInit(void)
27. {
28.     for (uint c = 0; c < Averange.Size(); c++)
29.     {
30.         SetIndexBuffer(c, Infos[c].Buff, INDICATOR_DATA);
31.         PlotIndexSetInteger(c, PLOT_DRAW_TYPE, DRAW_LINE);
32.         PlotIndexSetInteger(c, PLOT_LINE_STYLE, STYLE_SOLID);
33.         PlotIndexSetInteger(c, PLOT_LINE_WIDTH, 2);
34.         PlotIndexSetInteger(c, PLOT_LINE_COLOR, Averange[c].cor);
35.         PlotIndexSetString(c, PLOT_LABEL, StringFormat("Arithmetic of %d", Averange[c].nPeriods));
36.     }
37.
38.        return INIT_SUCCEEDED;
39. };
40. //+------------------------------------------------------------------+
41. int OnCalculate(const int rates_total, const int prev_calculated, const int begin, const double &price[])
42. {
43.
44.     for (uint c = 0; c < Averange.Size(); c++)
45.     {
46.         if (prev_calculated == 0)
47.         {
48.             double loc = 0;
49.             for (int c1 = 0; c1 < Averange[c].nPeriods; c1++) loc += price[Averange[c].nPeriods - c1];
50.                 Infos[c].Buff[Averange[c].nPeriods] = loc / Averange[c].nPeriods;
51.         }
52.         switch (Averange[c].Method)
53.         {
54.             case MODE_SMA:
55.                 for (int i = (prev_calculated > 0 ? prev_calculated - 1 : Averange[c].nPeriods + 1); i < rates_total; i++)
56.                     Infos[c].Buff[i] = ((Infos[c].Buff[i - 1] * Averange[c].nPeriods) - price[i - Averange[c].nPeriods] + price[i]) / Averange[c].nPeriods;
57.                 break;
58.         }
59.     }
60.
61.     return rates_total;
62. };
63. //+------------------------------------------------------------------+
Code 01
Thanks to line 13, Code 01 correctly calculates the arithmetic mean that we want to plot. But do you know the calculation direction? The following figure shows the calculated average and the calculation direction.
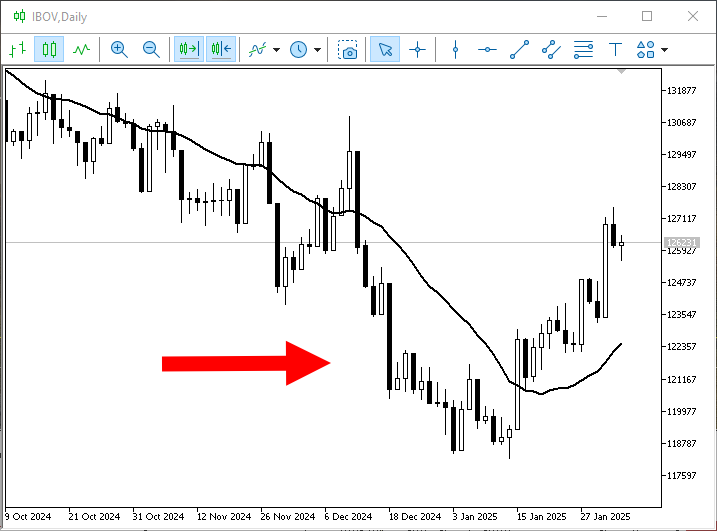
Image 01
The arrow in Image 01 indicates the calculation direction; the black line represents the calculated average. Why is it important to know this? You might think that, in practice, this doesn't matter at all. And, dear reader, in most cases, the calculation direction doesn't matter. However, in programming, you can't rely solely on common sense. Programmers implement what is required of them, regardless of what common sense might suggest. Their code must produce the expected result; how they achieve that is secondary.
However, in programming, 2 + 3 may be different from 3 + 2. How is that possible? In my articles on operator overloading, I've shown that operations don't always work the way many people imagine they do. Therefore, depending on what you're trying to do, the calculation might work in one direction, while in the other direction the code might fail. Code 01 is a good example of this.
To begin analyzing it, let's add a volume indicator, as shown below.
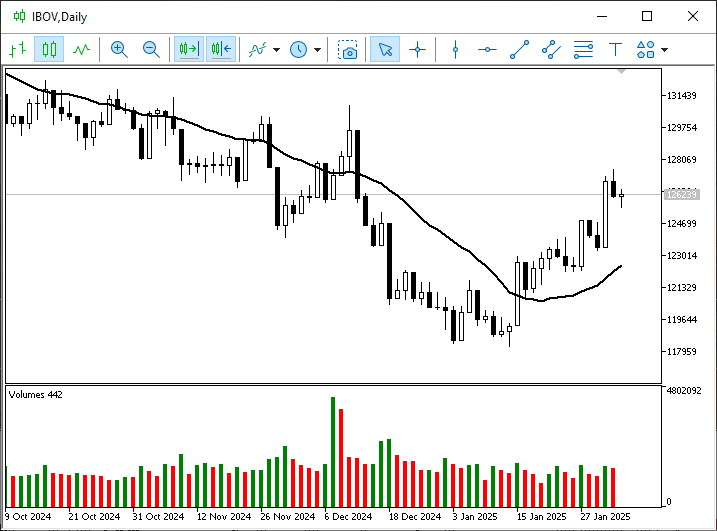
Image 02
Now we'll add the indicator from code 01 to the volume indicator. This way, we'll be able to see the average volume over the last 20 periods. We'll do it as shown in the following animation.
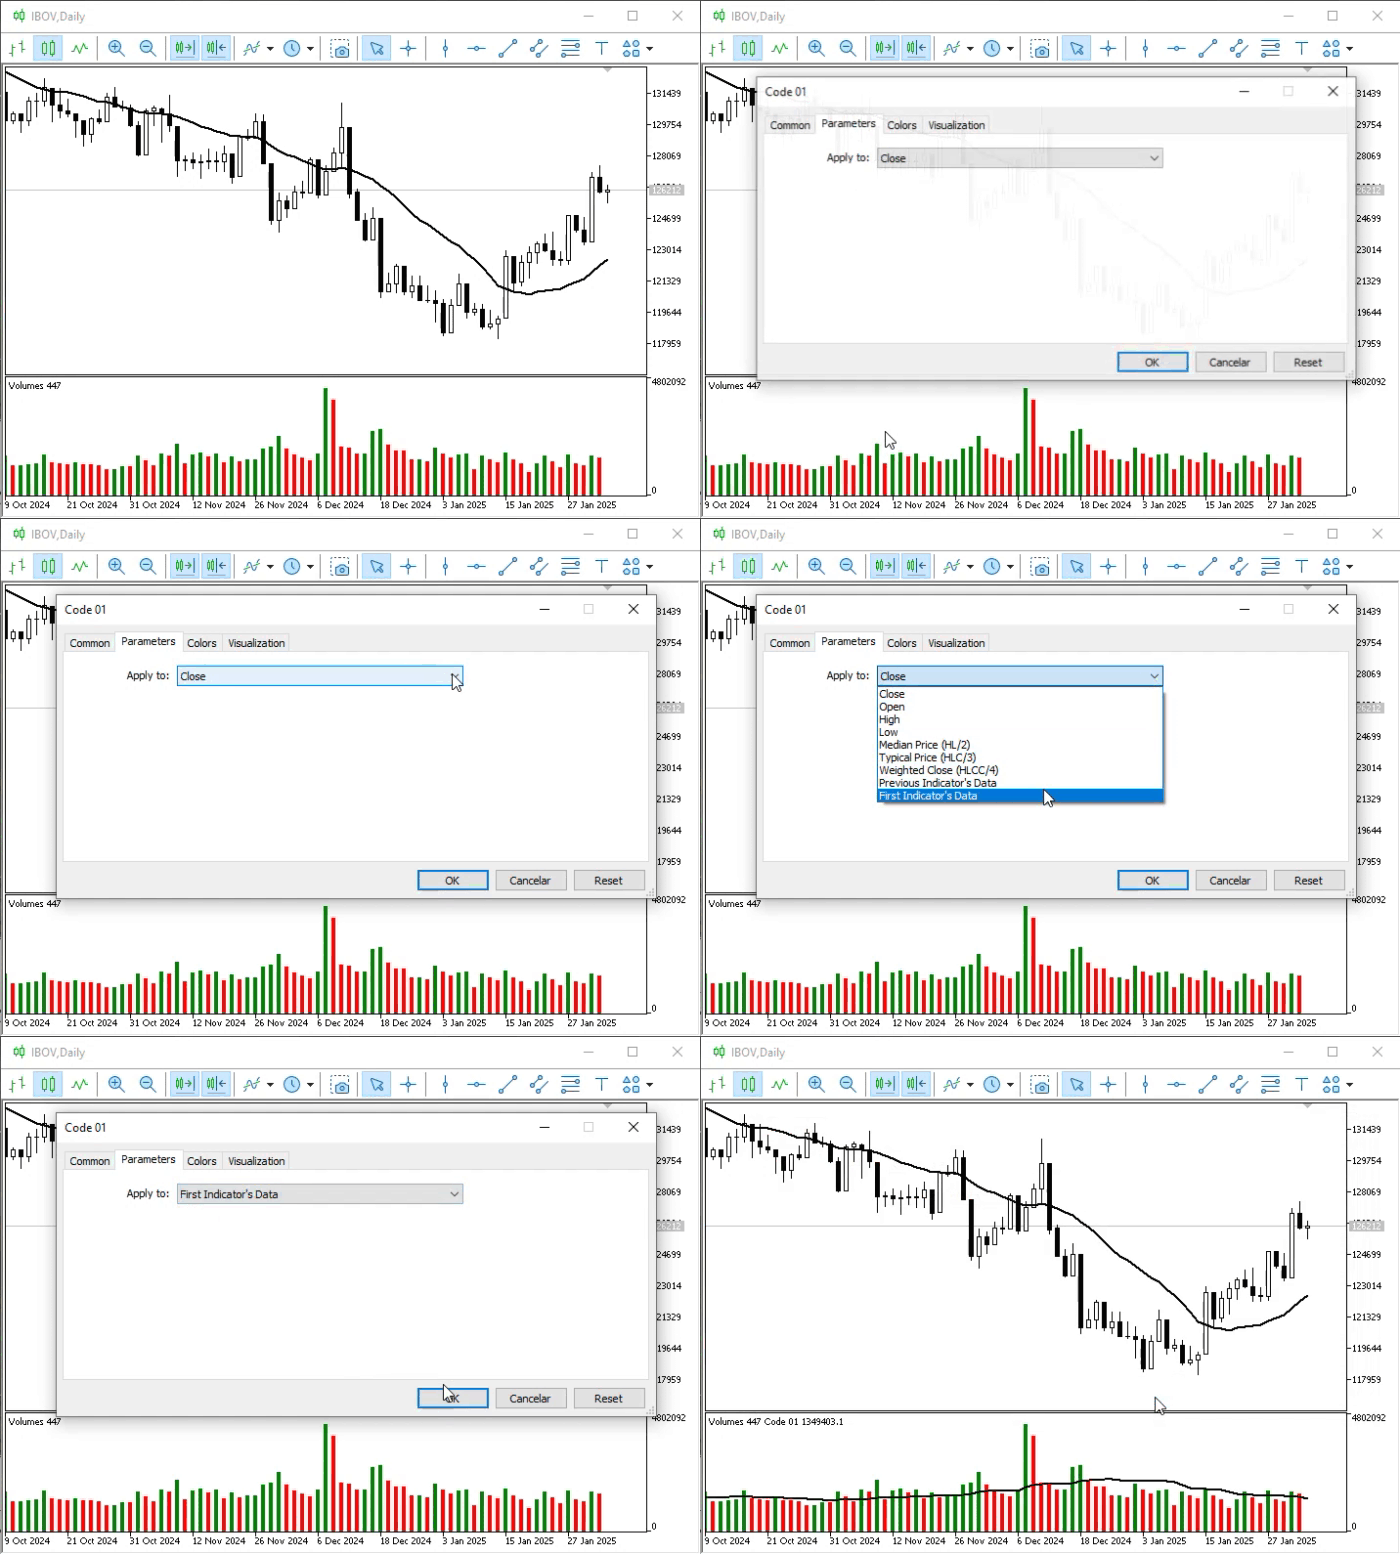
Animation 01
As expected, everything worked. However, this does not mean that code 01 is appropriate for every situation. Now let's consider a case in which this will not produce the desired result. To do this, we'll remove the volume indicator and add a different type of indicator. But first, dear reader, I'd like to show you something. The following image shows these settings.
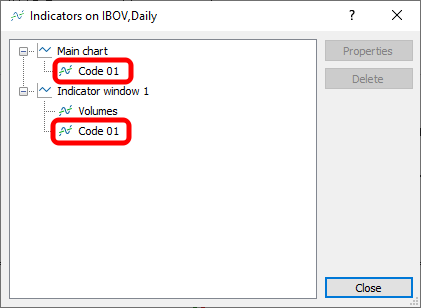
Image 03
Note that Image 03 shows two indicators that use code 01. Keep this in mind, because this detail will come in very handy later on. Now we'll add another indicator, as shown in the following animation.
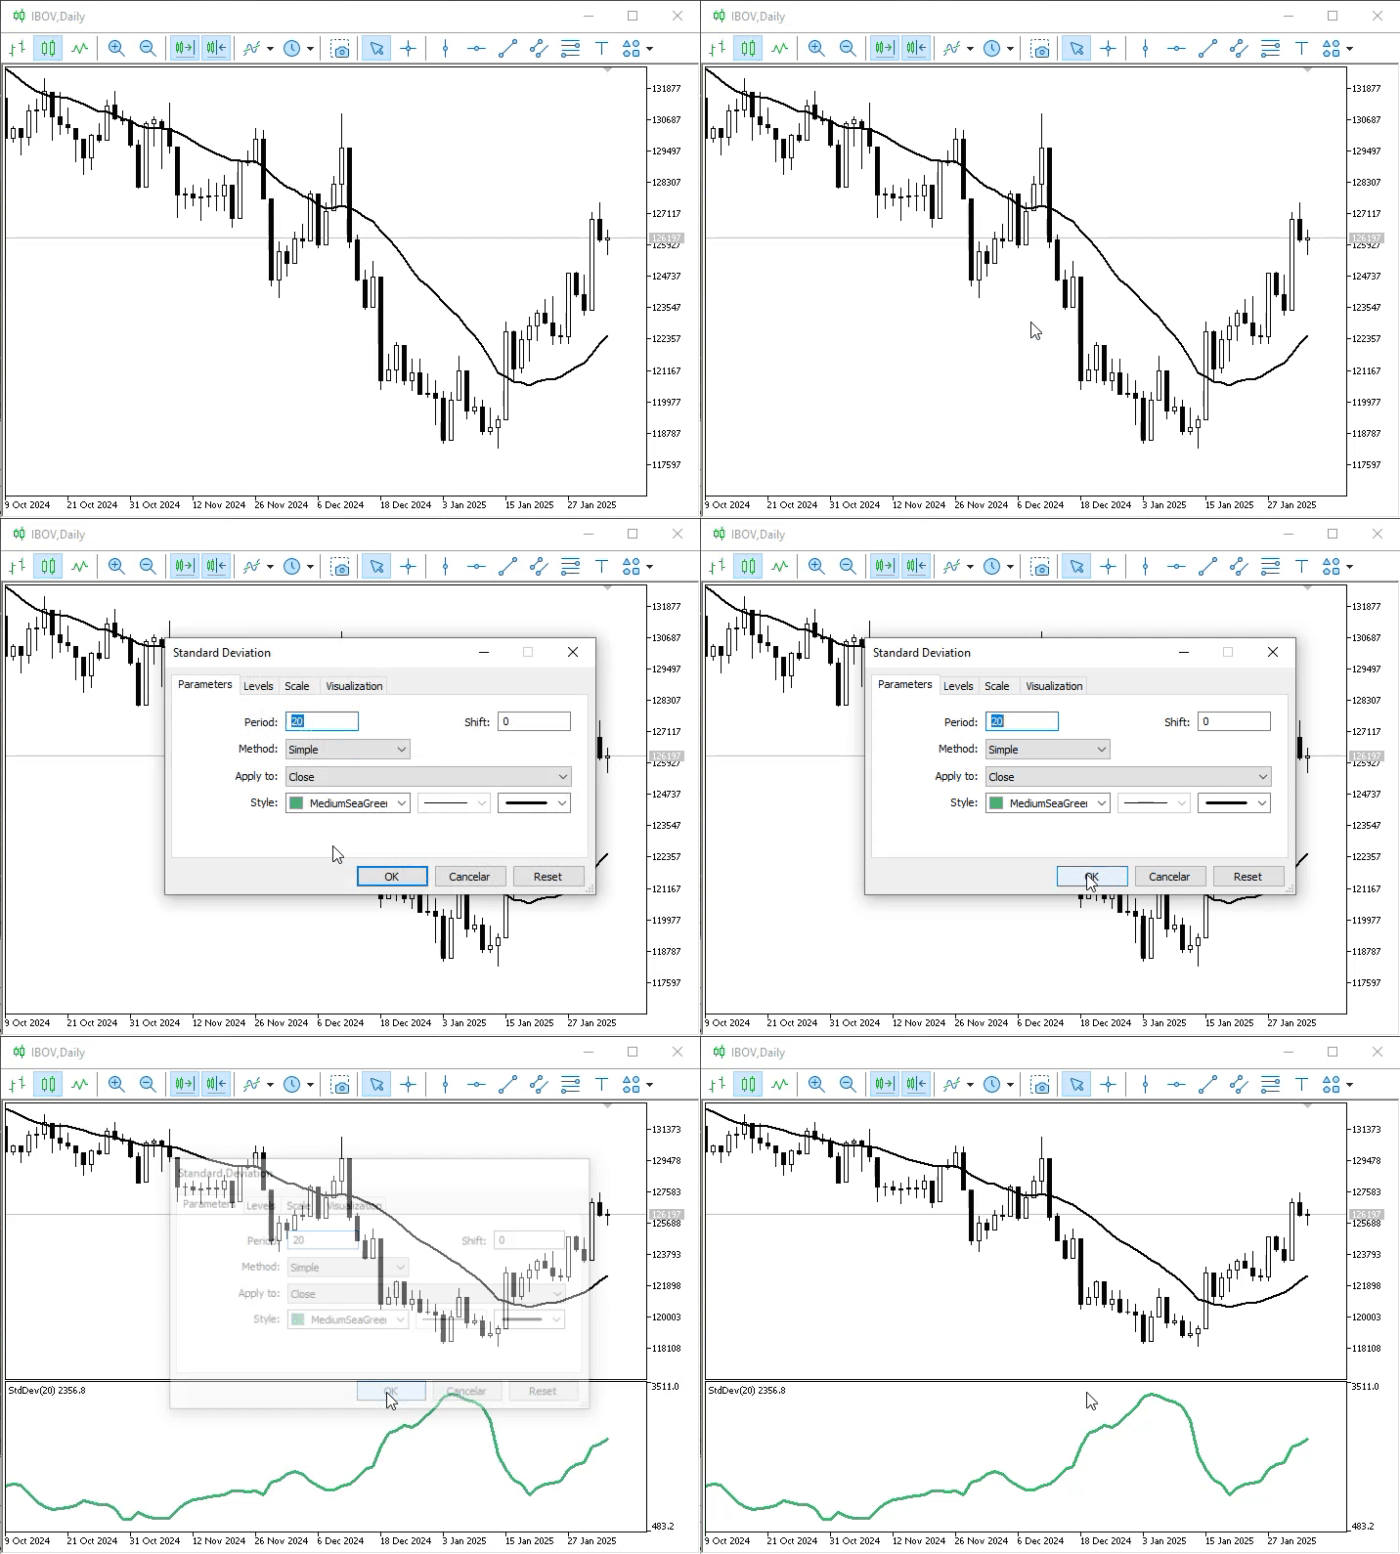
Animation 02
It doesn't matter why I chose this indicator: I just picked it at random from the available options. If you'd like, you can try another one later. Now we need to calculate a second moving average based on the indicator's values in the subwindow to smooth out the green moving average that it plots. To do this, we will use the indicator from code 01. You'll need to add it using the method we've already covered. Once plotted, a second average will appear: the arithmetic mean of the last twenty values previously calculated by the indicator in the subwindow.
Let's do what's shown in the following animation.
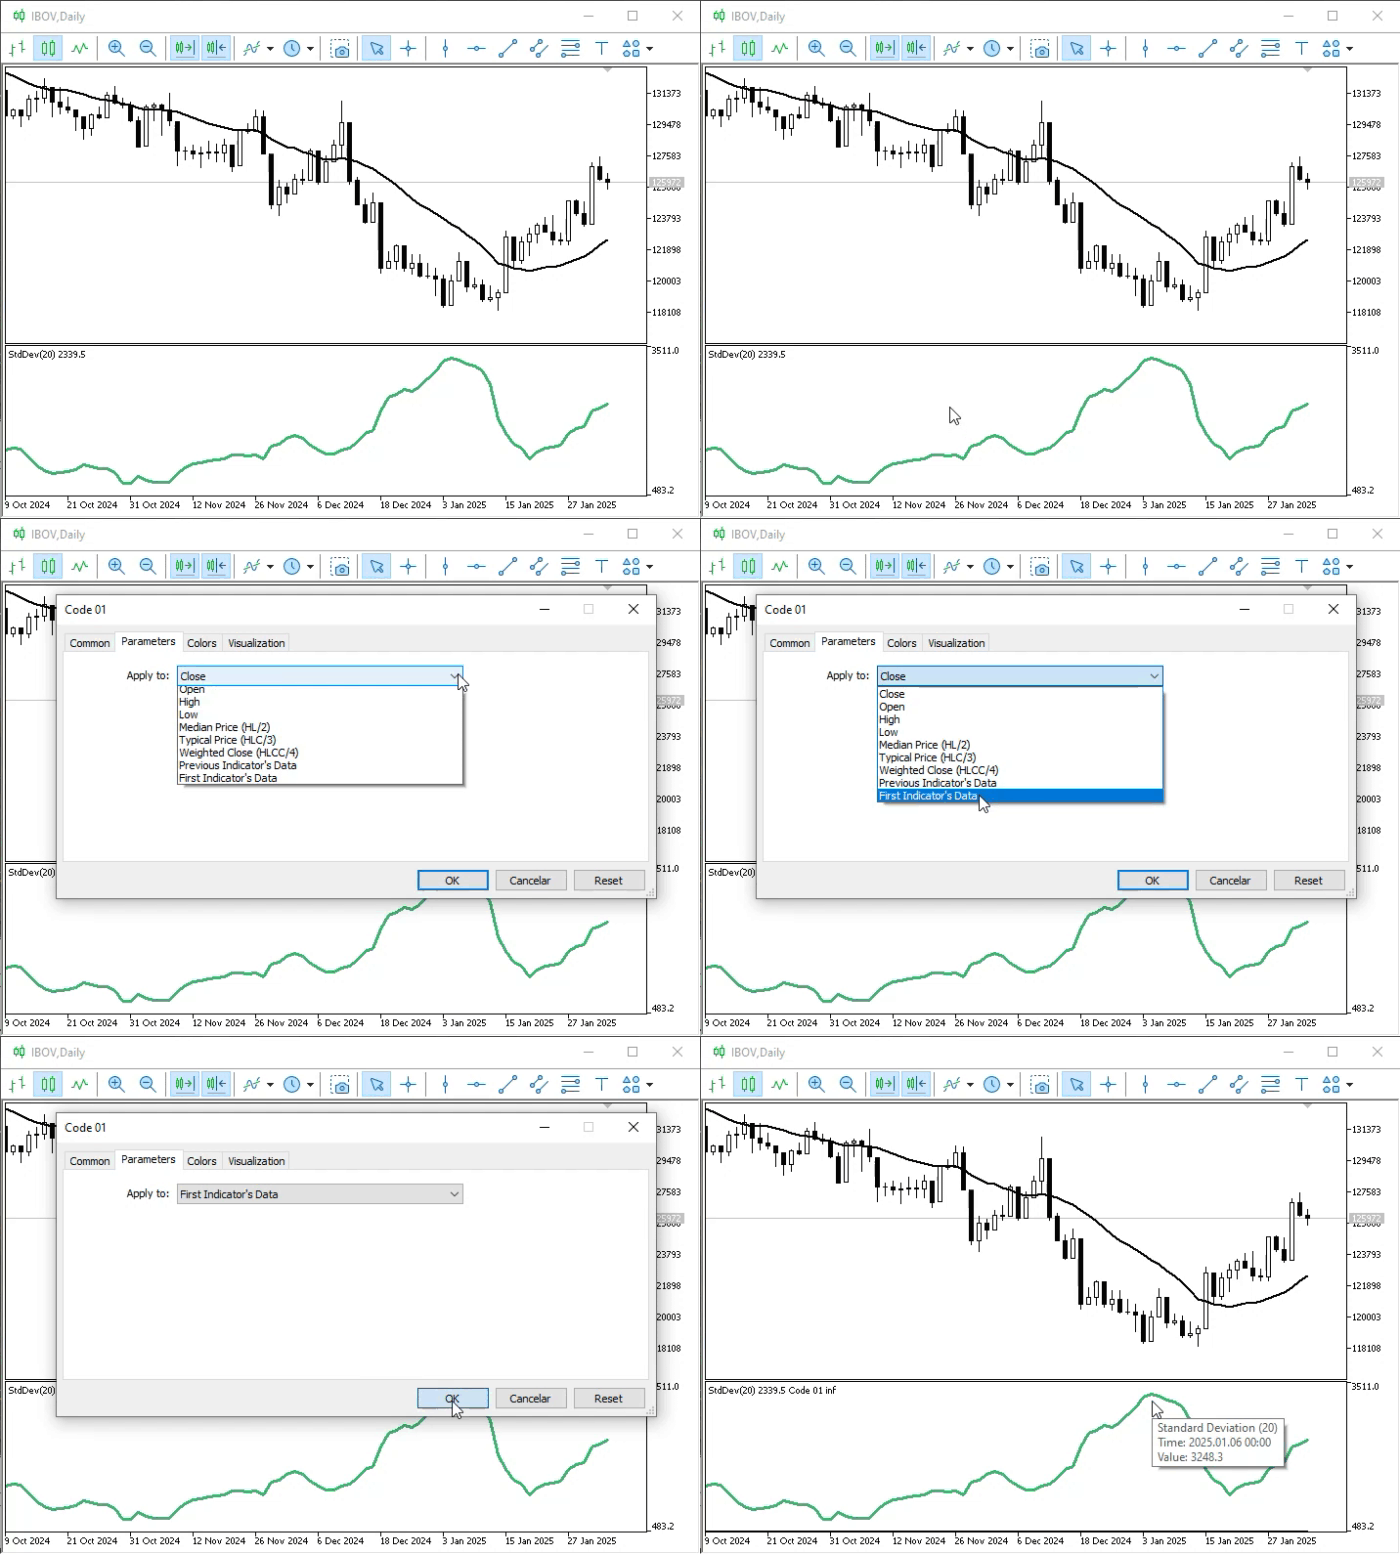
Animation 03
But what happened? Where is the indicator? Could some kind of catastrophic failure have caused it to disappear from the chart? Hmm, I don't get it. Well then, dear reader, you're starting to realize that things aren't as simple as you thought, right? Let's see what happened. First, let's check the terminal for any messages indicating a possible failure.
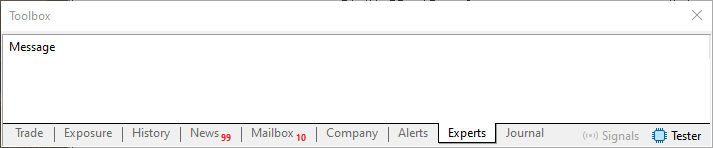
Image 04
As shown in Image 04, no errors were reported. Let's try another way to figure out what happened: let's look at the list of indicators. There, we'll see what's shown in the following image.
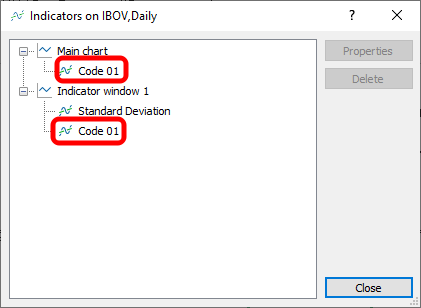
Image 05
Hmm, that's strange. Image 05 shows that the indicator appears in the list where it should be, even though it is not displayed on the chart. All right, I give up. I think I'll do something else. Programming is definitely not for me. Don't worry, dear reader. Remember that the purpose of these articles is to teach you how to achieve your goals. To do this, you need to understand how to identify the failures and errors indicated by your code's behavior. If you watch Animation 03 closely, you'll notice something on the chart. To see this more clearly, let's pause the animation on a single frame and take our time examining this detail.
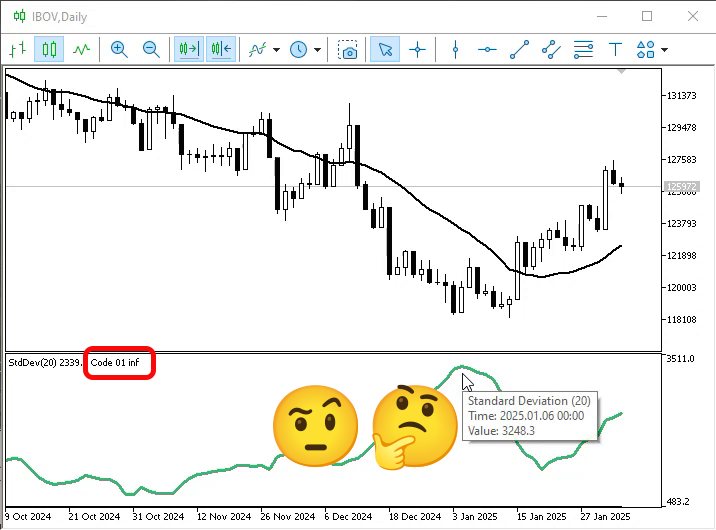
Image 06
Please note the point I've highlighted in the image. The highlighted value should be different. Does this mean that we cannot calculate the average of the values using an indicator like the one shown in Image 06? Let's conduct one more experiment to answer this question. Keep in mind that Code 01 calculates the arithmetic mean over twenty periods. Now we'll use another indicator built into MetaTrader 5 to check whether the problem lies with our indicator or whether there's another reason why it isn't showing up on the chart. The following animation demonstrates this test.
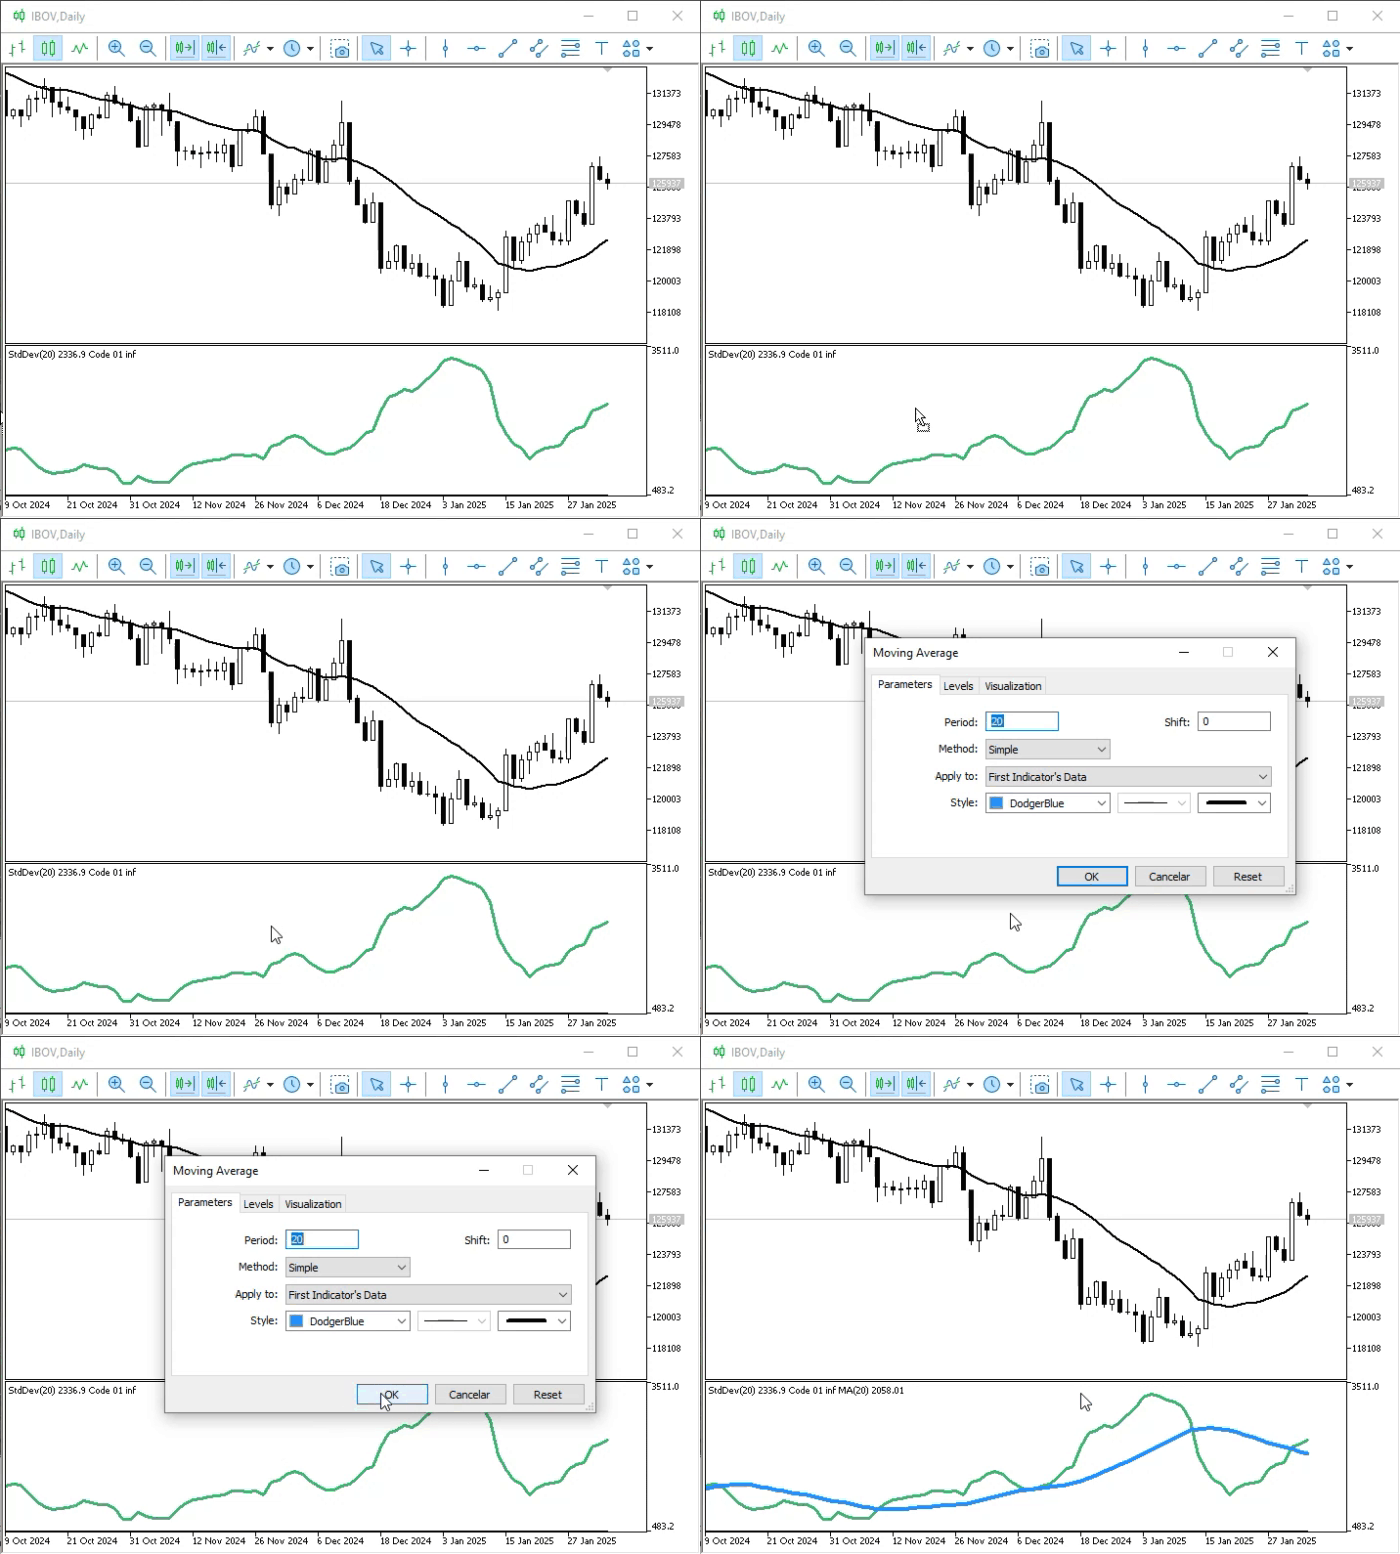
Animation 04
How interesting! It turns out it does work after all. So there's a bug in our code. That's right, dear reader. Well, now I don't know how to fix this: unlike in the previous article, where we had MetaTrader 5 perform the calculation, this time we're doing it ourselves, and yet the indicator is failing. Why?
The reason lies in the calculation direction, as we saw in Image 01. Code 01 performs the calculation from the oldest data to the newest. It's possible that at some point this data is processed incorrectly, causing the indicator to malfunction and preventing the average from being plotted. This happens because the indicator contains incorrect data. That is precisely why the value we saw in Image 06 appears.
Can you see how everything is starting to come together and how these elements are connected? If I had simply shown you code that works flawlessly, you wouldn't have been able to figure out where the error was, because it's not obvious at first glance.
How can we fix Code 01 so that the average is plotted in the subwindow? We need to change the calculation direction within the OnCalculate procedure. In other words, the calculation should start with the most recent values and work backward to the older ones. To do this, we'll modify Code 01 as shown below.
01. //+------------------------------------------------------------------+
02. #property copyright "Daniel Jose"
03. //+------------------------------------------------------------------+
04. #property description "DEMO Indicator"
05. //+------------------------------------------------------------------+
06. const struct stAverange
07. {
08.     int            nPeriods;
09.     ENUM_MA_METHOD Method;
10.     color          cor;
11. }Averange[] =
12. {
13.     {20, MODE_SMA, clrYellow}
14. };
15. //+----------------+
16. #property indicator_chart_window
17. #property indicator_applied_price   PRICE_CLOSE
18. #property indicator_buffers         Averange.Size();
19. #property indicator_plots           Averange.Size();
20. //+------------------------------------------------------------------+
21. struct stInfos
22. {
23.     double  Buff_iMA[],
24.             f_Expo;
25. }Infos[Averange.Size()];
26. //+------------------------------------------------------------------+
27. int OnInit(void)
28. {
29.     for (uint c = 0; c < Averange.Size(); c++)
30.     {
31.         SetIndexBuffer(c, Infos[c].Buff_iMA, INDICATOR_DATA);
32.         Infos[c].f_Expo = (double) (2.0 / (1.0 + Averange[c].nPeriods));
33.         PlotIndexSetInteger(c, PLOT_DRAW_TYPE, DRAW_LINE);
34.         PlotIndexSetInteger(c, PLOT_LINE_STYLE, STYLE_SOLID);
35.         PlotIndexSetInteger(c, PLOT_LINE_WIDTH, 1);
36.         PlotIndexSetInteger(c, PLOT_LINE_COLOR, Averange[c].cor);
37.         PlotIndexSetString(c, PLOT_LABEL, StringFormat("%s of %d", (Averange[c].Method == MODE_EMA ? "Exponential" : "Arithmetica"), Averange[c].nPeriods));
38.     }
39.
40.        return INIT_SUCCEEDED;
41. };
42. //+------------------------------------------------------------------+
43. int OnCalculate(const int rates_total, const int prev_calculated, const int begin, const double &price[])
44. {
45.     int c0 = 0;
46.     double value;
47.
48.     for (uint c = 0; c < Averange.Size(); c++) switch (Averange[c].Method)
49.     {
50.         case MODE_SMA:
51.             for (int i = rates_total - 1; i > prev_calculated; i--)
52.             {
53.                 value = 0;
54.                 for (int j = 0; (i - j) > 0 && j < Averange[c].nPeriods; j++)
55.                     value += price[i - j];
56.                 Infos[c].Buff_iMA[i] = value / Averange[c].nPeriods;
57.             }
58.             break;
59.     }
60.
61.     return rates_total;
62. };
63. //+------------------------------------------------------------------+
Code 02
And now, dear reader, please pay attention. Code 02 reverses the calculation direction. Depending on how we implement this change, we'll have to adapt the code in one way or another. Since the purpose here is educational, I'm using the arithmetic mean, which allows us to work with much simpler code. Everything discussed so far also applies to code 02. However, there is one difference: when we apply the indicator from code 02 to the indicator added to the chart in animation 02, we get a result that is very different from what we saw in animation 03. You can see this in the following animation.
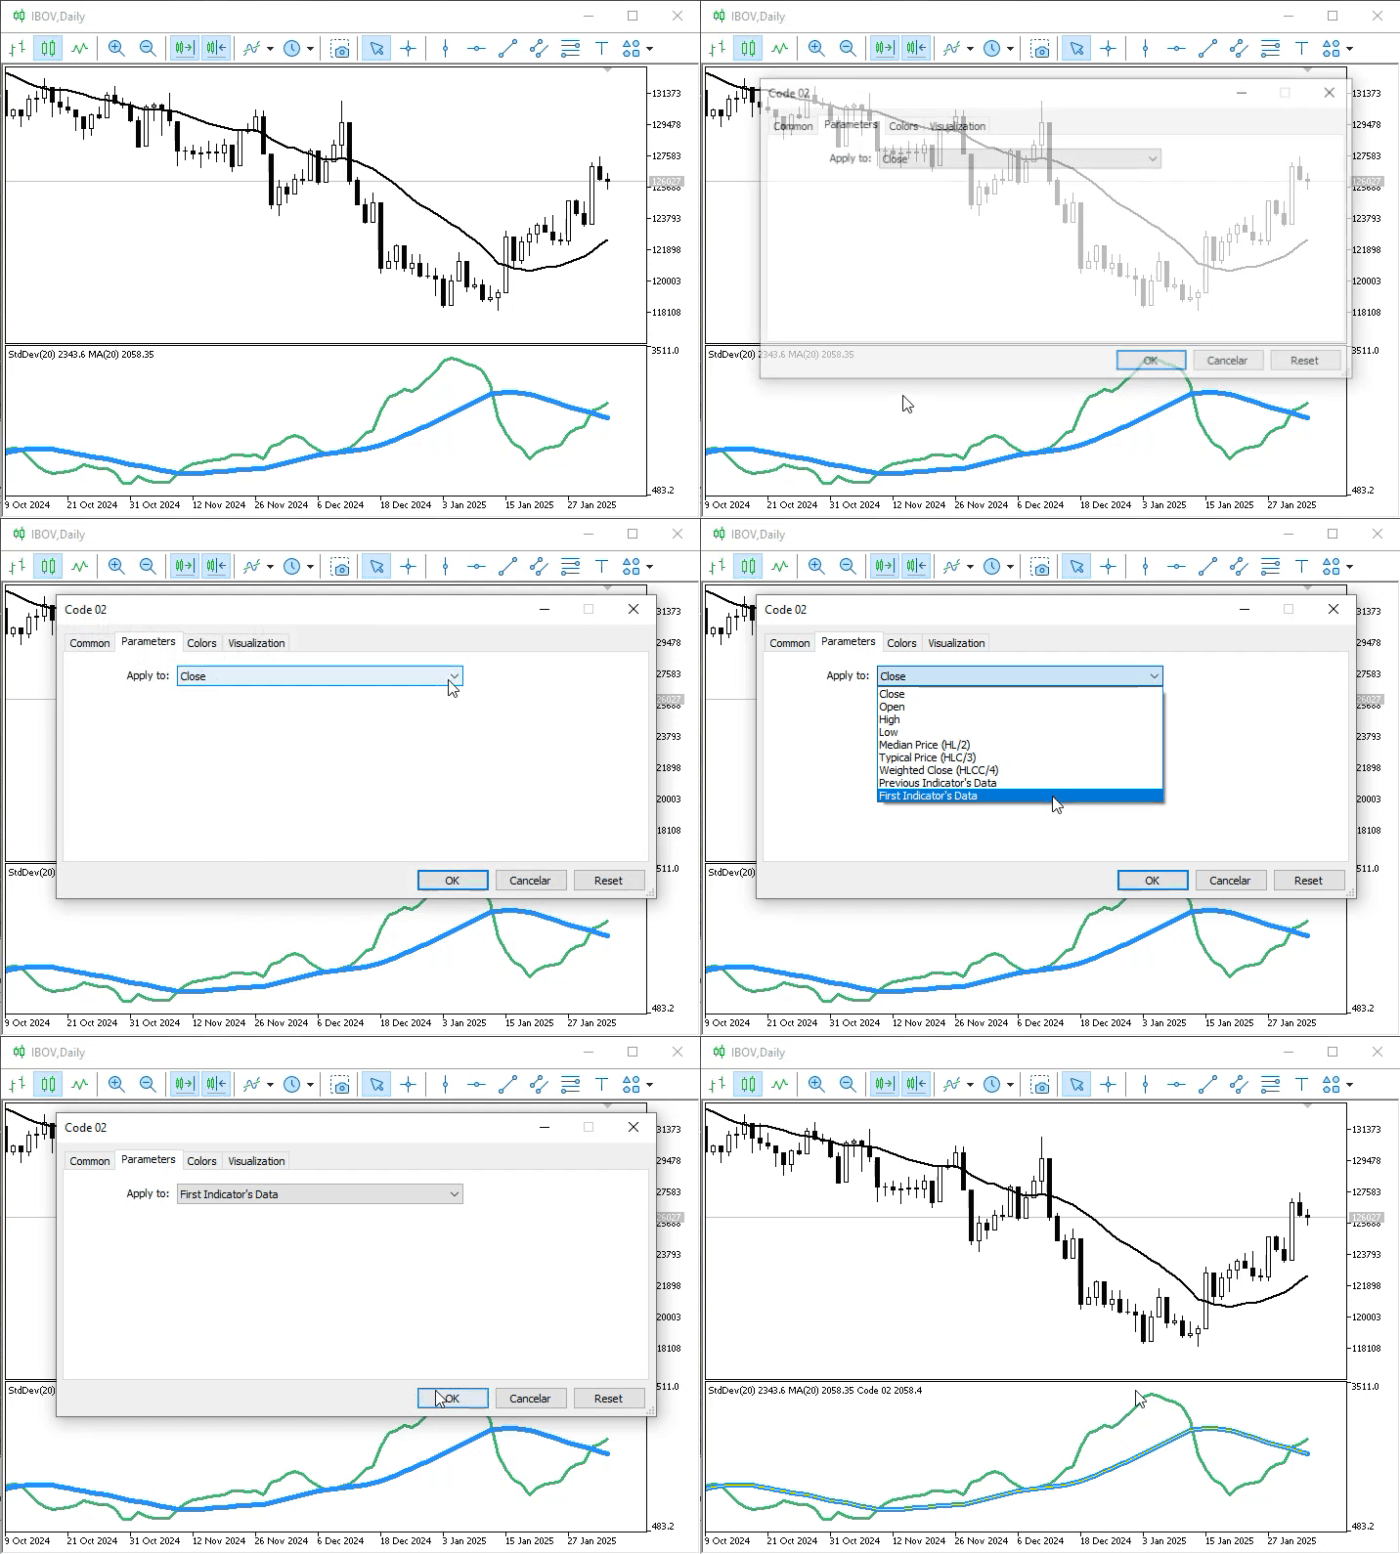
Animation 05
Note that I changed the color and thickness of the indicator line directly in code 02. Thus, after adding it, we can clearly see that the curve it plots matches the curve of the indicator shown in animation 04. This shows that it is already working correctly in the basic use case. Isn't it wonderful to see this and learn from it, dear reader? Without what you just learned, you wouldn't have been able to spot this error: almost no one mentions that you need to take the calculation direction into account when programming.
Perhaps this is because many people haven't tried to do what I'm showing you. That is precisely why they are unaware of these details and cannot explain the cause of such failures. When no one explains things to you, you may end up giving up and attributing the problem to the wrong cause. Many people blame the platform or even the MQL5 language, even though they don't actually understand what we just discussed.
Well, that was interesting and quite exciting. Now we'll use Code 02 to explain something we only briefly touched on in the previous article: how and why you should choose between FIRST INDICATOR'S DATA and PREVIOUS INDICATOR'S DATA. The following image shows these settings.
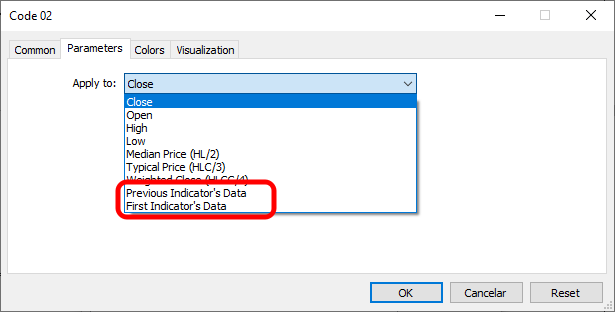
Image 07
To make this easier to understand, we'll need some additional information, which is shown in the following image.
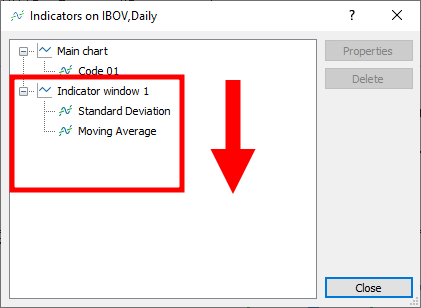
Image 08
If you add an indicator to a subwindow and want its calculations to use the pre-calculated values already present in that subwindow, you should take note of what is shown in Image 08.
The arrow in Image 08 indicates the order in which the indicators were added. There are special cases where this order is not displayed quite this way, but this is true in nearly all cases. In any case, the indicator at the top of the list is considered the first; the rest follow in order. To understand "FIRST INDICATOR'S DATA" and "PREVIOUS INDICATOR'S DATA," imagine that the indicators in Image 08 are organized as a queue of values from which you can select the data for the first or last element.
If you're not familiar with a queue of values, check out the article “From Basic to Intermediate: Queues, Lists, and Trees (II)” to understand what this is all about. Do you see how knowledge builds up over time? That's why it may seem like we're not moving forward, even though we're actually flying forward.
Once you realize that we're dealing with a queue, it will be easy to figure out which option to choose. Using FIRST INDICATOR'S DATA, we instruct MetaTrader 5 to use the data from the first indicator in the queue shown in Image 08. Using PREVIOUS INDICATOR'S DATA, we instruct MetaTrader 5 to use the data from the last indicator in this queue.
Hmm, that's really well thought out. But is it possible to bypass this system and choose for ourselves which indicator we want to use? Yes, dear reader, there are several ways to do this. Don't worry about that for now: we're just starting to learn what we can do with subwindows. Remember that we can also establish this connection between indicators on the main chart or in the main window. In this case, however, we will be limited to PREVIOUS INDICATOR'S DATA. Nevertheless, the results can be quite interesting, as the following animation shows.
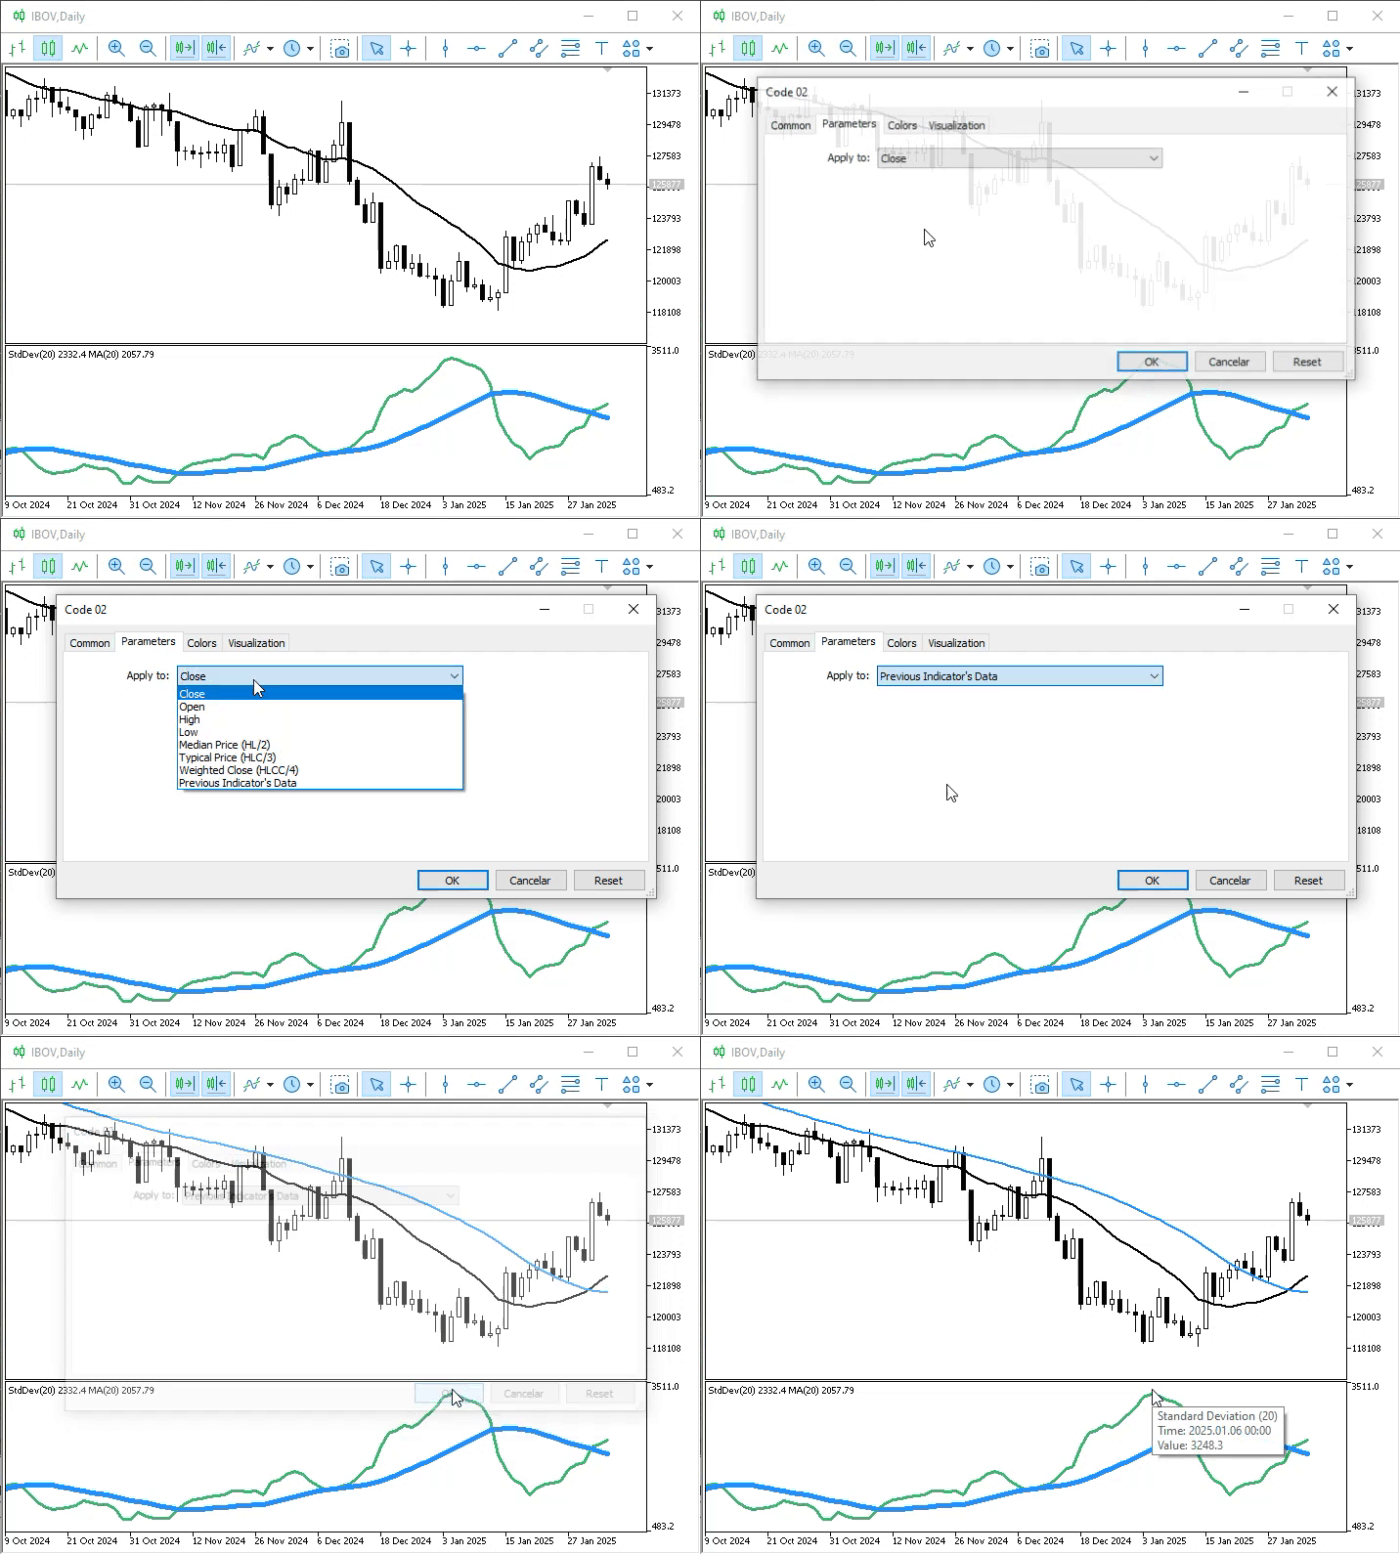
Animation 06
Indeed, this makes it possible to conduct research for a wide variety of purposes. But let's get back to subwindows. We've already seen in Animation 05 what happens when an indicator from Code 02 is added to a subwindow. Now let's see what happens if we select "PREVIOUS INDICATOR'S DATA" to understand how the queue forms with each new indicator. Remember that the initial queue is shown in Image 08. When we add the first new indicator, we get the result shown in the following animation.
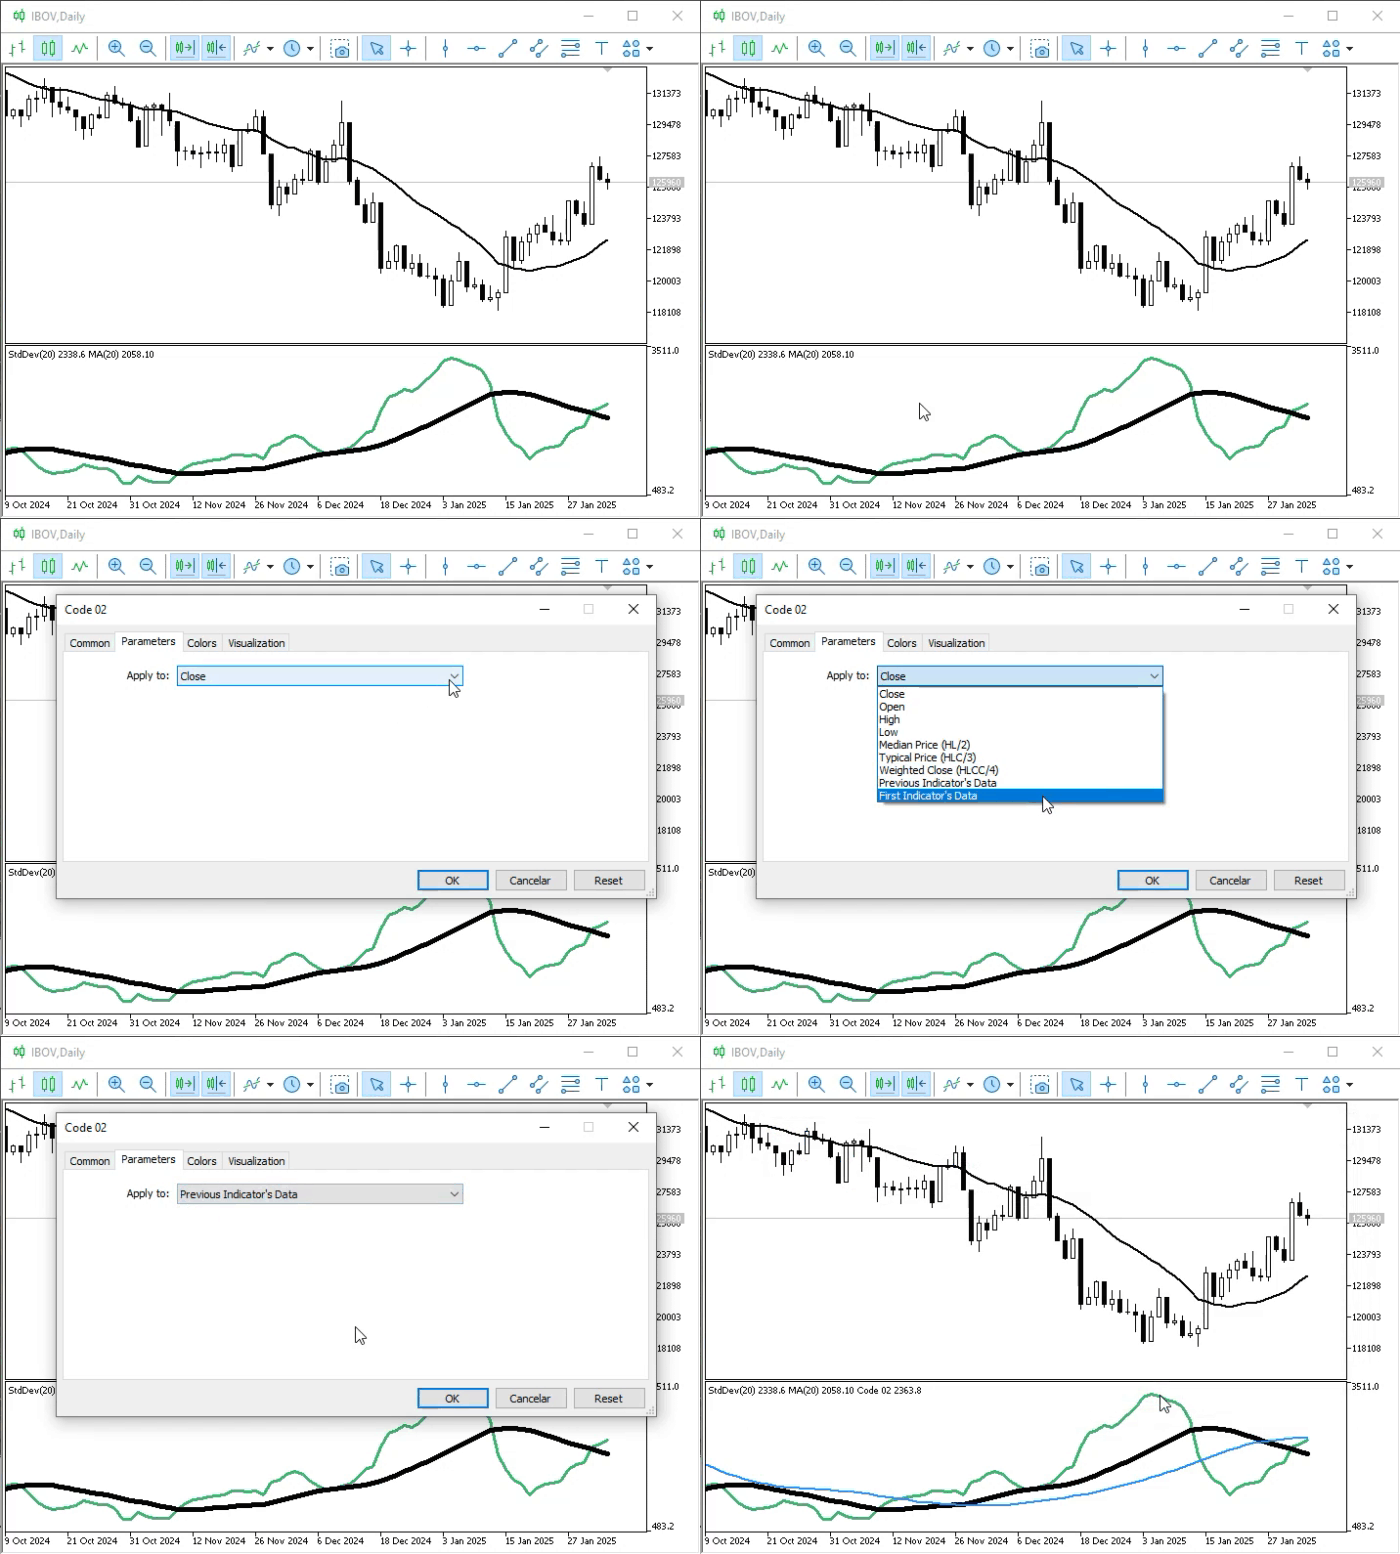
Animation 07
The resulting queue is shown in the following image.
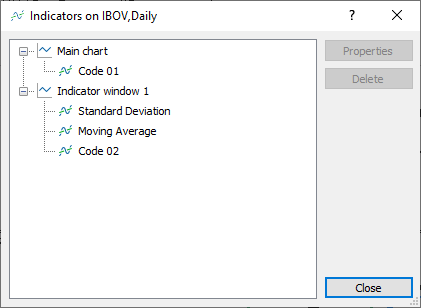
Image 09
Please note that Code 02 is now the last item in the queue. If we add one more indicator, we'll get the result shown in the following animation.
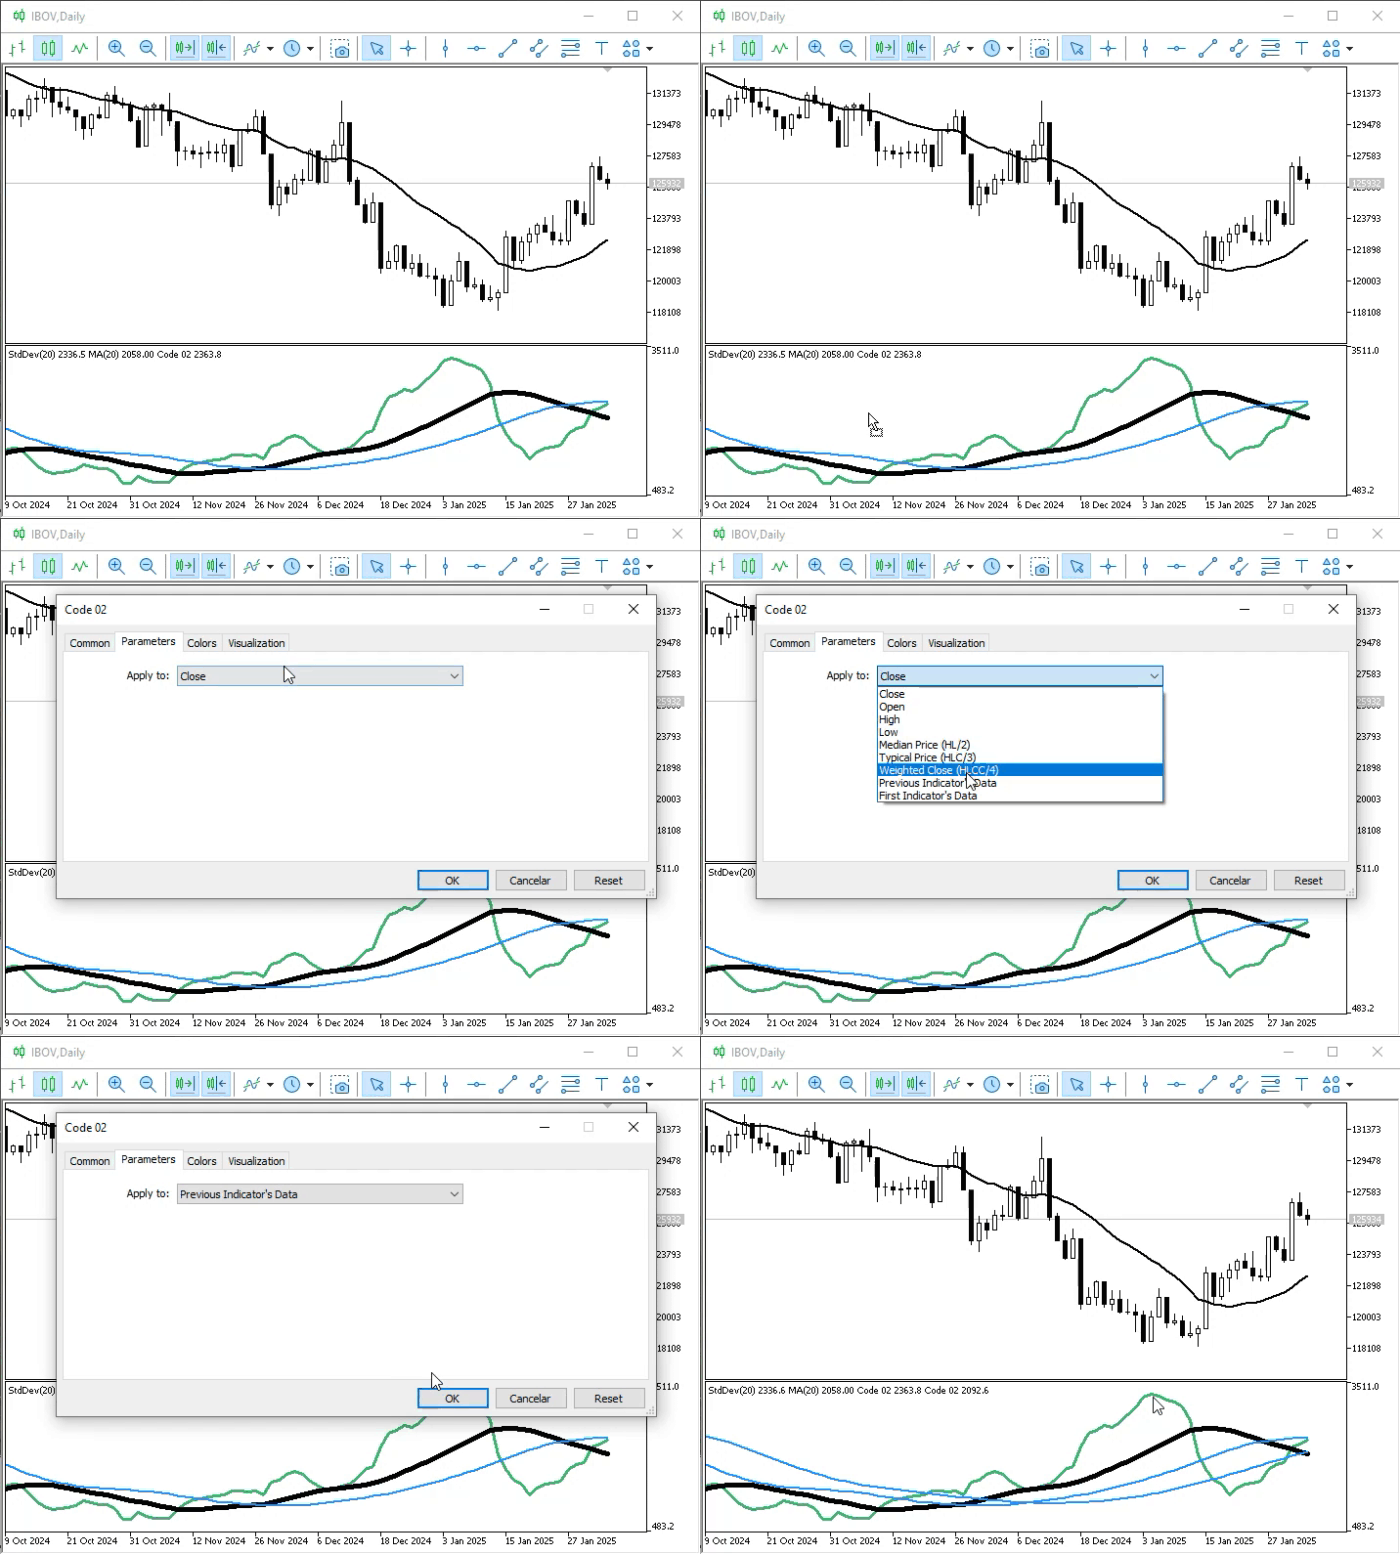
Animation 08
I think you can already guess where this is going. Every time we add an indicator that uses data from the immediately preceding indicator as the basis for its calculations, we smooth or amplify the signal—depending on exactly how that indicator performs its calculations. You can do a lot with this simple model. We don't need complex calculations, some kind of "magical" moving average, or a "magical" indicator that only a mathematical genius could come up with. Using a simple, quick, and straightforward calculation, you can obtain some very interesting results.
Okay, but what would happen if we removed the indicator that the others depend on? In Animation 08, for example, we have two interconnected Code 02 indicators, one of which depends on the other. If you remove the one on top, what will happen to the one below? Will it take the place of the one we just removed? That's an interesting question, dear reader, because the answer depends on how MetaTrader 5 handles such a situation. We can't tell it how to behave—or at least, I don't know of a way to do so. So we need to see what's happening in this particular case. The following animation will show us this.
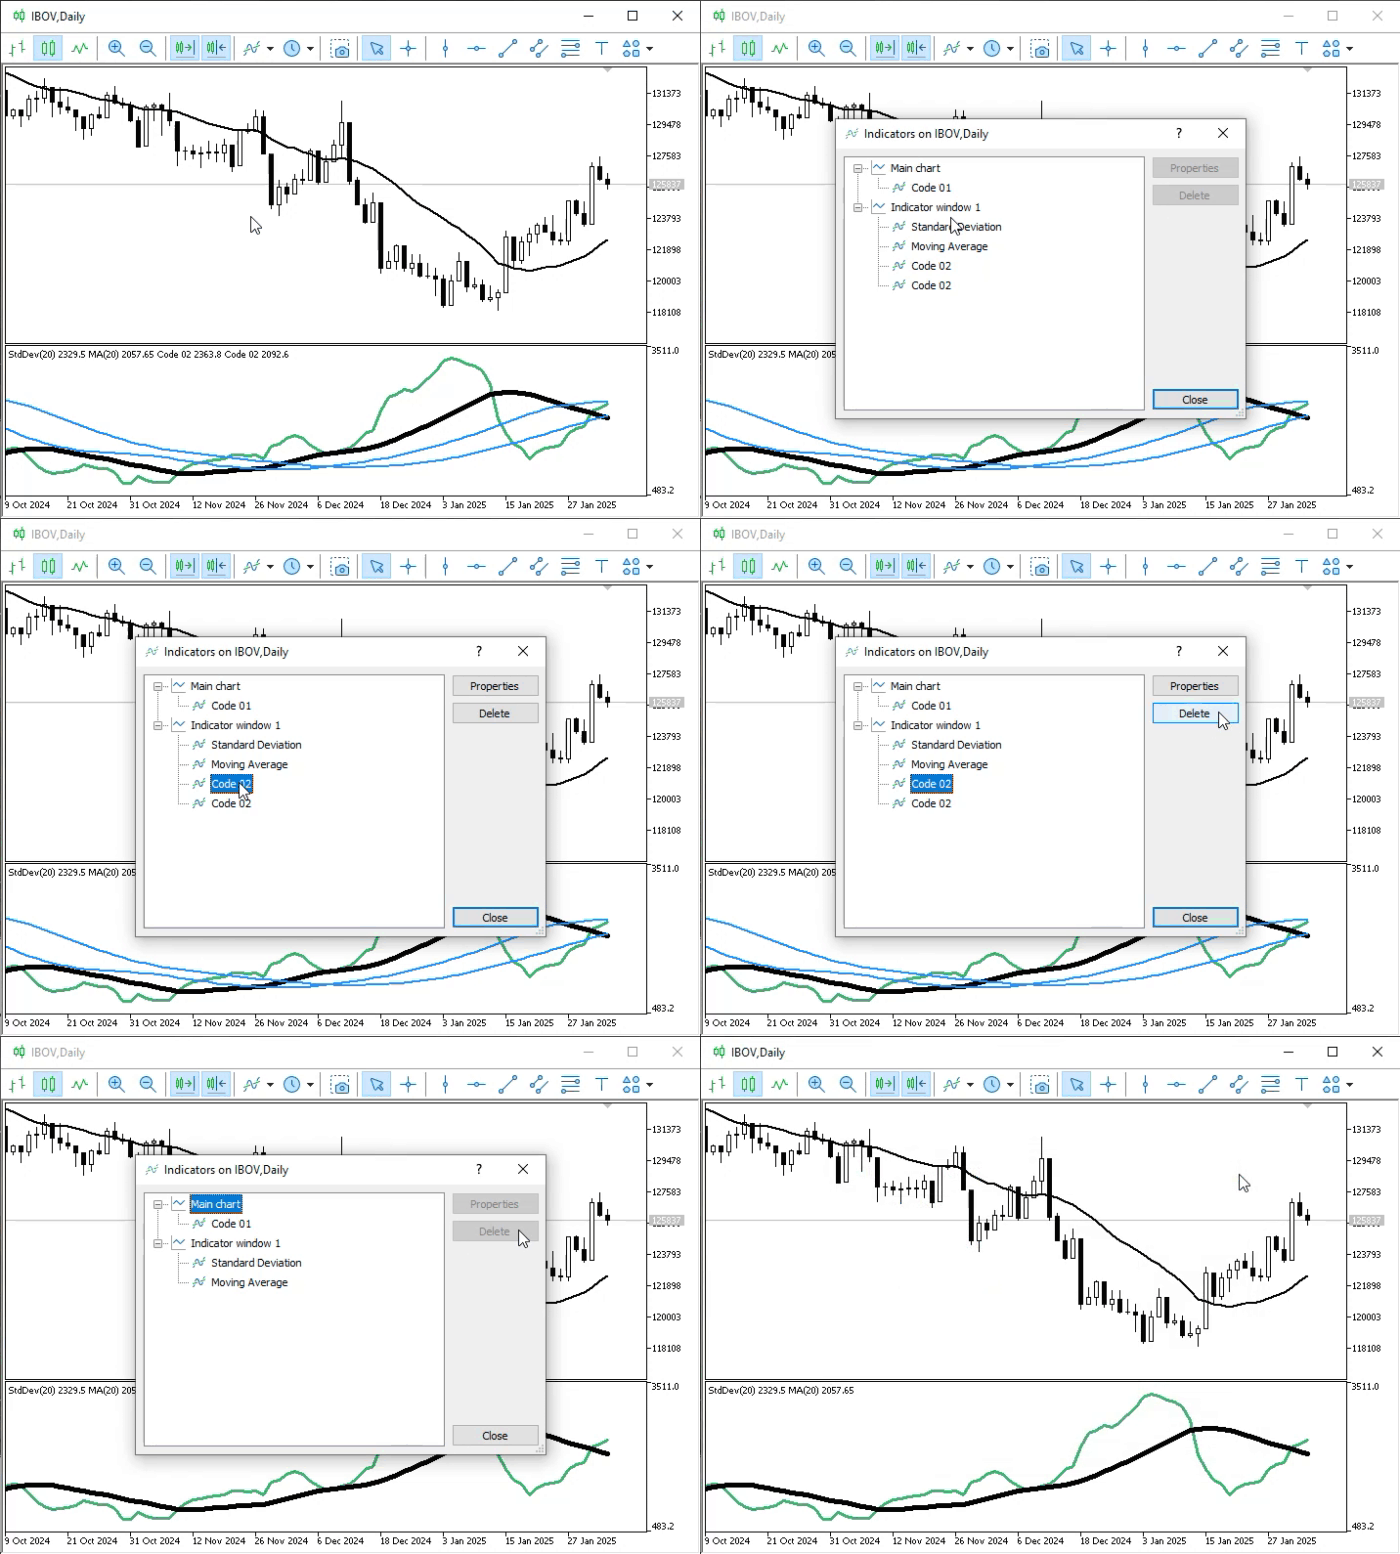
Animation 09
Note that, by default, MetaTrader 5 removes indicators that depend on the one we are removing. This is much more practical and easier than coming up with some complicated mechanism to keep the other indicators on the chart. Furthermore, it's a clean and elegant solution: it leaves no doubt as to what each indicator is calculating.
Let's now take a look at one last detail to wrap up this article. We will change just one line in Code 02, as shown in the following snippet.
                   .
                   .
                   .
11. }Averange[] =
12. {
13.     {20, MODE_SMA, clrDodgerBlue}
14. };
15. //+----------------+
16. #property indicator_separate_window
17. #property indicator_applied_price   PRICE_CLOSE
18. #property indicator_buffers         Averange.Size();
                   .
                   .
                   .
Snippet 01
The change is on line 16. Don't worry, dear reader: you'll find all the code listings in full in the attachment, so you can study them at your leisure. In practice, this modification produces a very interesting effect, although theoretically one might expect something completely different from what you are about to see.
When you set the property specified in line 16 for the indicator, you expect it to ALWAYS be placed in a new subwindow, right, dear reader? However, that is not always the case. This property will cause a subwindow to be created ONLY IF we add the indicator with the default data source setting. That is, without selecting either FIRST INDICATOR’S DATA or PREVIOUS INDICATOR’S DATA as the data source. If you select one of these options, MetaTrader 5 will ignore the property specified in line 16 and place the indicator in the subwindow to which we are adding it.
But wait a minute. Does this mean we can place the indicator on the main chart despite this property? NO, dear reader, in this case we cannot do that. MetaTrader 5 does not allow you to select "PREVIOUS INDICATOR’S DATA" in this specific situation. However, if you add an indicator to a subwindow that already contains another indicator, you can choose between FIRST INDICATOR’S DATA and PREVIOUS INDICATOR’S DATA. In this case, a new subwindow will not be created.
To make this clearer, let's take a look at a few animations that demonstrate this behavior.
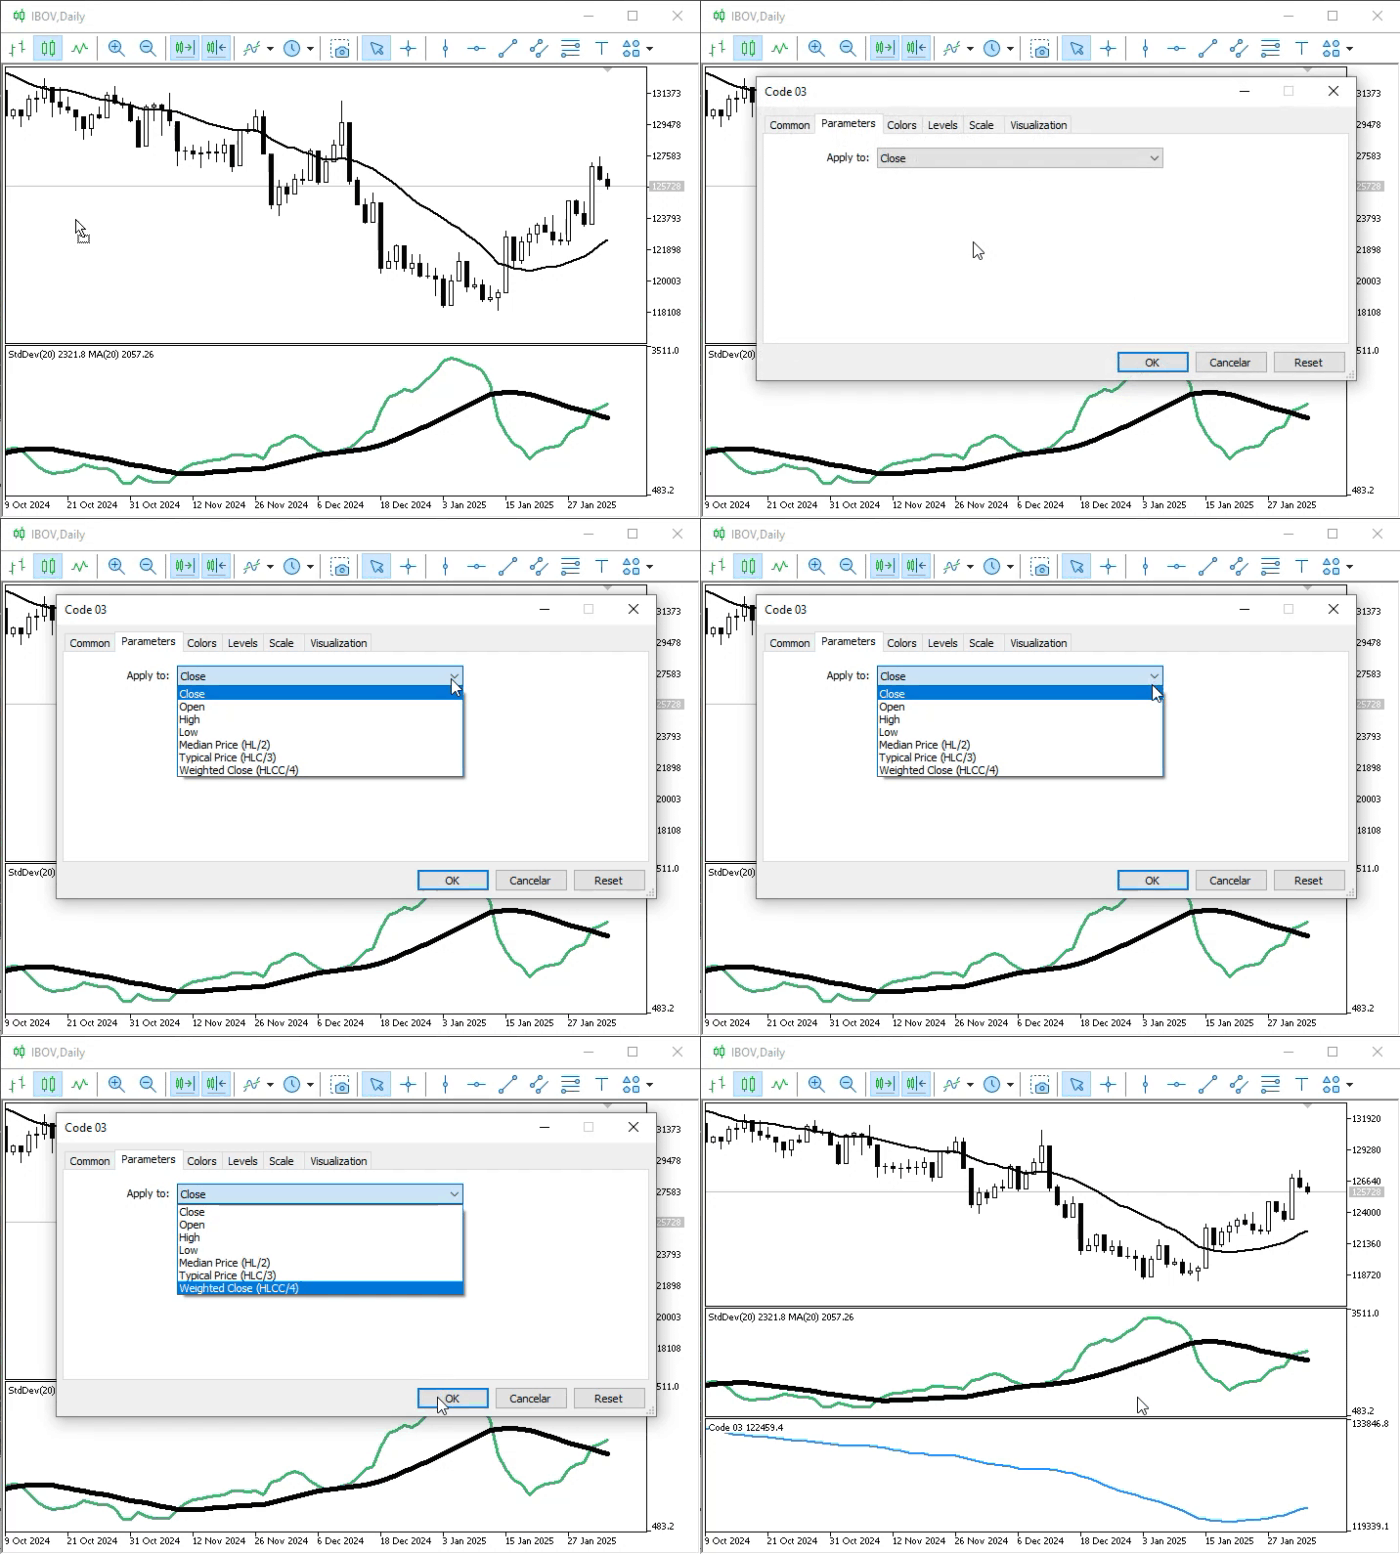
Animation 10
In Animation 10, we see what happens when we try to add an indicator configured to appear in a new subwindow to the main chart. Please note that there isn't much we can do about this.
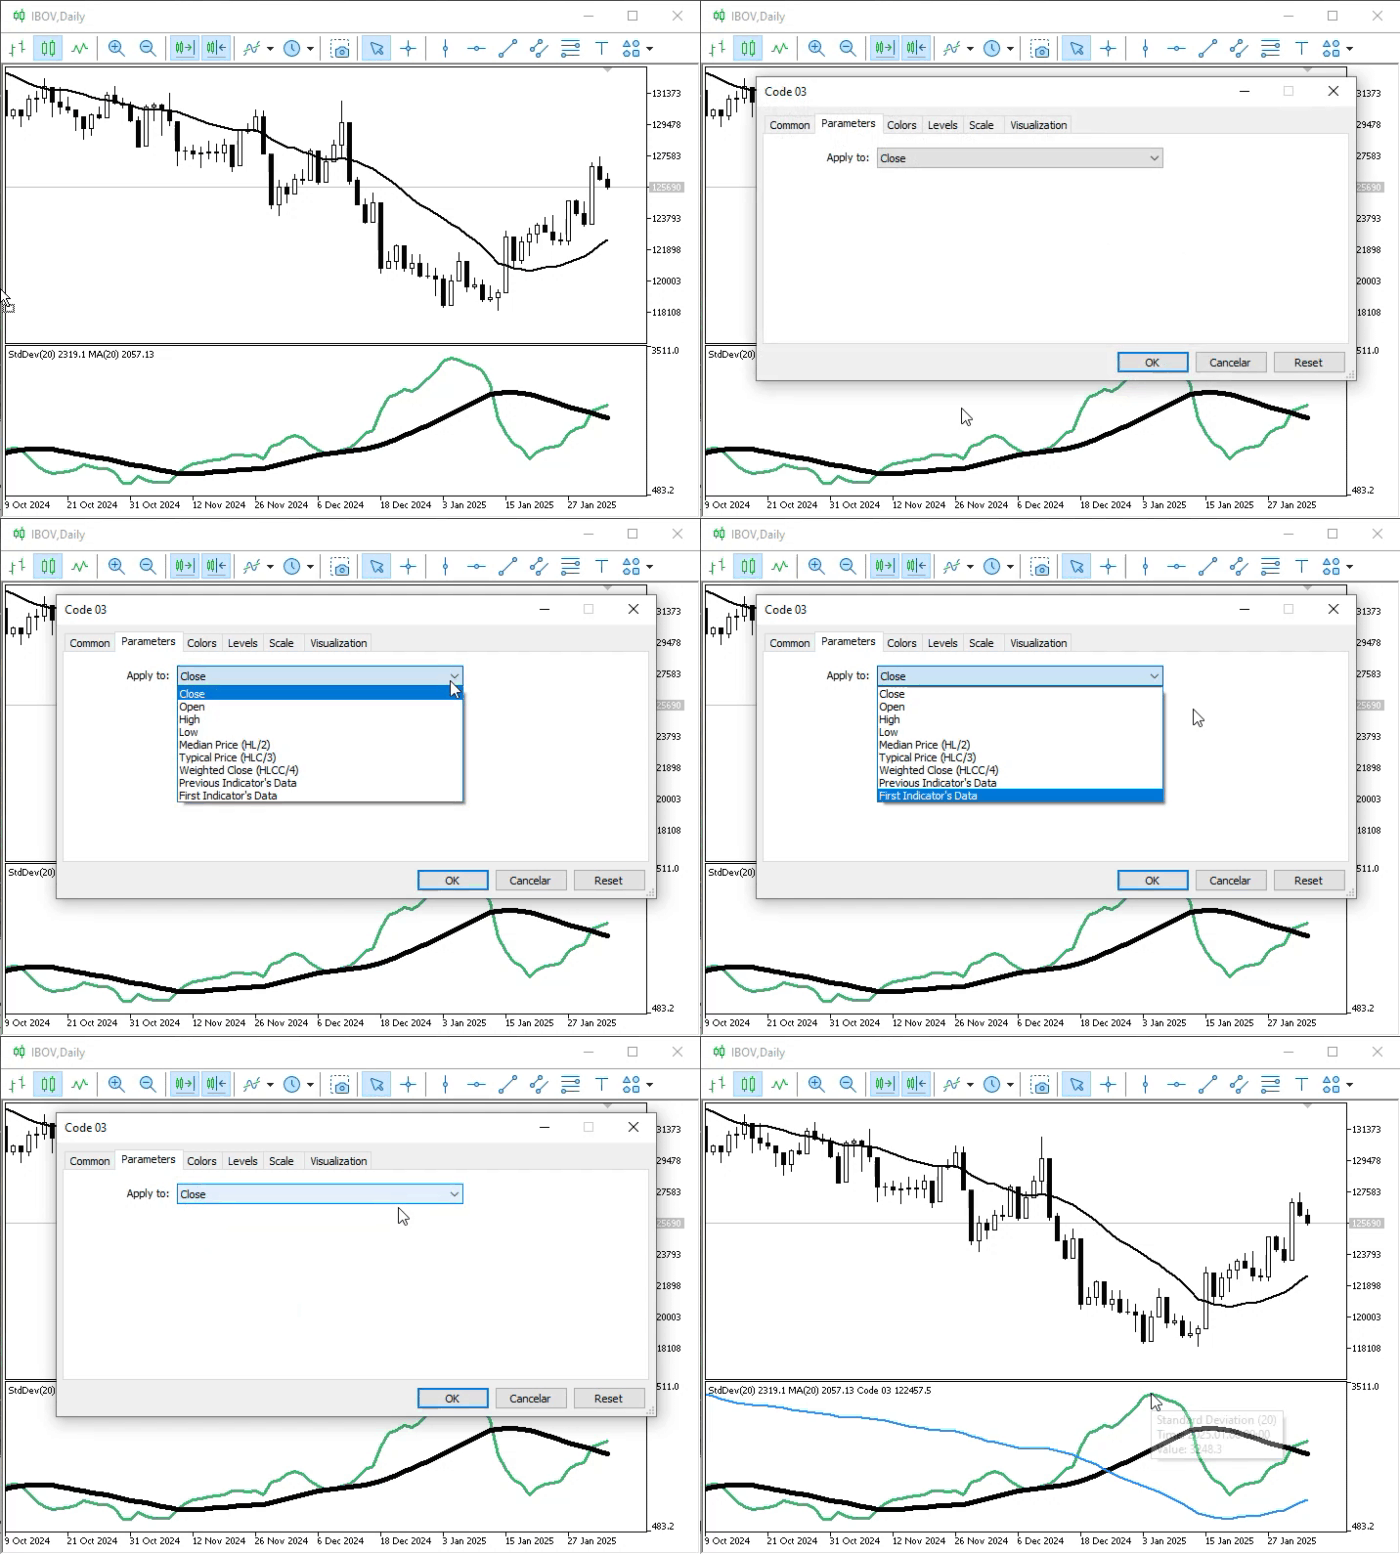
Animation 11
In Animation 11, we check what happens when we add an indicator to a subwindow, even though it is configured to be placed in a new subwindow. Please note that, unlike in Animation 10, we can now select options that were previously unavailable.
What interests us most is that exactly the same curve is plotted in Animation 11 as in Animation 10. Although the indicator's property specifies that it should occupy its own subwindow, MetaTrader 5 detects that we are already placing it in one of the subwindows. Therefore, it doesn't need to create another one.
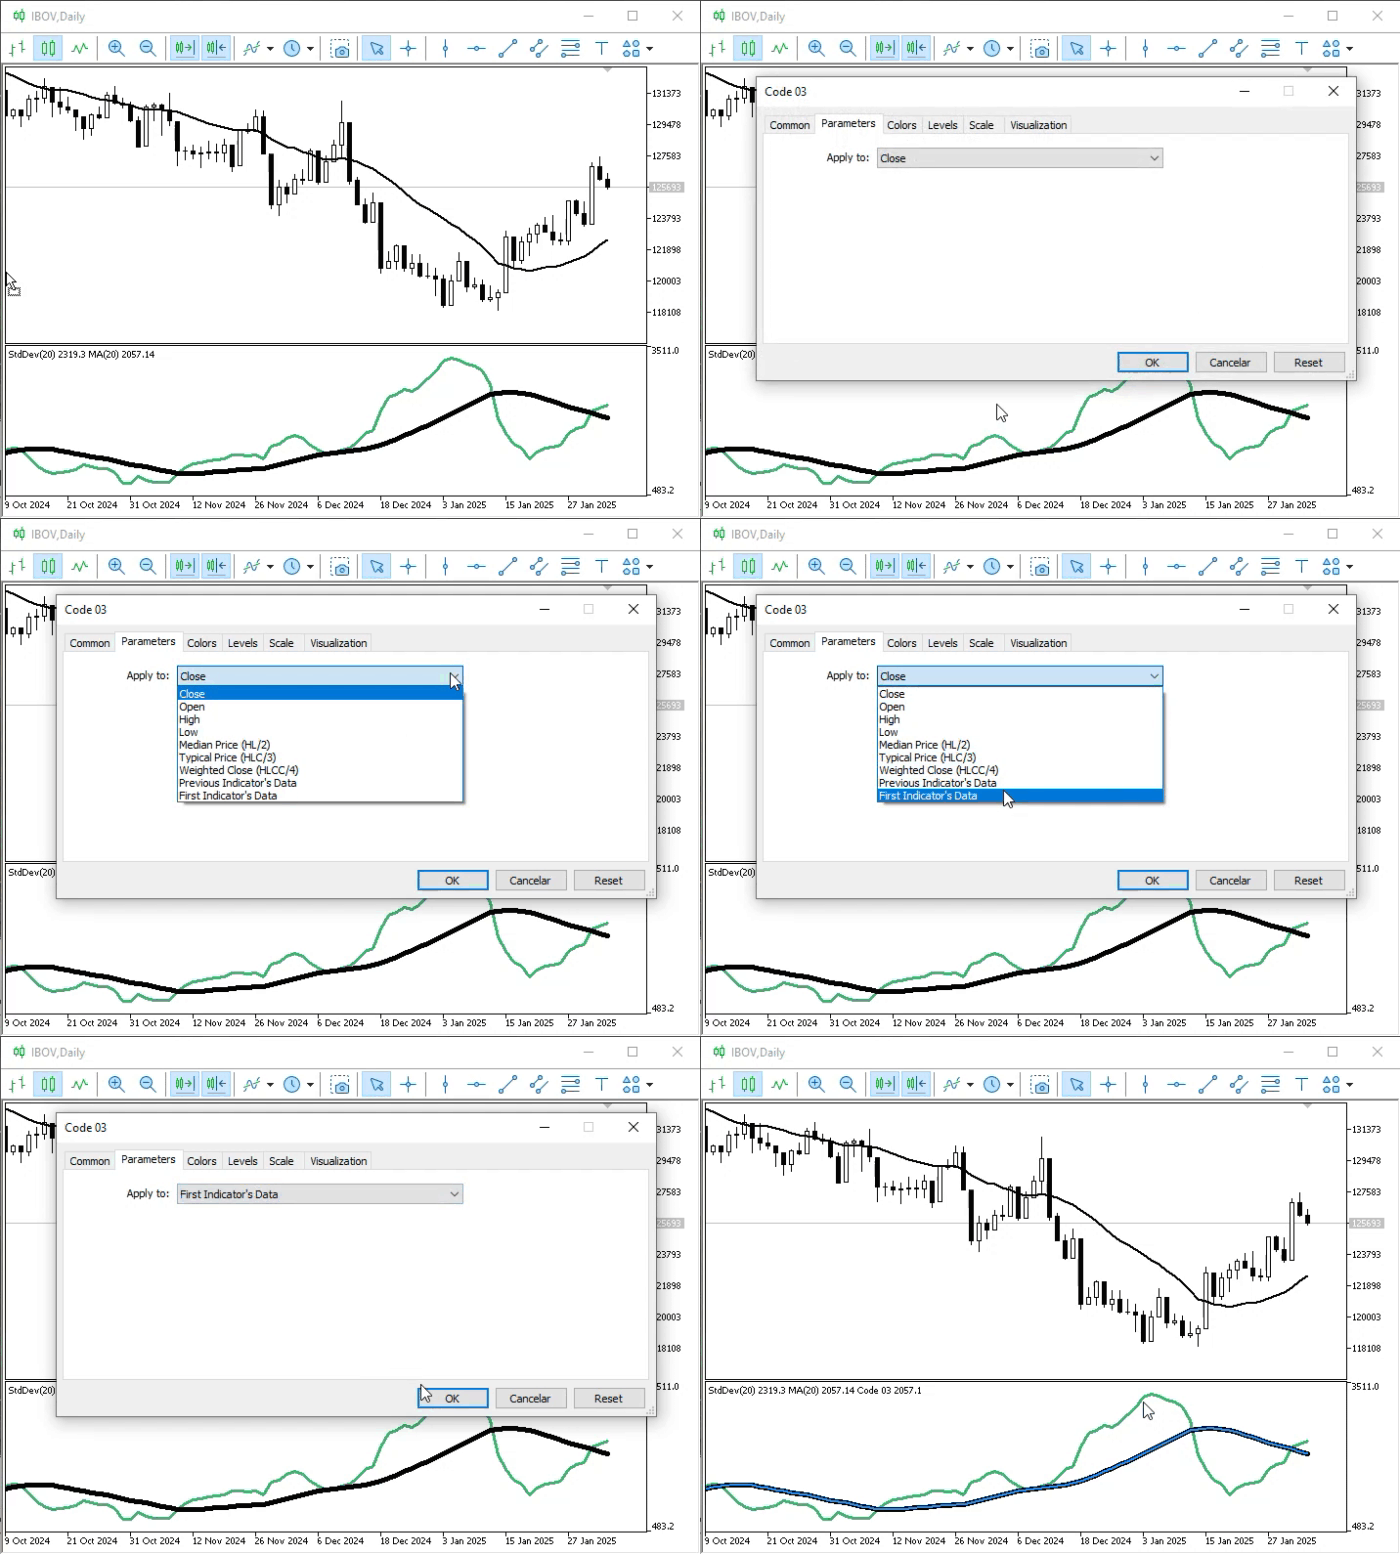
Animation 12
In Animation 12, we set the same indicator from Animations 10 and 11 to use the already calculated data available in the subwindow. The result is very similar to what we saw at the beginning of the article. This shows that an indicator may behave somewhat differently than its properties suggest if doing so allows MetaTrader 5 to manage the indicators in the subwindow correctly.
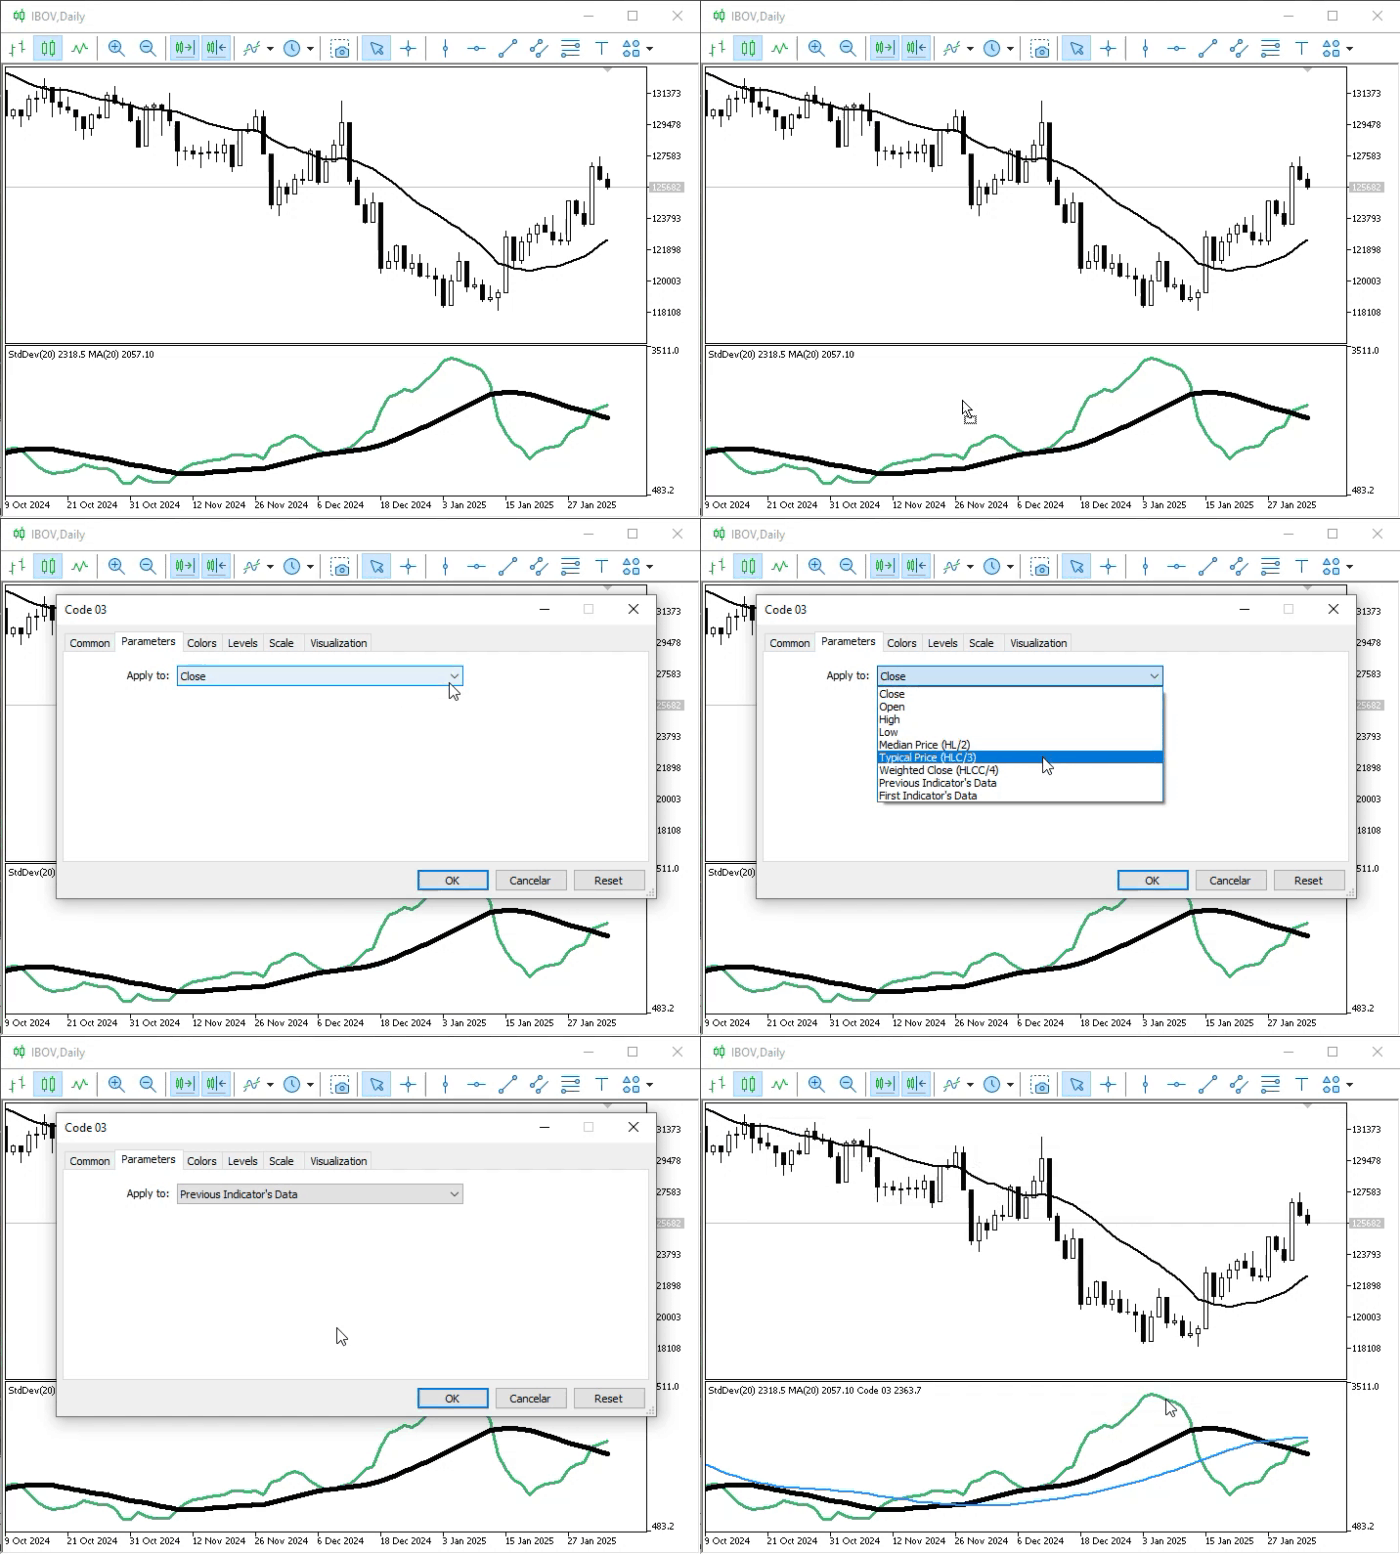
Animation 13
To wrap up this demonstration, let's take a look at Animation 13. As in Animation 12, MetaTrader 5 determines that it is best to leave the indicator in the subwindow to which we dragged it. This solution simplifies the management of all indicators on the chart. Thus, MetaTrader 5 knows how to remove them later while taking into account the dependencies between them.
Concluding Thoughts
In this article—which, by the way, turned out to be quite engaging and informative—I highlighted several features of using indicators in subwindows. Remember that we're just starting to learn about this and figure out how it all works in practice.
We also learned that we need to be careful when writing code. Depending on how we implement this, things might not work as expected and could produce completely incorrect results—or no results at all. In programming, you only truly learn when you experiment and study the details of each implementation. That's exactly how you can become a qualified professional.
In the accompanying files, you'll find the three main code examples from the article so you can try them out and see what happens in each situation. Understanding exactly where the code fails is far more important and instructive than simply watching it run flawlessly on the screen. So, dear reader, make the most of this opportunity and take your time to review what we've covered. This could prove to be very useful to you in the future.
| MQ5 File | Description |
|---|---|
| Indicators\\Code 01 | Basic Demonstration |
| Indicators\\Code 02 | Basic Demonstration |
| Indicators\\Code 03 | Basic Demonstration |
Translated from Portuguese by MetaQuotes Ltd.
Original article: https://www.mql5.com/pt/articles/17113
Warning: All rights to these materials are reserved by MetaQuotes Ltd. Copying or reprinting of these materials in whole or in part is prohibited.
This article was written by a user of the site and reflects their personal views. MetaQuotes Ltd is not responsible for the accuracy of the information presented, nor for any consequences resulting from the use of the solutions, strategies or recommendations described.

 Neural Networks in Trading: Recurrent Modeling of Market Micromovements (Encoder)
 Testing Random Walk vs Mean Reversion in MQL5: Implementing the Lo-MacKinlay Variance Ratio Test
 Markowitz Mean-Variance Optimization for MQL5: A Native Efficient-Frontier Portfolio Builder
 From Polling to Events: Building a Reactive MQL5 Trading System with Python and Redis Streams

- Free trading apps
- Over 8,000 signals for copying
- Economic news for exploring financial markets
You agree to website policy and terms of use