
Generative Adversarial Networks (GANs) for Synthetic Data in Financial Modeling (Part 2): Creating Synthetic Symbol for Testing

Introduction
In Financial Modeling, traders face a major challenge; a great deal of the time there is little data available. This constraint can hamper the creation and evaluation of trading techniques, particularly when crashes, high volatility or elongated market consolidation are not well represented in the data sets. For this reason, while using these strategies the data is rarely diverse or comprehensive enough to generalize the performance, especially in the environment of the real world. Moreover, the structure of the financial markets is influenced by various factors like geopolitical shifts and economic policy changes. Historical data is limited in capturing the different market variables, leaving traders reliable on algorithms with good backtest records but unable to adapt to new or unpredictable market consolidations.
To overcome all these challenges, the use of artificial data has now been considered the best solution. Synthetic data can replace or augment traditional historical data by providing a realistic and rich variety of market conditions, including asymmetrical ones. This helps to broaden and strengthen strategies for trading, as stress testing and the ability to generalize models are improved here.
In our Part 1 we have enhanced dataset diversity and model robustness now in this second part of our series, the topics of discussion are the actual GANs as a tool for creating synthetic data as applied to financial datasets. GANs are a cutting-edge machine learning approach to making accurate predictions, proficient in mapping out existing numerical records of financial history and synthesizing data that realistically replicates real market trends. This article demonstrates how to create synthetic symbols using advanced machine learning techniques like GANs (Generative Adversarial Networks) and verifies their similarity to real market dat through statistical method such as Shapiro-Wilk, Student's t-test, and Levene's. By ensuring data integrity, traders can confidently use synthetic data in their trading systems.
Understanding GANs in Financial Modeling
Generative Adversarial Networks (GANs) represent a significant advancement in machine learning, focusing on generating artificial data that closely resembles real datasets. Comprising two neural networks, the Generator and the Discriminator, GANs operate through a competitive learning dynamic. The Generator produces data indistinguishable from real data, while the Discriminator differentiates between real and synthetic data. This interplay leads to the continuous enhancement of both networks, yielding highly realistic synthetic data.
In financial modeling, GANs effectively address fundamental issues related to data scarcity. Historical financial data, particularly pertaining to markets, encounters accessibility challenges due to regulatory constraints, making it hard to obtain. Additionally, events like market crashes and sudden price spikes are infrequent in training datasets, which limits the generalization of certain strategies across various market conditions.
GANs excel at producing synthetic financial data that mirrors the characteristics of real data, thereby compensating for missing historical records. These synthetic datasets augment the information available to traders and researchers, facilitating the testing and refinement of algorithms. GANs can generate diverse data forms, such as price sequences or rare event occurrences, enabling traders to evaluate their algorithms under previously unseen scenarios.
Creating a synthetic financial model begins with employing a GAN to generate data that closely replicates real-world conditions. This intricate process requires several essential steps to ensure the generated data's fidelity, thereby enhancing the modeling efforts and strategies within the financial domain.
To initiate the process of training a Generative Adversarial Network (GAN) for financial data prediction, historical exchange rate data, such as EURUSD, must first be gathered. This data serves as essential training material for the GAN system. The raw financial data undergoes a cleaning process to ensure consistent values, which involves normalization and the removal of any missing data points. The cleaned data is then normalized to a range between -1 and 1 through appropriate scaling to enhance the effectiveness of the GAN. Additionally, the processing of this time series data should yield derived features capable of identifying significant patterns relevant for prediction.
Following the data acquisition, the GAN architecture is designed, where the generator network synthesizes data from random noise inputs. A random vector, or latent space, serves as the input to this network, aiming to replicate the patterns found in the actual data. The generative model iteratively adjusts its output based on feedback from the discriminator, which evaluates the authenticity of the generated data compared to real data. This ongoing training involves a competitive interaction between the two components, where the generator seeks to improve its data simulations, while the discriminator enhances its ability to distinguish between real and synthetic data.
The training process consists of running multiple epochs for simultaneous optimization of both networks, requiring careful tuning of learning rates to ensure convergence. The generator aims to minimize loss by tricking the discriminator, while the discriminator works to maximize its accuracy in differentiating between real and fake data, guided by two distinct loss functions throughout the training.
Synthetic symbols play a crucial role for traders by enhancing past data for better modeling tools. They simulate realistic market behavior, providing diverse datasets for testing trading strategies under various market conditions, including significant drops and volatility. This reduces overfitting in machine learning models by preventing reliance on singular historical trends. Furthermore, synthetic data enables the exploration of hypothetical scenarios, allowing traders to predict unexpected market shifts. Ultimately, traders can develop and refine their trading strategies effectively using this system.
Generating Synthetic Data in MQL5
Synthetic data creation in MQL5 involves a structured process that combines machine learning with the platform's features. Using GANs technology we generate realistic financial data that matches real trading patterns. Below is the step-by-step guide.
We begin by exporting the synthetic data created by the GAN to meet MetaTrader 5 requirements. The GAN model creates synthetic market data which MetaTrader 5 can read from a standard CSV file that includes basic price information. Prepare your CSV structure to match MetaTrader system standards so you can easily connect it to the platform.
To utilize synthetic data in trading, it must be imported into MetaTrader 5 as a custom symbol. Select the Symbols tab in MetaTrader 5 and establish a new symbol. Give it an appropriate title such as "SYNTH_EURUSD". The MQL5 CustomRatesUpdate function feeds CSV data into our synthetic symbol. Our system tool uploads synthetic time series information into the trading platform for use. Check your new synthetic symbol in the market watch to make sure its data matches the structure you created.
Using these processes traders can integrate customized synthetic data into their MetaTrader 5 platform for strategy development under real-world market scenarios.
Below is a that code demonstrates how to import synthetic EURUSD data from a CSV file into MetaTrader 5. It creates a synthetic symbol, configures its properties, and updates it with historical data from the CSV file.
#define SYNTHETIC_CSV_FILE_NAME "EURUSD_3_years_synthetic.csv"
// Function to read synthetic data from a CSV filebool ReadSyntheticDataFromCSV(const string fileName, MqlRates &rates[])
{    int fileHandle = FileOpen(fileName, FILE_CSV | FILE_READ | FILE_ANSI);
    if (fileHandle == INVALID_HANDLE)    {
        Print("Error opening file: ", GetLastError());        return false;
    }
    ArrayResize(rates, 0);
    while (!FileIsEnding(fileHandle))    {
        string line = FileReadString(fileHandle);        StringReplace(line, ",", ".");
        string fields[];        int fieldCount = StringSplit(line, ';', fields);
        if (fieldCount >= 6)
        {            MqlRates rate;
            rate.time = (datetime)StringToTime(fields[0]);            rate.open = StringToDouble(fields[1]);
            rate.high = StringToDouble(fields[2]);            rate.low = StringToDouble(fields[3]);
            rate.close = StringToDouble(fields[4]);            rate.tick_volume = (long)StringToInteger(fields[5]);
            rate.spread = 0;            rate.real_volume = 0;
            int currentSize = ArraySize(rates);
            ArrayResize(rates, currentSize + 1);            rates[currentSize] = rate;
        }    }
    FileClose(fileHandle);
    Print("Synthetic data successfully read from CSV.");    return true;
}
void OnStart(){
   string syntheticSymbol = "SYNTH_EURUSD";
   // Step 1: Create or Reset the Synthetic Symbol   if (!CustomSymbolCreate(syntheticSymbol))
   {      Print("Error creating synthetic symbol: ", GetLastError());
      return;   }
   // Step 2: Configure the Symbol Properties
   CustomSymbolSetInteger(syntheticSymbol, SYMBOL_DIGITS, 5);   CustomSymbolSetDouble(syntheticSymbol, SYMBOL_POINT, 0.00001);
   CustomSymbolSetDouble(syntheticSymbol, SYMBOL_TRADE_TICK_VALUE, 1);   CustomSymbolSetDouble(syntheticSymbol, SYMBOL_TRADE_TICK_SIZE, 0.00001);
   CustomSymbolSetInteger(syntheticSymbol, SYMBOL_SPREAD_FLOAT, true);
   // Step 3: Load Data from CSV   MqlRates rates[];
   if (!ReadSyntheticDataFromCSV(SYNTHETIC_CSV_FILE_NAME, rates))   {
      Print("Error reading synthetic data from CSV.");      return;
   }
   // Step 4: Update Rates and Add to Market Watch   if (!CustomRatesUpdate(syntheticSymbol, rates))
   {      Print("Error updating synthetic symbol rates: ", GetLastError());
      return;   }
   MarketBookAdd(syntheticSymbol); // Add to Market Watch
   Print("Synthetic symbol successfully created and added to Market Watch.");}
- Add this script to the MetaEditor and compile it.
- Run the script on the real EURUSD from the Navigator panel in MetaTrader 5.
- Verify that the synthetic symbol appears in the Market Watch window with the imported data.
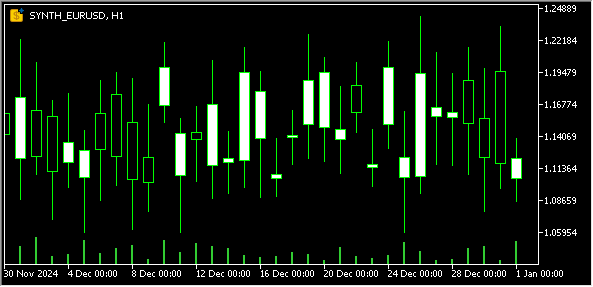
Below is the chart window of our synthetic symbol "SYNTH_EURUSD":
The synthetic symbol needs verification against real market data once it has been built. The analysis uses statistical tests to check if the two sets of data stay true to their basic patterns. Our tests verify that simulated data behaves like actual market data which keeps trading platforms reliable. Below are the statistical methods applied:
Shapiro-Wilk Test
This test examines if a set of data fits into a normal statistical pattern. Through statistical tests, traders verify that synthetic data matches the overall price movement patterns of genuine trading markets. Realistic data modeling works when these data sets match well.
- Hypotheses:
- H₀ (Null Hypothesis): The data is normally distributed.
- H₁ (Alternative Hypothesis): The data is not normally distributed.
Interpretation:
- If p > 0.05 , the data is likely normally distributed (H₀ is accepted).
- If p ≤ 0.05 , the data does not follow a normal distribution (H₀ is rejected).
Example from the article:
Historical EURUSD data and synthetic EURUSD data are aligned to the same timeframes. The Shapiro–Wilk test is applied to both datasets to compare their distributions.
Results:
- Synthetic data: W = 0.998 , p = 0.432
- Real data: W = 0.997 , p = 0.398
Both datasets have p > 0.05 , indicating that they follow a normal distribution.
Here is the Python code for performing the Shapiro–Wilk test on your datasets using the scipy.stats library:
import pandas as pd
from scipy.stats import shapiro

# Load synthetic and real datasets
synthetic_data = pd.read_csv('EURUSD_3_years_synthetic(1).csv')
real_data = pd.read_csv('EURUSD_CSV(1).csv')

# Select the 'close' column for the test
synthetic_close = synthetic_data['close']
real_close = real_data['close']

# Perform Shapiro-Wilk test
synthetic_stat, synthetic_p = shapiro(synthetic_close)
real_stat, real_p = shapiro(real_close)

# Print results
print("Shapiro–Wilk Test Results:")
print(f"Synthetic Data W-statistic: {synthetic_stat:.4f}, P-value: {synthetic_p:.4f}")
print(f"Real Data W-statistic: {real_stat:.4f}, P-value: {real_p:.4f}")

# Interpretation
if synthetic_p > 0.05:
    print("Synthetic data follows a normal distribution.")
else:
    print("Synthetic data does not follow a normal distribution.")

if real_p > 0.05:
    print("Real data follows a normal distribution.")
else:
    print("Real data does not follow a normal distribution.")
Student's t-Test
The t-test helps us see if two datasets hold identical average measurements statistically speaking. Our financial models need to show that the price behavior from synthetic data matches real-world market patterns. The analysis helps verify how prices normally move up and down in a typical market.
- Hypotheses:
- H₀: The mean values are equal.
- H₁: The mean values are not equal.
Interpretation:
- If p > 0.05 , there is no significant difference between the means (H₀ is accepted).
- If p ≤ 0.05 , the means are significantly different (H₀ is rejected).
Example from the article:
Synthetic and real EURUSD data from the same timeframe are compared using an independent two-sample t-test to assess if their mean values differ.
Results :
- T = 0.534 , p = 0.594
Since p > 0.05 , there is no significant difference between the mean values of the two datasets.
Here’s the Python code for performing a Student's t-test to compare the means of the "close" column in the synthetic and real datasets:
import pandas as pd
from scipy.stats import ttest_ind

# Load synthetic and real datasets
synthetic_data = pd.read_csv('EURUSD_3_years_synthetic(1).csv')
real_data = pd.read_csv('EURUSD_CSV(1).csv')

# Select the 'close' column for the test
synthetic_close = synthetic_data['close']
real_close = real_data['close']

# Perform Student's t-test
t_stat, p_value = ttest_ind(synthetic_close, real_close, equal_var=False)  # Use equal_var=False if variances are unequal

# Print results
print("Student's T-Test Results:")
print(f"T-statistic: {t_stat:.4f}, P-value: {p_value:.4f}")

# Interpretation
if p_value > 0.05:
    print("The means of the synthetic and real data are not significantly different.")
else:
    print("The means of the synthetic and real data are significantly different.")
Levene's Test
This test compares the stability of data variance between both test sets. The level of price fluctuation shows up as a variance in trading data. The validation proves that the synthetic data shows similar price volatility patterns which means it can accurately represent market behavior.
- Hypotheses:
- H₀: The variances are equal.
- H₁: The variances are not equal.
Interpretation:
- If p > 0.05 , the variances are statistically similar (H₀ is accepted).
- If p ≤ 0.05 , the variances are significantly different (H₀ is rejected).
Example from the article:
The variances of real and synthetic EURUSD data are compared to evaluate their volatility patterns.
Results :
- W = 0.8742 , p = 0.3517
Since p > 0.05 , there is no significant difference between the variances of the datasets.
Here’s the Python code for performing Levene's Test to compare the variances of the "close" column in the synthetic and real datasets:
import pandas as pd
from scipy.stats import levene

# Load synthetic and real datasets
synthetic_data = pd.read_csv('EURUSD_3_years_synthetic(1).csv')
real_data = pd.read_csv('EURUSD_CSV(1).csv')

# Select the 'close' column for the test
synthetic_close = synthetic_data['close']
real_close = real_data['close']

# Perform Levene's test
stat, p_value = levene(synthetic_close, real_close)

# Print results
print("Levene's Test Results:")
print(f"Statistic: {stat:.4f}, P-value: {p_value:.4f}")

# Interpretation
if p_value > 0.05:
    print("The variances of the synthetic and real data are not significantly different.")
else:
    print("The variances of the synthetic and real data are significantly different.")
Conclusion
The article discusses how synthesized data improves financial analysis by addressing issues like limited archival data, non-representative samples, and insufficient stress testing.
By using MQL5 tools and Generative Adversarial Networks (GANs), traders can create genuine synthetic datasets that simulate various market conditions. This combination produces a framework for generating synthetic symbols, with validation techniques like Shapiro-Wilk and Student’s t-test ensuring statistical similarity to real market data.
Synthetic symbols facilitate robust testing, reduce optimization errors, and enhance resilience to market changes, enabling traders to refine their strategies confidently. Ultimately, this approach advances trading algorithms and decision-making, fostering adaptable financial systems capable of responding to a dynamic market landscape.
Warning: All rights to these materials are reserved by MetaQuotes Ltd. Copying or reprinting of these materials in whole or in part is prohibited.
This article was written by a user of the site and reflects their personal views. MetaQuotes Ltd is not responsible for the accuracy of the information presented, nor for any consequences resulting from the use of the solutions, strategies or recommendations described.

- Free trading apps
- Over 8,000 signals for copying
- Economic news for exploring financial markets
You agree to website policy and terms of use