
From Basic to Intermediate: Objects (I)

Introduction
In the previous article, “From Beginner to Intermediate: Indicator (V)” we explained how we can, in a simple way, adapt an indicator, even if only partially, to the chart display mode used in MetaTrader 5. However, we did not show how to use the three chart modes, because doing so requires knowledge that we have not yet properly explained here.
Within certain limits, we can use candlestick mode or bar mode in the same indicator, and this can be done without any major problems. If we want to use line mode, we will have to create a separate indicator and place it on the chart manually. Despite this minor drawback, we will show how to avoid it in the future.
I believe you were able to understand how we can temporarily deal with the existing limitations until we reach the necessary level in these articles, so that you understand how to work without having to explain every implementation detail.
Even so, there are things we can already start discussing, although they may be more interesting to some readers and less interesting to others. I say this because many of you may not see the deeper meaning of the topic we will begin discussing in today’s article. For others, however, what will be shown and explained in this and the following articles is genuinely very interesting and may even have a genuinely worthwhile purpose.
So, let us begin by looking at something that will not be examined in detail in this article, but will serve as the starting point for discussing this topic.
Special Precaution
There are several types of data that many traders like to see on a chart. Some of them are more or less useful depending on the specific moment. One of these is a candle or bar counter. For many people, such things are of absolutely no use, while for others they are a quick and efficient means of communicating with other traders in order to exchange opinions about how they assess the market.
All right, the above refers to what we place on the chart from the user’s point of view. But from a programmer’s perspective, the situation is somewhat different.
This is because we can create various attractive ways to display information on the chart. However, in this modest example, there are not many different ways to do it, since the main goal is simply to place text on the image, and nothing more. The real difference will lie not in the text itself, but in how we place it in a table and update it periodically.
Many people who program as a hobby lack the clear vision found in programmers who are truly dedicated to their craft and study the subject. And please do not misunderstand me: I am not saying that someone who creates programs for specific purposes from time to time does not know what they are doing. The problem is that such people are not always aware of certain types of problems that can arise from poorly optimized programs when working with the MetaTrader 5 platform, causing gradual and progressive performance degradation to the point where the platform becomes completely unusable because of all those applications running on the chart.
A simple candle counter intended only to display text on a chart can consume far more resources than necessary if it is not well optimized. Even here, where the main goal will always be educational, we try to show code that will not have a significant negative impact on MetaTrader 5 performance. And if this could accidentally happen, I remind you to be careful so that people who put into practice what is described in the articles can avoid unnecessary headaches.
Dear readers, let us now return to our question: what could we devise as a candle counter? One might think of some application that displays numerical values on a scale. But the question remains open. What application would you use? Since we have already seen how to create scripts and indicators, you will most likely end up somewhere between these two cases. However, because of some script limitations, we will ultimately have to move to indicators.
And what exactly are the limitations of scripts? If you have already experimented, you have surely noticed that whenever we add a script to a chart, it is removed when the chart timeframe changes. This happens even if we use a loop in the script to prevent it. So, this would require us to take measures to reposition the script on the chart whenever the timeframe changes. There is a way to avoid the problems associated with running scripts. However, since it involves using services, and their connection with the chart is quite complex, that option is not suitable for us.
If you are interested in how complex such a connection structure is, look for my articles about creating a replication/modeling system. But since those articles are aimed at people who already have good basic knowledge of MQL5 programming—which is not the case for this topic at the moment, since we are only just beginning—I will not go into detail about manipulating the chart through services for this purpose.
Thus, the remaining alternative is to use indicators. Correct, but nevertheless, indicators are not suitable for certain types of tasks in most cases. This is because indicators in MetaTrader 5 are executed as one block, as if they were a single application running on the chart. This is done to speed up the calculations that MetaTrader 5 performs to provide us with certain values. These values are part of the set of input parameters that can be selected when placing an indicator on the chart. This has already been discussed in previous articles.
However, given that a bar counter runs only when a new bar appears on the chart, we may be tempted to use a timer for synchronization. And this is where the problems begin. Using a timer in an indicator is actually not recommended. This is because, if a failure occurs in the timer code, all other indicators will be affected, and it may even block MetaTrader 5 for a few moments—moments that could be decisive.
But there are ways to work with a system whose purpose is to detect the appearance of new bars on the chart. Using an indicator is essentially the simplest and most practical way to know when a new candle has appeared and, thus, to be able to count the candles and display text afterward. To reach the point where candle counting begins, we need to start somewhere. And we will start with the code you see below.
01. //+------------------------------------------------------------------+
02. #property copyright "Daniel Jose"
03. //+------------------------------------------------------------------+
04. int OnInit()
05. {
06.     return INIT_SUCCEEDED;
07. };
08. //+------------------------------------------------------------------+
09. int OnCalculate(const int rates_total, const int prev_calculated, const datetime &Time[], const double &Open[], const double &High[], const double &Low[], const double &Close[], const long &TickVolume[], const long &Volume[], const int &Spread[])
10. {
11.     return rates_total;
12. };
13. //+------------------------------------------------------------------+
Code 01
Now pay attention: every time the price of the symbol displayed on the chart changes, all indicators will receive a Calculate event from MetaTrader 5. In MetaTrader 5, the Calculate event is not triggered based on activity over a certain period of time. If you use a chart with a 10-minute period, then when each new bar appears after roughly 10 minutes, the Calculate event will not occur unless the price has actually changed. Until that moment, no Calculate event will occur.
Considering that with highly volatile symbols, Calculate events may occur at very short intervals—on the order of milliseconds—we need this Calculate event to execute as quickly as possible. In other words, we should not waste time on calculations or searching for information unnecessarily, as this will significantly slow down event processing.
This has a negative effect on all the other applications associated with that chart. And remember, we have not even touched on Expert Advisors yet. Yes, poorly optimized indicators seriously harm MetaTrader 5. But soon everything will look better.
For now, you need to understand that execution speed depends on how we search for information. In Code 01, you can see that we have an array intended to provide us with the time value of each bar. Note that here, in the Calculate event, we do not know the exact moment when the quote changed. We only know when this bar was created. And based on the timeframe shown on the chart, we can estimate how much time will be needed for the trade to close. This information is important for creating another type of application, which we will look at later.
But here our goal is to create a candle counter or, at least, to know whether there is a new bar on the chart. Thus, whenever the value of the Time array shown in line 09 changes, it means that a new bar has appeared on the chart.
Another method, which in my opinion is much simpler, is to look at the values of prev_calculated and rates_total. But why? The reason is that the value in the Time array has the datetime type. In contrast, the values prev_calculated and rates_total are provided by the MetaTrader 5 platform itself and have an integer type, which makes checking much simpler and faster. And since changes occur only when new bars appear on the chart, everything becomes much easier to observe.
Apart from another issue that we will get to soon, do you understand where I am going with this? It does not matter how we are going to implement something. What matters is understanding what information we have at our disposal to achieve our goal. To test this, we will change Code 01 into Code 02, as you can see below.
01. //+------------------------------------------------------------------+
02. #property copyright "Daniel Jose"
03. //+------------------------------------------------------------------+
04. int OnInit()
05. {
06.     return INIT_SUCCEEDED;
07. };
08. //+------------------------------------------------------------------+
09. int OnCalculate(const int rates_total, const int prev_calculated, const int begin, const double &price[])
10. {
11.     return rates_total;
12. };
13. //+------------------------------------------------------------------+
Code 02
Now we have a starting point for understanding that everything depends on correctly understanding the situation and being able to use the information at your disposal. There is no single right (or wrong) way to do something; there are only simpler ways to achieve the same goal and result. All right, but how do we determine whether a new bar has appeared on the chart or not? That is the simplest part, dear readers. To do this, we will modify Code 02 as shown below.
01. //+------------------------------------------------------------------+
02. #property copyright "Daniel Jose"
03. //+------------------------------------------------------------------+
04. int OnInit()
05. {
06.     return INIT_SUCCEEDED;
07. };
08. //+------------------------------------------------------------------+
09. int OnCalculate(const int rates_total, const int prev_calculated, const int begin, const double &price[])
10. {
11.     if ((prev_calculated > 0) && (prev_calculated != rates_total))
12.         Print("New Bar...");
13.
14.     return rates_total;
15. };
16. //+------------------------------------------------------------------+
Code 03
Code 03 shows exactly what we wanted to demonstrate and what was said a moment ago. In other words, here we have a very simple way to know when the current bar closed and when a new one appeared. To make sure of this, let us look at the animation below.
Animation 01
Since Code 03 is very simple, as is the animation itself, we can do without any explanations and start the most interesting part of the article. But to do that, we need to start a new topic.
Objects and the Chart
Contrary to popular belief, everything present on the chart is an object. Of course, these objects can have completely different purposes depending on what we are trying to create, but that does not change the fact that they are still objects. And one more point: the objects we are talking about have nothing to do with object-oriented programming (OOP). Now we are approaching the complicated part. There are two types of objects, or more precisely, two ways to place objects on a quote chart. That is how charts in MetaTrader 5 are structured.
The first type consists of objects whose coordinate system is tied to the chart, while the second type consists of objects positioned using screen coordinates. There are differences between these objects both in how they are displayed on the screen and in how we interact with them. However, there is a certain relationship between some types. Knowing how to choose the correct type greatly simplifies implementation and, naturally, speeds up code execution.
So, since this is our first encounter with something like this, let us move away from the candle counter for a short while, because first we need to understand how to handle these objects.
As a starting point, you should refer to the MQL5 documentation, to the section “Object Types”. There you can see a list of various objects. Although you might think that there are not enough objects there and that some are missing, that is not the case. In my opinion, MQL5 provides us with more than enough objects to use on the chart. Honestly, we will not need all of these elements. But if they are already implemented and available to us, I see no problem with using them effectively. In addition, many of them can be used in very interesting ways, which will save us a great deal of time.
To demonstrate this, we will write a small piece of code to show how we can work with objects on the chart. The code in question is shown below.
01. //+------------------------------------------------------------------+
02. #property copyright "Daniel Jose"
03. //+------------------------------------------------------------------+
04. #define def_NameChannel    "Demo"
05. //+------------------------------------------------------------------+
06. int OnInit()
07. {
08.    ObjectCreate(0, def_NameChannel, OBJ_REGRESSION, 0, 0, 0);
09.
10.    return INIT_SUCCEEDED;
11. };
12. //+------------------------------------------------------------------+
13. int OnCalculate(const int rates_total, const int prev_calculated, const datetime &Time[], const double &Open[], const double &High[], const double &Low[], const double &Close[], const long &TickVolume[], const long &Volume[], const int &Spread[])
14. {
15.    const int   n = 20,
16.                a = 2;
17.
18.    if ((prev_calculated > (n + a)) && (prev_calculated != rates_total))
19.    {
20.       ObjectMove(0, def_NameChannel, 0, Time[rates_total - (n + a)], Close[rates_total - (n + a)]);
21.       ObjectMove(0, def_NameChannel, 1, Time[rates_total - a], Close[rates_total - a]);
22.    }
23.
24.    return rates_total;
25. };
26. //+------------------------------------------------------------------+
27. void OnDeinit(const int reason)
28. {
29.    ObjectDelete(0, def_NameChannel);
30.    ChartRedraw();
31. };
32. //+------------------------------------------------------------------+
Code 04
Code 04 demonstrates what our first object inside an indicator will look like. Looking at it, you may think: "well, this is not an indicator, because it does not contain the structures we examined in previous articles." Yes, dear reader, Code 04 is indeed an indicator. You can verify this by looking at the OnCalculate function, which is responsible for handling the Calculate event generated by MetaTrader 5.
The thing is that the indicator shown in Code 04 is not a conventional indicator. It has a much more specific purpose and is aimed at performing a particular task. Before we look at how Code 04 works, let us see it running on the chart, as shown in the animation below.
Animation 02
It is necessary to see this specifically in an animation, because a static image would not be enough to understand what we will see next. But before we start making fun of the code, let us understand how Code 04 works. In line 04 we have a definition that allows us to assign a name to the object being created. And yes, everything placed on the chart must be assigned a name. It is time to start getting used to this right now.
Thus, in line 08 we merely try to create an object. In this case, it is a linear regression channel. Since we do not know where this channel will be displayed, we do nothing else. Now the following happens: the indicator will wait until MetaTrader 5 initiates a Calculate event with a certain characteristic. The condition we are waiting for is defined in line 18. Please note that line 18 of Code 04 is very similar to line 11 of Code 03, and it pursues the same goal: to wait for a new bar to appear. Until this happens, the object we created in line 08 will not be displayed on the chart.
As soon as a new bar appears, we use lines 20 and 21 to create the linear regression channel. Look at how this is done. We will discuss it in more detail a little later. For now, it should be noted that there is nothing mysterious about it. Line 20 specifies where the channel drawing begins, and line 21 specifies where it ends. In this way, we obtain a channel that will follow the price with a regression span of 20 bars and ignore the current bar.
Whenever you create an object and add it to the chart using an application, as a matter of good practice, your application should remove that object from the chart. To do this, we use line 29 inside the Deinit event handler.
But now the most interesting part begins. What if we change the way the linear regression is analyzed and the results are displayed? How will the indicator behave? To find out, we will completely change Code 04, as shown below.
01. //+------------------------------------------------------------------+
02. #property copyright "Daniel Jose"
03. //+------------------------------------------------------------------+
04. #define def_NameChannel    "Demo"
05. //+------------------------------------------------------------------+
06. int OnInit()
07. {
08.    ObjectCreate(0, def_NameChannel, OBJ_REGRESSION, 0, 0, 0);
09.
10.    return INIT_SUCCEEDED;
11. };
12. //+------------------------------------------------------------------+
13. int OnCalculate(const int rates_total, const int prev_calculated, const datetime &Time[], const double &Open[], const double &High[], const double &Low[], const double &Close[], const long &TickVolume[], const long &Volume[], const int &Spread[])
14. {
15.    const int   n = 20,
16.                a = 1;
17.
18.    if (prev_calculated > (n + a))
19.    {
20.       ObjectMove(0, def_NameChannel, 0, Time[rates_total - (n + a)], Close[rates_total - (n + a)]);
21.       ObjectMove(0, def_NameChannel, 1, Time[rates_total - a], Close[rates_total - a]);
22.    }
23.
24.    return rates_total;
25. };
26. //+------------------------------------------------------------------+
27. void OnDeinit(const int reason)
28. {
29.    ObjectDelete(0, def_NameChannel);
30.    ChartRedraw();
31. };
32. //+------------------------------------------------------------------+
Code 05
Notice that in Code 05 we only changed the OnCalculate event handler compared to Code 04. But the result is, at the very least, very interesting. You can see this in the animation below.
Animation 03
What we see in Animation 03 is simply crazy, especially considering that the regression is being created in real time. In other words, with each new price, the linear regression channel changes. And depending on the configuration used, you can get a truly sensitive trend indicator, even more sensitive than an exponential moving average. But I will leave that to today’s traders who are always eager to find a way to create a self-adjusting linear regression channel.
Perhaps you are looking at me and thinking: “so what is the point of such an indicator?” I would answer: I do not know. There is no denying that it is quite interesting and fun. However, anyone with a more thoughtful concept has already come up with a way to use this for other purposes, since all that needs to be done is to change the type of object being created and immediately specify the anchor points. From time to time, the objects will be adjusted automatically, without any need to remember to do it, because once they are on the chart, the rules we defined will be applied automatically.
Let us look at one more example. In this case, we will use a different type of object. Remember that everything we are going to show is intended solely for educational purposes. The code is shown just below.
01. //+------------------------------------------------------------------+
02. #property copyright "Daniel Jose"
03. //+------------------------------------------------------------------+
04. #define def_NameChannel    "Demo"
05. //+------------------------------------------------------------------+
06. int OnInit()
07. {
08.    ObjectCreate(0, def_NameChannel, OBJ_TREND, 0, 0, 0);
09.    ObjectSetInteger(0, def_NameChannel, OBJPROP_RAY_RIGHT, true);
10.
11.    return INIT_SUCCEEDED;
12. };
13. //+------------------------------------------------------------------+
14. int OnCalculate(const int rates_total, const int prev_calculated, const datetime &Time[], const double &Open[], const double &High[], const double &Low[], const double &Close[], const long &TickVolume[], const long &Volume[], const int &Spread[])
15. {
16.     const int   n = 60;
17.     double      p = DBL_MIN;
18.     int         t = 0;
19.
20.     for (int c = rates_total - (n + 1); c < rates_total; c++)
21.         p = (High[c] > p ? High[t = c] : p);
22.     ObjectMove(0, def_NameChannel, 0, Time[t], p);
23.     p = DBL_MIN;
24.     for (int c = t + 1; c < rates_total; c++)
25.         p = ((High[c] > p) && (Open[c] < Close[c]) ? High[t = c] : p);
26.     ObjectMove(0, def_NameChannel, 1, Time[t], p);
27.
28.    return rates_total;
29. };
30. //+------------------------------------------------------------------+
31. void OnDeinit(const int reason)
32. {
33.    ObjectDelete(0, def_NameChannel);
34.    ChartRedraw();
35. };
36. //+------------------------------------------------------------------+
Code 06
When Code 06 is executed, it produces what is shown below.
Animation 04
Do not get too excited about what you see, dear readers, because this is only a demonstration. Under no circumstances should it be regarded as a finished application. But in Animation 04 we see the appearance of a downtrend line built according to the criteria embedded in Code 06. “But how is this possible?” Put simply: I merely told the code how to look for a downtrend line according to my criteria.
Let us now understand what happened. In line 08, as in Code 03, we specify what type of object we want to place on the chart. Then in line 09 we change one of the object’s properties. If this property had not been defined as shown here in Code 06, the result would be as in the image below.
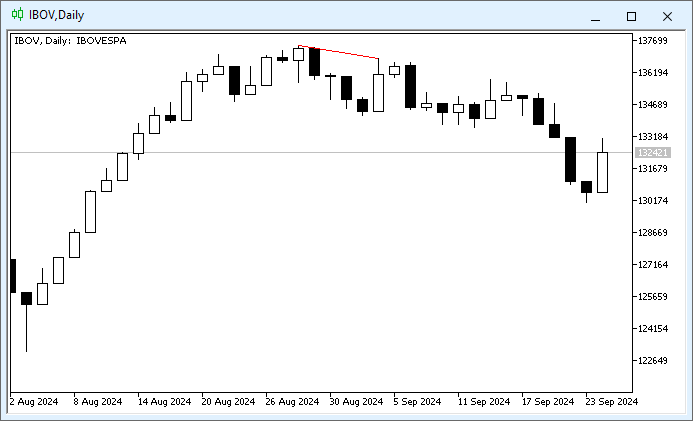
Image 01
Please note that now, looking at Image 01, we can see where the trend line was drawn from and to. In this case, we are looking for a downtrend line. Uptrend lines are defined using other criteria. But since the purpose here is not to show how to automatically identify and create trend lines, the criteria and methods we use really do work. All right, but then how did the indicator manage to find these points for drawing the trend line? It looks like magic.
No, dear reader, it is definitely not magic. It is merely the application of a basic criterion. Pay attention to the Calculate event handler. Please note that here we have two loops: one to determine the first point for drawing the trend line, and another to determine the second point needed to draw the trend line. When the first point is found, we use line 22 to tell the object where the first anchor point will be. Immediately after finding the second point, we use line 26 to indicate the location of the second anchor point. The rest is handled by MetaTrader 5 itself.
However, despite this, I want to emphasize that YOU SHOULD NOT REGARD this indicator as something worthy of praise. It was created so that we could detect what is shown in Image 01 and Animation 04. You are unlikely to find other details as perfect as those shown just above.
“All right, I understand. But can we not change other properties to create more personalized objects?” Yes, that is possible, dear readers. And one more point: unlike what happens when we try to change properties directly on the chart, some of these objects have properties that can be changed only through code.
But let us look at a simple example of changing properties. You can see it below:
01. //+------------------------------------------------------------------+
02. #property copyright "Daniel Jose"
03. //+------------------------------------------------------------------+
04. #define def_NameChannel    "Demo"
05. //+------------------------------------------------------------------+
06. int OnInit()
07. {
08.    ObjectCreate(0, def_NameChannel, OBJ_TREND, 0, 0, 0);
09.    ObjectSetInteger(0, def_NameChannel, OBJPROP_COLOR, clrLawnGreen);
10.    ObjectSetInteger(0, def_NameChannel, OBJPROP_WIDTH, 4);
11.
12.    return INIT_SUCCEEDED;
13. };
14. //+------------------------------------------------------------------+
                   .
                   .
                   .
Code 07
In this case, in Code 07, we see only the fragment that needed to be changed relative to what is shown in Code 06. But note that in line 09 we specify which color we want to use for the object, and in line 10 we specify what line width should be used. As a result of executing this code, we get what we see in the image below.

Image 02
So listen carefully, dear readers. In the current version of the code, IT IS NOT POSSIBLE to change the color or line width using the keyboard shortcut to access the indicator information, as shown in the image below.
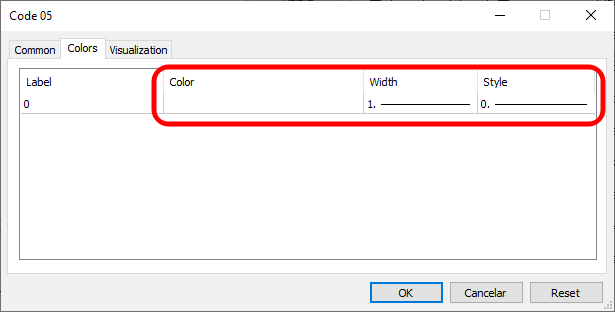
Image 03
To change the properties of these objects, we will need to use another dialog box. In other words, in this case we will have to use what is shown in the image below.
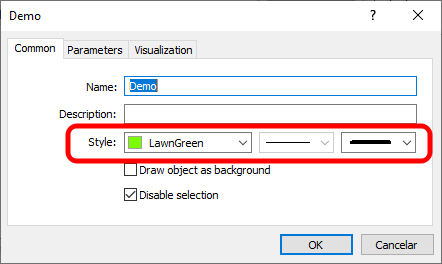
Image 04
I understand that this seems too complicated, but this is the classic way of using MetaTrader 5. Nevertheless, there are ways to avoid such situations, allowing the user to change object properties based on the configuration set directly in the indicator. But let us not rush, since this is only our first contact with objects. In that case, I think you will already have plenty of opportunities to experiment, so you will be ready for the next article.
Final Thoughts
In today’s article, we began looking at how to work with objects directly on the chart using specially developed code intended to show us how this is done. Although this first contact may have been somewhat superficial, it has already shown that, if we calmly think through the goal and plan the task well, we can do many very interesting things. To do this, you will need to practice and study how each of the objects provided by MQL5 works and how they can be used in MetaTrader 5. Without a true understanding of the available possibilities, you will not be able to bring any of your ideas to life.
As always, in this series of articles you will find the complete code in the attachment. However, especially in the context of this article, I must warn you that all the code provided is intended for study and for practicing what is explained in the article. Do not use the code presented here as finished applications or for other purposes unrelated to studying the material, because it could seriously harm your wallet.
Translated from Portuguese by MetaQuotes Ltd.
Original article: https://www.mql5.com/pt/articles/15975
Warning: All rights to these materials are reserved by MetaQuotes Ltd. Copying or reprinting of these materials in whole or in part is prohibited.
This article was written by a user of the site and reflects their personal views. MetaQuotes Ltd is not responsible for the accuracy of the information presented, nor for any consequences resulting from the use of the solutions, strategies or recommendations described.

- Free trading apps
- Over 8,000 signals for copying
- Economic news for exploring financial markets
You agree to website policy and terms of use