
Category Theory in MQL5 (Part 7): Multi, Relative and Indexed Domains
Introduction
In the prior article we looked at how changes to cones and compositions can affect sensitivity-analysis results thus presenting opportunity in system design depending on the indicators and securities one could be trading with. For this one we will take a deeper look at the various types of special/unique domains one can come across and also explore how their relationships can be used to moderate expectations in price volatility.
Multi-Domains
In category theory, a multidomain (also known as a bag or a heap) is a generalization of a domain that allows for multiple occurrences of the same element. Recall in article one the strict definition of a domain required every element to be unique. A multi-domain accommodates situations where repetition of elements within a domain is necessary to properly capture all metadata of those elements within that domain. For instance, consider a domain consisting of the words in this sentence:
“Sets theory deals with sets, while category theory deals with sets of sets, sets of sets of sets, and so on.”
Typically, this would be represented in a domain as follows:
{sets, theory, deals, with, while, category, of, and, so, on}
However, as you can see the full meaning of the sentence is lost. In order to capture this extra information, a multidomain X is formally defined as
X := (N, π)
- N is the typical domain representation of X as it only enumerates the elements in X without repetition.
- And π is the homomorphism from X to N.
π: X → N,
N is often referred to as the set of names in X, and to π is the naming function for X. Given a name x ∈ N, with π -1(x) ∈ X, as the preimage; the number of elements in π -1(x) is called the multiplicity of x.
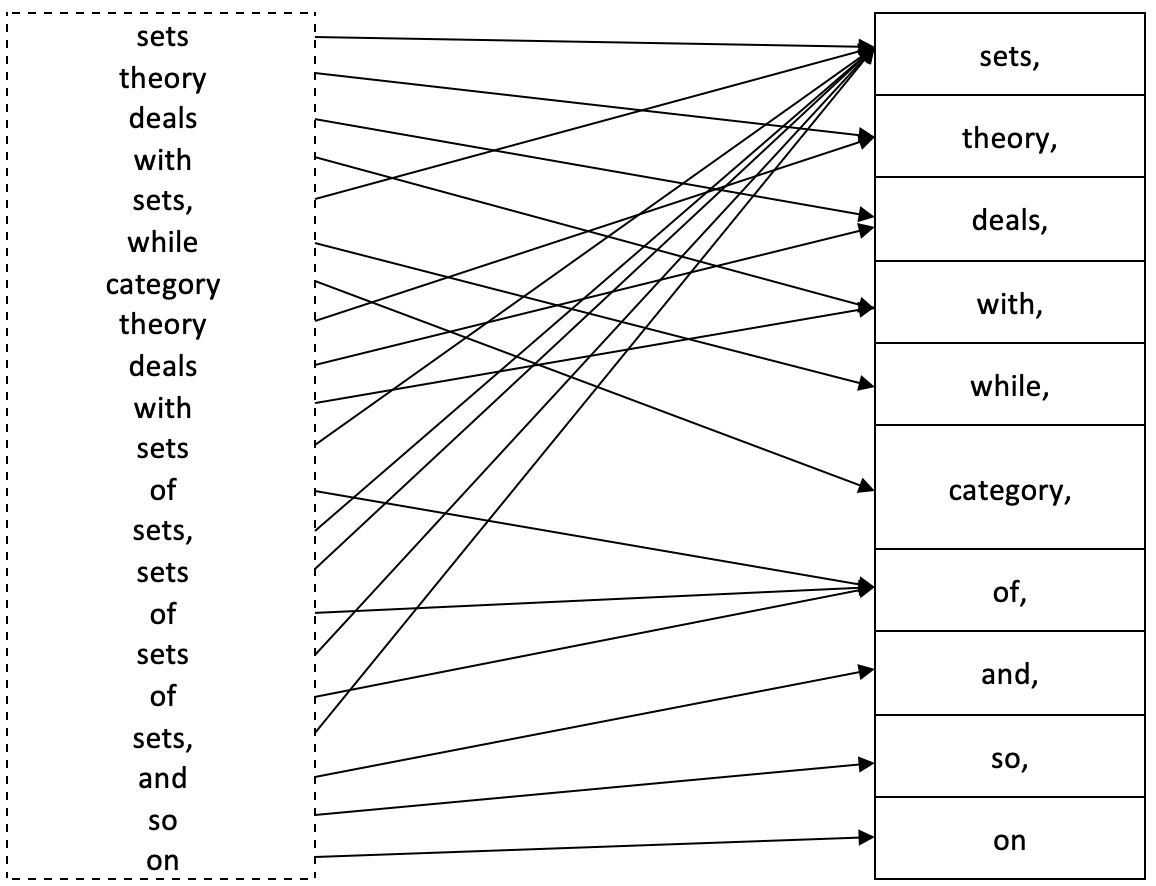
Putting this all together would give us the following diagram.
So, the multiplicity of ‘sets’ would be 8, that of ‘deals’ 2, for ‘category’ it is 1, and so on.
To illustrate this further for a trader let us consider a time series of prices. If we are interested in changes in price bar range and we want to forecast these changes using previous price bar action we could come up with 2 domains that explain this relationship.
If we take previous price action as multi-dimension data set and the changes we want to forecast as one dimensional, the homomorphism between the two will connect both domains over a training lag, say one price bar. The diagram below can help demonstrate this for clarity.
This homomorphism set represent a multidimensional domain because when dealing with multiple data points (or even just one in some instances) we are bound to have repetitions in the source domain. For the codomain we can normalize all data points as integers that range from -100 to +100 as a percentage representation of the magnitude of the resulting change in price range. This normalization means we will have no repetitions thus the elements in the codomain can be surmised as below.
{-100, -80, -60, -40, -20, 0, 20, 40, 60, 80, 100}
For an overall size of 11. We can take this homomorphism set one step further by considering domain data with more than two dimensions. Supposing in forecasting changes in price bar range we considered more than one lag? Let’s look at the diagram below.
It is similar to what we had above with the only difference being the addition of data points. Ideally, we would have to train our model to accumulate sufficient data points in the domains and codomains and in order to use it we could use a number of methods when mapping to the codomain. For this article we could consider using a winner takes-all approach for selecting the codomain prediction. So, the winner takes all would be the multi-dimension data point (which is simply represented as a vector or an array since the element class is an array) that when its distance from the new or current input data, is closest of all those in the domain. This would be captured as shown in the code below.
//+------------------------------------------------------------------+
//|                                                                  |
//+------------------------------------------------------------------+
int CTrailingCT::Morphisms_A(CHomomorphism<double,double> &H,CDomain<double> &D,CElement<double> &E,int CardinalCheck=4)
   {
      int _domain_index=-1,_codomain_index=-1;

      if(E.Cardinality()!=CardinalCheck){ return(_domain_index); }

      double _least_radius=DBL_MAX;
      for(int c=0;c<D.Cardinality();c++)
      {
         double _radius=0.0;

         m_element_a.Let();

         if(D.Get(c,m_element_a))
         {
            for(int cc=0;cc<E.Cardinality();cc++)
            {
               double _e=0.0,_d=0.0;
               if(E.Get(cc,_e) && m_element_a.Get(cc,_d))
               {
                  _radius+=pow(_e-_d,2.0);
               }
            }
         }

         _radius=sqrt(_radius);

         if(_least_radius>_radius)
         {
            _least_radius=_radius;
            _domain_index=c;
         }
      }

      //

      for(int m=0;m<H.Morphisms();m++)
      {
         m_morphism_ab.Let();

         if(H.Get(m,m_morphism_ab))
         {
            if(m_morphism_ab.Domain()==_domain_index)
            {
               _codomain_index=m_morphism_ab.Codomain();
               break;
            }
         }
      }

      return(_codomain_index);
   }
To apply category theory in this model, we would consider the concept of commutation, already touched on in earlier articles. If we adapt the diagram shown below, we would have multi-domain arrangements at homomorphisms π and π’ and the ability to commute simply implies we have two ways of projecting changes in the price range.
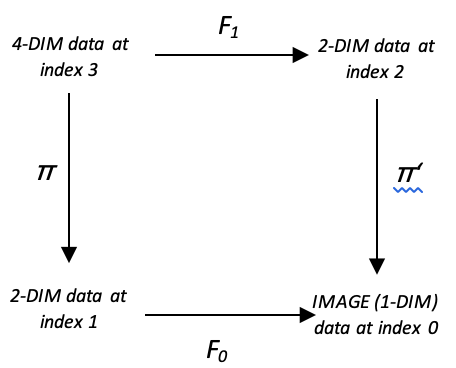
How we use this to get our forecast could be achieved by:
- Taking the mean of the two projections
- Taking their maximum or
- Using their minimum
For the shared code we have provided option for selection between minimum, mean and maximum as shown in the code snippet below.
//+------------------------------------------------------------------+
//| Checking trailing stop and/or profit for short position.         |
//+------------------------------------------------------------------+
bool CTrailingCT::CheckTrailingStopShort(CPositionInfo *position,double &sl,double &tp)
  {
//--- check
      if(position==NULL)
         return(false);

      Refresh();

      m_element_a.Let(); m_element_b.Let(); m_element_c.Let();
      m_element_bd.Let(); m_element_cd.Let();

      SetElement_A(StartIndex(),m_element_a);
      int _b_index=Morphisms_A(m_multi_domain.ab,m_multi_domain.ab.domain,m_element_a,4);
      int _c_index=Morphisms_A(m_multi_domain.ac,m_multi_domain.ac.domain,m_element_a,2);

      SetElement_B(StartIndex(),m_element_b);
      SetElement_C(StartIndex(),m_element_c);

      int _b_d_index=Morphisms_D(m_multi_domain.bd,m_multi_domain.bd.domain,m_element_b,2);
      int _c_d_index=Morphisms_D(m_multi_domain.cd,m_multi_domain.cd.domain,m_element_c,2);

      int _bd=0,_cd=0;
      if(m_multi_domain.bd.codomain.Get(_b_d_index,m_element_bd) && m_element_bd.Get(0,_bd) && m_multi_domain.cd.codomain.Get(_c_d_index,m_element_cd) && m_element_cd.Get(0,_cd))
      {
         m_high.Refresh(-1);
         m_low.Refresh(-1);

         int _x=StartIndex();

         double _type=0.5*((_bd+_cd)/100.0);                //for mean
         if(m_type==0){ _type=fmin(_bd,_cd)/100.0; }        //for minimum
         else if(m_type==2){ _type=fmax(_bd,_cd)/100.0; }   //for maximum

         double _atr=fmax(2.0*m_spread.GetData(_x)*m_symbol.Point(),m_high.GetData(_x)-m_low.GetData(_x))*(_type);

         double _sl=m_high.GetData(_x)+(m_step*_atr);

         double level =NormalizeDouble(m_symbol.Ask()+m_symbol.StopsLevel()*m_symbol.Point(),m_symbol.Digits());
         double new_sl=NormalizeDouble(_sl,m_symbol.Digits());
         double pos_sl=position.StopLoss();
         double base  =(pos_sl==0.0) ? position.PriceOpen() : pos_sl;

         sl=EMPTY_VALUE;
         tp=EMPTY_VALUE;
         if(new_sl<base && new_sl>level)
            sl=new_sl;
      }
//---
      return(sl!=EMPTY_VALUE);
  }
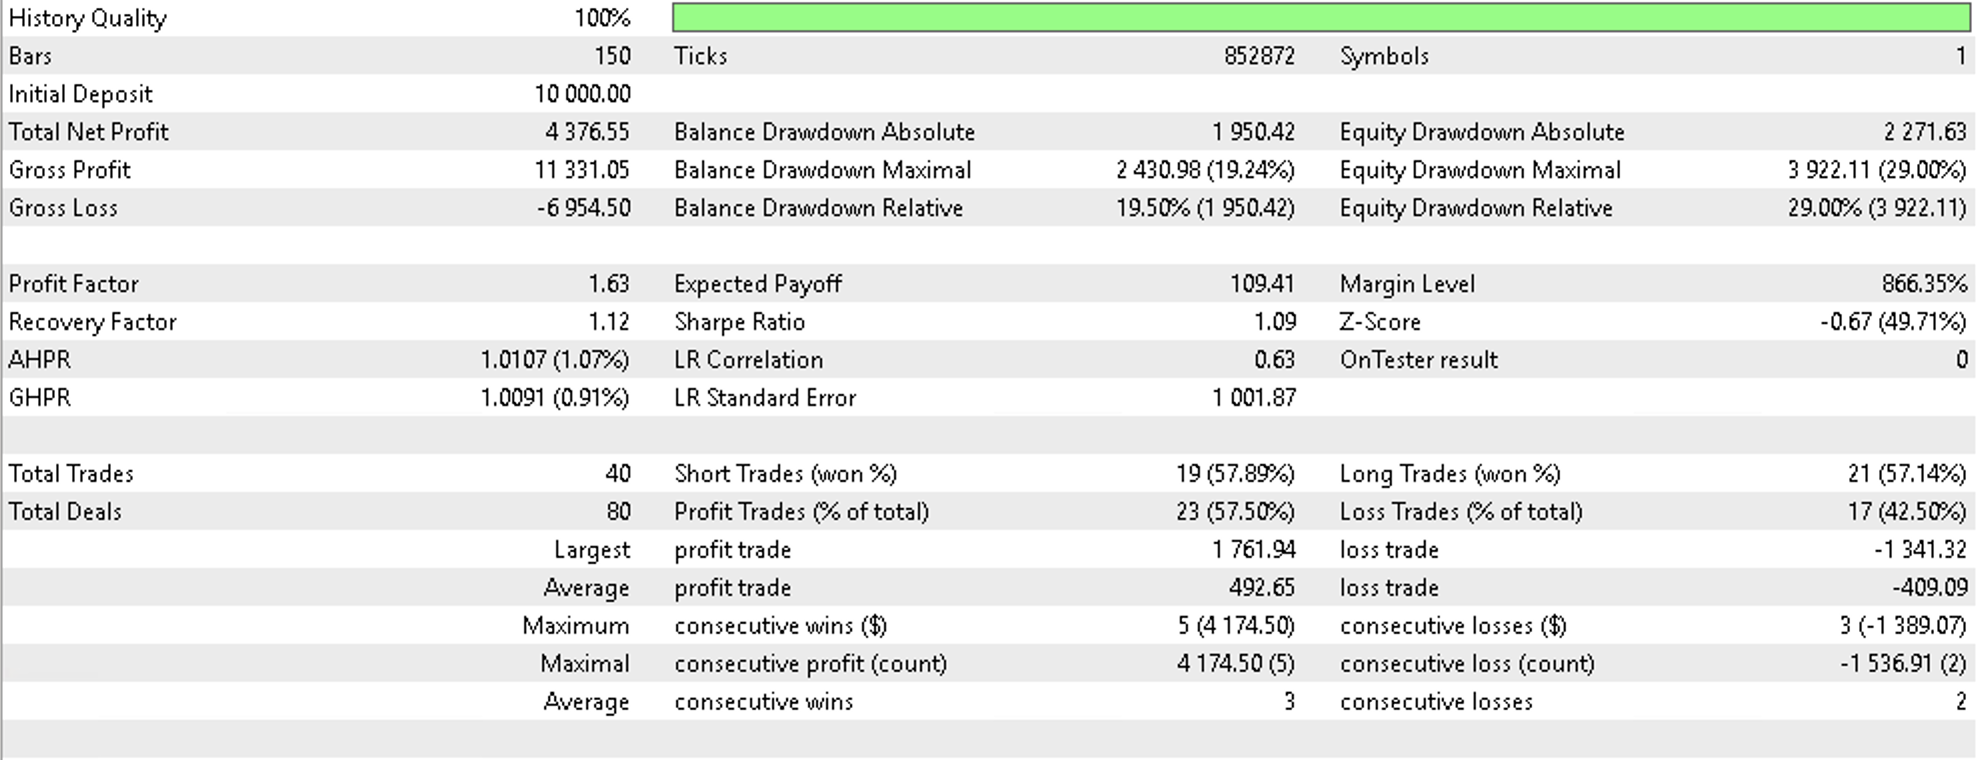
If we run tests on EURGBP on the daily time frame from 2022.01.01 to 2022.08.01 and use a simple signal like the built in Awesome Oscillator (‘SignalAO.mqh’) we would get the following report.
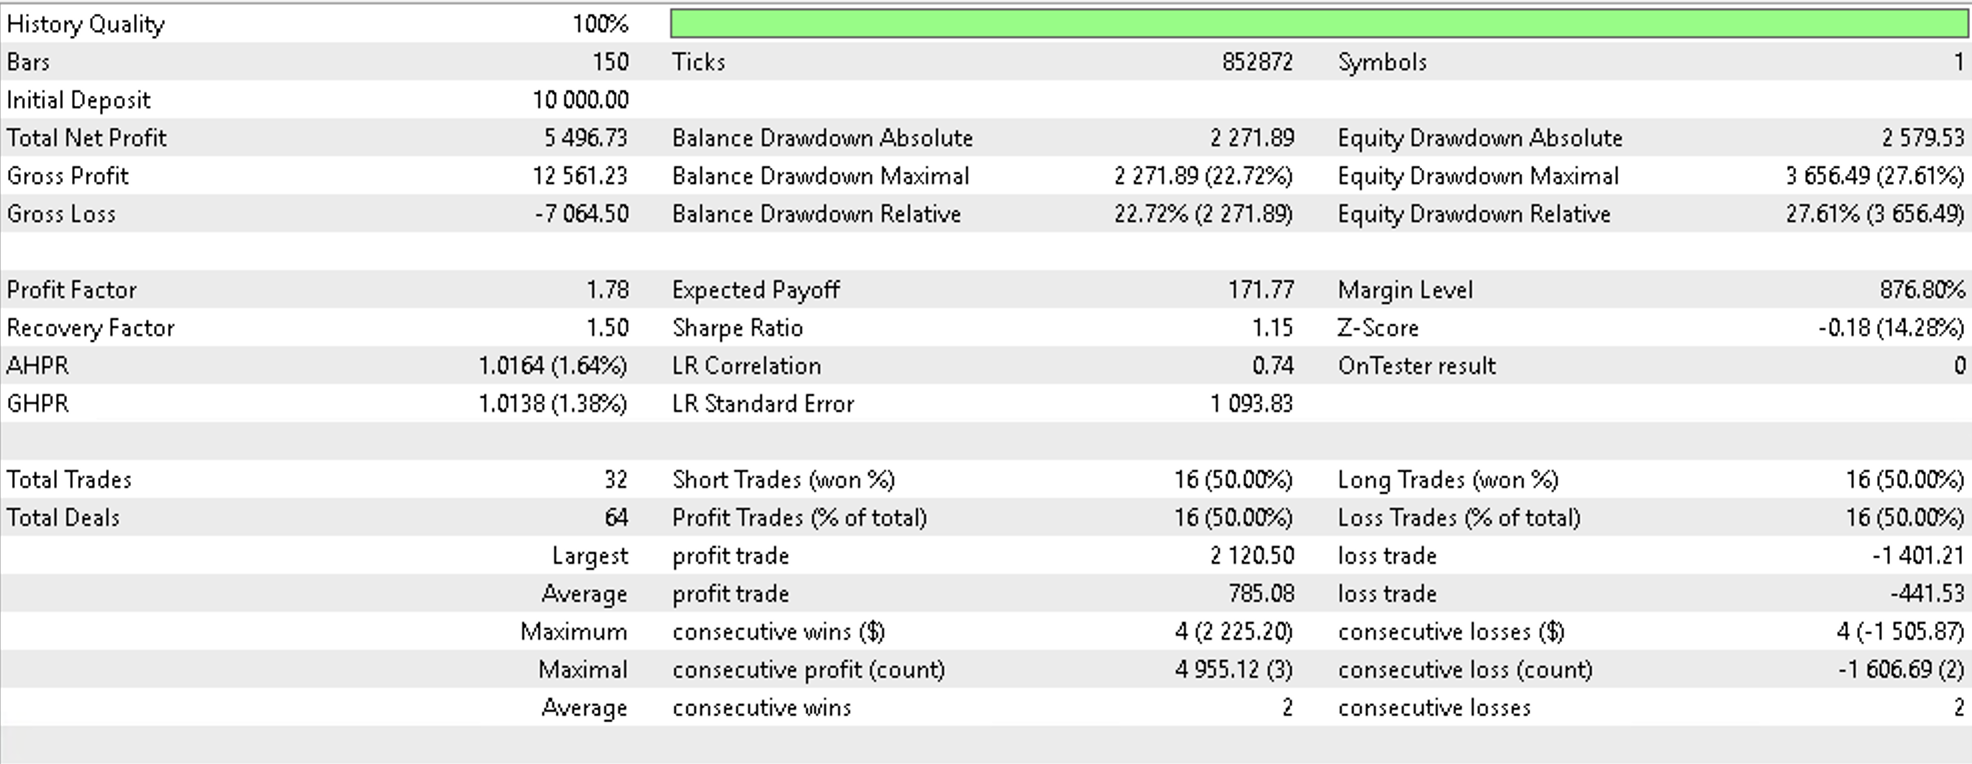
As a control if we similarly run the same signal but using one of the inbuilt trailing classes that uses Moving Average over the same period and same daily time frame with also the same position sizing class (fixed margin) we would get the following report.
This speaks to the potential for multi-domains use in not just projecting changes in price bar range to inform trailing stop decisions but possibly even signal or money management decisions. We have only covered trailing stops in this article so perhaps the reader can explore the other 2 applications in their time.
Relative-Domains
Relative domains are an extension of the concepts above on multi-domains however Wikipedia does not yet have a reference page on this subject. If we however revisit our first example above that used a simple sentence to define multi-domains, we would take it a step further by having the codomain, N, as the dictionary of all English words. This would imply that any English sentence would have a homomorphism with N. A homomorphism from sentence A to a sentence B would send each word found somewhere in A to the same word found somewhere in B.
Formally though, A mapping of relative domains over N, represented as f: (E,π) à (E’,π’), is a function f: E àE’ such that the following triangle commutes
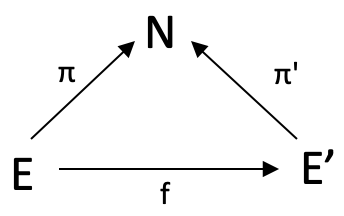
To illustrate this for traders we would exploit morphism f by modifying our square commute used above to be a simple tringle with no D domain. In exploiting f we would seek morphism weights between two domains E & E’ which for our demonstration purposes are, as above, multidimensional data at index zero and at index 1. The ‘multi-dimensionality’ simply means we are measuring and logging more than one data point. In our case this is changes in highs, and changes in lows. So because we already know the eventual change in price range for the bar at index 1 (our lag) we would use morphism f to transform our current data point whose eventual change we do not know yet and find which of the elements in E’ it is closest to matching. The closest match’s codomain element across π’ will give us our projected change.
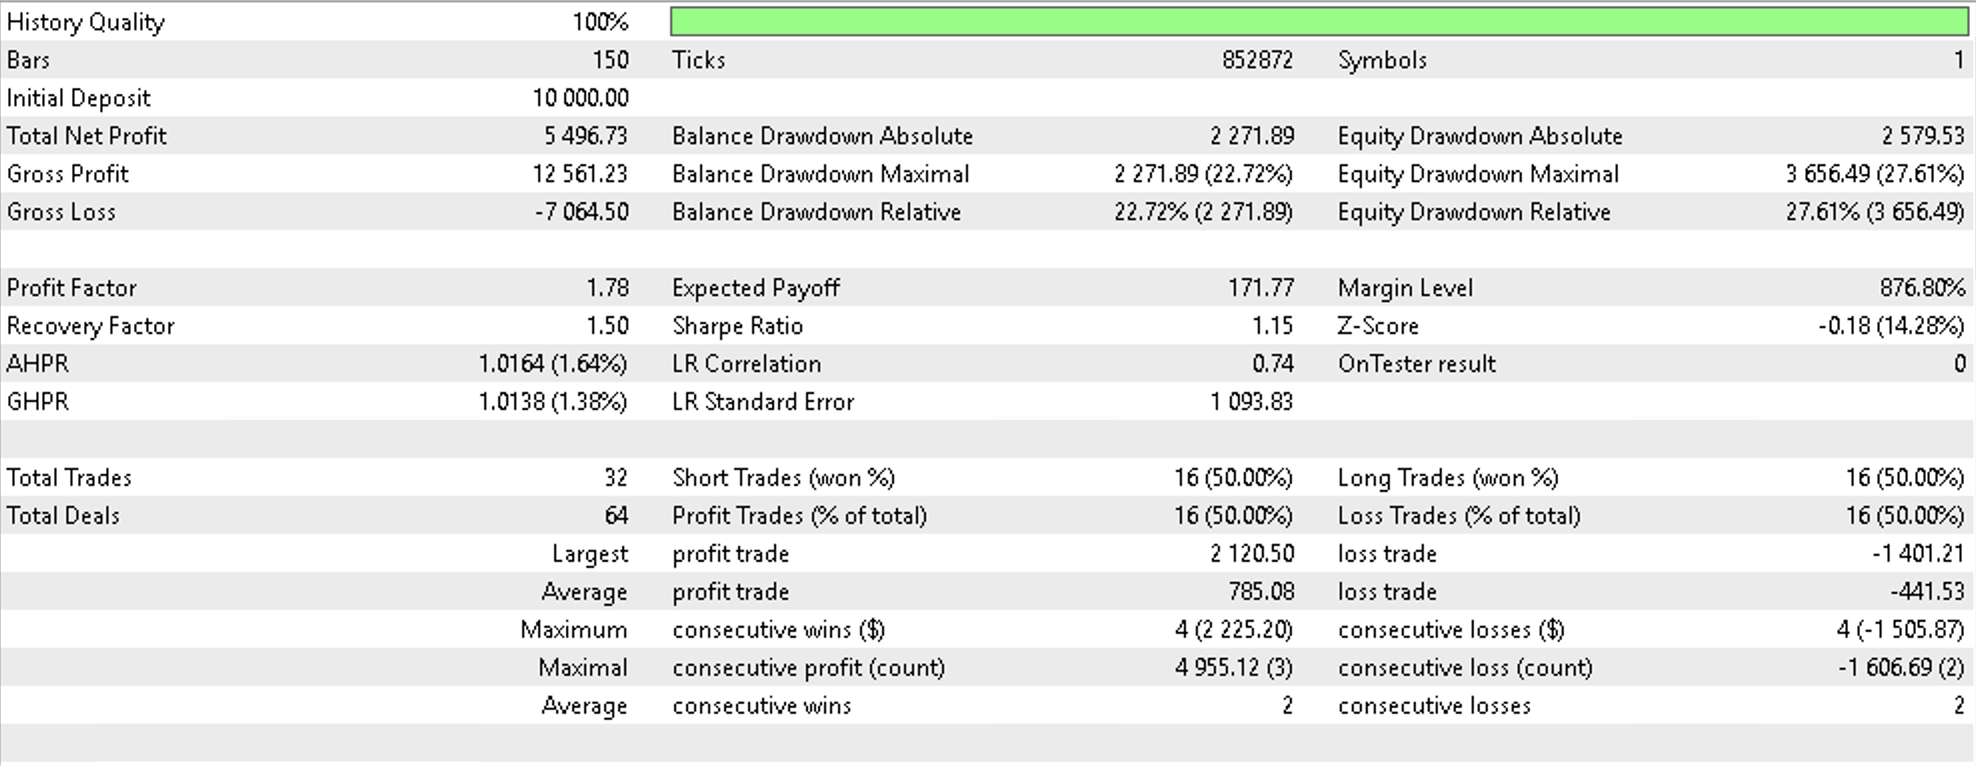
Running tests as before does give us the following report.
As you can note the report is identical to our first however there were some slight improvements in additional tests I performed although these are not shared here. Keep in mind all this experts are using the same entry signal (inbuilt Awesome Oscillator Signal), with only change being in trailing stop implementation.
Indexed-Domains
An indexed-domains are equivalent to relative-domains in that they take the elements of domain N above and turn them into domains such that each of these new domains has a relation with the elements in E and E’. A quick example to illustrate how this could be if we consider a school which has a collection of classes (N). Each class has a domain of pupils that attend it (E) and each class also has a domain chairs (E’). The domains E and E’ are thus referred to as N-Indexed domains because of their relation to the class.
For traders we would upscale our domain N which has had 11 values to now have 11 domains. Each domain would capture finer increments in changes in price range. For instance, in place of the element represented by 40 (40% change) we could have 9 new changes in the domain:
{32.5, 35.0, 37.5, 40.0, 42.5, 45.0, 47.5, 50.0}
This domain then maps to all the elements in E and E’ which our case in the last example was multi-dimension data capturing changes at 1 lag and changes at 2 lags. If we take a step back and consider more general applications of indexed domains to traders we could come up with quite a list. Here are five possible uses.
Moving averages, a popular indicator used by traders to smooth out short-term fluctuations in market data and identify trends in asset prices. This technique involves working out the average price of an asset over a time window, and then plotting on a chart to reveal patterns and trends.
Indexed sets and category theory can provide a means for looking at moving averages differently. As already mentioned, an indexed set is a collection of elements that are indexed by another domain. In the context of moving averages, the indexed domain could constitute different periods for working out the moving average since each period constitutes a buffer of moving average periods which can be thought of as a domain.
Our E and E’ could be moving average that is worked out by typical price and moving average that is worked out by median price respectively. There could be other such domains beyond the two considered throughout this article such in this case MA by close price, or weighted average price and so on. Suffice it to say this sub-domain classification can be studied outside of Category Theory. What Category Theory contributes to this study though, is the focus on the relative-domain relations. The morphisms between E and E’ (f) such as between median price MA at period of 21 and median price MA at say period of 34 can have many uses. One such could be in mapping out a moving average ribbon whereby if we track the changes to the weights in these morphisms we could quantify how much a trend has left to continue or whether a reversal is happening soon.
In addition to the application in trailing open positions by classifying and forecasting price volatility, it may be helpful to list a few other applications of multi-domains and indexed domains in category theory to traders. Here are a few as far as entry signal selection is concerned.
- Order book analysis. When journaling buy and sell orders in an order book as Multi-domains (because a particular security could be bought or shorted at different times and with different allocations, meaning the domain of the securities will have ‘repetitions’), a trader can identify where the supply and demand for a security is concentrated. If the buy multi-domain is larger than the sell multi-domain, this may be a signal to buy, while if the sell multi-domain is larger, it may be a signal to sell.
- Portfolio analysis. Multi-domains can represent a trader's portfolio, with each element representing a specific security or asset (why? Because each security may be hedged by option contracts or other derivative instruments meaning they appear more than once). By analyzing such a multi-domain of securities and focusing on their performance a trader may decide to allocate more of the good performers and close positions or even short the under-performers.
- Risk management. Multi-domains can represent the distribution of risk across a trader's portfolio when looking at say performance drawdowns in past trade sessions (each normalized drawdown range could appear multiple times across the various sessions leading to the application of multi-domains). If the multi-domain of high-risk securities is larger than the multi-domain of low-risk securities, this may be a signal to sell some of the high-risk securities and buy some low-risk securities.
- Trading strategies. Multi-domains can represent trading strategies, with each element representing a specific trade decision such placing market orders, pending orders, stopping out or taking profits (such decisions are bound to be repetitive and the sequence in which they are made matters meaning a multi-domain would help capture this sequence information and help further in one’s analysis). By analyzing the multi-domain of successful trades, a trader may decide to implement a similar long strategy for those trades.
- Technical indicators. Multi-domains can represent technical indicators such as moving averages or Bollinger Bands by logging their normalized values over a period that is being studied (normalized values over each interval are bound to be repetitive across the study interval and by noting the sequence these repetitions within a multi-domain one’s analysis is more complete). If the multi-domain of values for a specific technical indicator is above or below a certain threshold, this can be used a signal to buy or sell.
- Correlations. Multi-domain can represent correlations between different securities or assets. Correlation values are typically ranging from -1.0 to +1.0 and if these values are normalized to say the first decimal these would give values like {1.0, 0.4, -0.7, 0.1,…} and so on Such correlations could be measured across assets or across time windows of the same asset meaning, once again, repetitions are bound to occur. By accommodating these repetitions in a multi-domain that say has a relation to a codomain that lists security names one’s analysis does not miss the significance of each correlation value. If a multi-domain of securities that are highly correlated with a bullish-momentum security is larger than that of bearish momentum securities, this may be a signal to buy, with a reverse situation signaling a sell.
- Time series analysis. Multi-domains can represent time series data, allowing traders to analyze trends and patterns over time. Again, over time we are bound to have the same trend patterns repeat which is why simply listing each once in a domain will not tell you what sequence, within the time series, each pattern followed. So multi-domains would be resourceful here, and in application if values for a specific time period is above or below the average, this could indicate an oversold situation and be a signal to buy or sell if this were reversed or extra factors are being considered depending on one’s strategy.
- Sentiment analysis. Multi-domains can show sentiment of market participants. If we dwell on the majority sentiment of the participants, this value if properly quantified and normalized (such as CBOE Volatility Index (VIX)), it is bound to repeat over an analyzed period. If a multi-domain captures all these values, in their sequence, and the current positive sentiment is larger than that of negative sentiment, this could be a firmer signal to buy because of the extra logged information within the multi-domain than if only distinct values were used.
- Trading signals. Multi-domains can represent trading signals if you have more than one demo-account with each set up to receive signals under a subscription arrangement. The actions of each signal whether to buy or sell, in the various volume amounts, when tabulated is bound to have repetitions. A typical domain that omits such repetitions lose information such as the trade volume attached to each signal decision and this could warp one’s analysis of the relative performance of these signals.
- Market data. Multi-domains can represent market data such as volume at timeframe set intervals especially if the volume-contract amounts are normalized into quartiles for easy interpretation. These normalized amounts, over the period a security is being examined, are bound to repeat. Since multi-domains accommodate this repetition it becomes easy to have a more concise analysis with whatever codomain you choose to pair with this volume domain.
In a similar vein it may be useful to list possible uses of indexed-domains to money management for traders, so here is a list:
- Market capitalization weighting. Indexed-domains can represent the market capitalizations of different stocks in a portfolio. From our diagram above this would be in domain N, with domains E, E’ and the rest representing stocks within a certain market cap bracket. The function f would guide relative sizing of the stocks within a folio.
- Factor investing. Indexed-domains can examine different factors that influence the performance of a stock or a portfolio, such as value, momentum, and growth. From our diagram above the normalized performance benchmarks would be in N with E, E’, and other domains representing the factors. Morphism f would set relative importance of each factor.
- Risk parity. The risk parity approach to portfolio construction seeks to allocate investment capital on a risk-weighted basis to optimally diversify investments, viewing the risk and return of the entire portfolio as one. In this case our risk weighting would be in N, with individual assets taking up E, E’,… and the function f defining the relative weighting amongst the assets.
- Smart beta. Smart beta seeks to combine the benefits of passive investing and the advantages of active investing strategies by using alternative index construction rules to traditional market capitalization-based indices. It emphasizes capturing market inefficiencies in a rules-based and transparent way. Domain N would feature normalized performance return benchmarks while E and E’ could be active ETFs and passive ETFs respectively. Function f guides in their relative weighting.
- Value at Risk (VaR). Value at risk (VaR) is a way to quantify the risk of potential losses on an open trade position. This metric can be computed either historically, using variance-covariance, or Monte Carlo methods. Investment banks commonly apply VaR modeling to company-wide risk due to the potential for independent trading desks to unintentionally expose the firm to highly correlated assets. The scale of maximum loss would be in domain N, E, E’ would be assets of different types e.g. equities & bonds, while f could be relative portfolio weighting arrived at from past trade performance.
Conclusion
In conclusion we have looked at multi-sets, relative sets and indexed sets and their potential application in classifying and forecasting price volatility. We have, this far, avoided referring to domains as sets but perhaps going forward in the next articles we will refer to them as sets since these are better understood while domains, though more appropriate since they are an umbrella term for other 'types of sets' like topologies, simplical complexes, and other formats, we will not have such applications and examples in these series of articles. Therefore going forward we will use sets to refer to what we have been calling domains in this and earlier articles.
Warning: All rights to these materials are reserved by MetaQuotes Ltd. Copying or reprinting of these materials in whole or in part is prohibited.
This article was written by a user of the site and reflects their personal views. MetaQuotes Ltd is not responsible for the accuracy of the information presented, nor for any consequences resulting from the use of the solutions, strategies or recommendations described.
- Free trading apps
- Over 8,000 signals for copying
- Economic news for exploring financial markets
You agree to website policy and terms of use


Good work.
Am glad you liked it. Cheers.
A pity that topologies and simplical complexes will not be considered.