Smart Renko MT5
- Indikatoren
-
Young Ho Seo
 Harmonic Pattern Indicator - Repainting + Japanese Candlestick Pattern Scanner + Automatic Channel + Many more
https://www.mql5.com/en/market/product/4488 - Version: 6.5
- Aktualisiert: 3 März 2022
- Aktivierungen: 5
Einführung in Smart Renko
Die Hauptmerkmale von Renko Charting betreffen die Preisbewegung. Um Ihnen eine Vorstellung von seinem Funktionsprinzip zu geben, wird das Renko-Chart so konstruiert, dass ein Ziegelstein über oder unter dem Chart platziert wird, wenn der Kurs eine Bewegung über einen vordefinierten Bereich, die sogenannte Ziegelsteinhöhe, hinaus macht. Daher kann man natürlich eine klare Preisbewegung mit weniger Rauschen als bei anderen Charttypen sehen. Das Renko-Charting kann eine viel klarere Trendrichtung liefern und hilft, wichtige Unterstützungs- und Widerstandsniveaus deutlicher zu erkennen. Da das Renko-Charting keine Zeit verwendet, ist es schwierig, das Original-Renko-Charting zusammen mit anderen technischen Indikatoren zu verwenden. Insbesondere das Backtesting Ihrer Strategie mit dem typischen Renko-Chart ist sehr schwierig und zeitaufwendig. Wir haben jedoch Smart Renko Chart hierher gebracht. Smart Renko überwindet die Einschränkungen des traditionellen Renko-Charts und bringt Ihnen viele weitere Vorteile für Ihr effizientes Trading.
Hauptmerkmale von Smart Renko
- Sie können jeden beliebigen Zeitrahmen zur Berechnung Ihrer Renko-Bausteine verwenden, einschließlich M1 und M5.
- Smart Renko zeigt Ihnen eine allgemein angenehme Trendbewegung für alle Zeitrahmen.
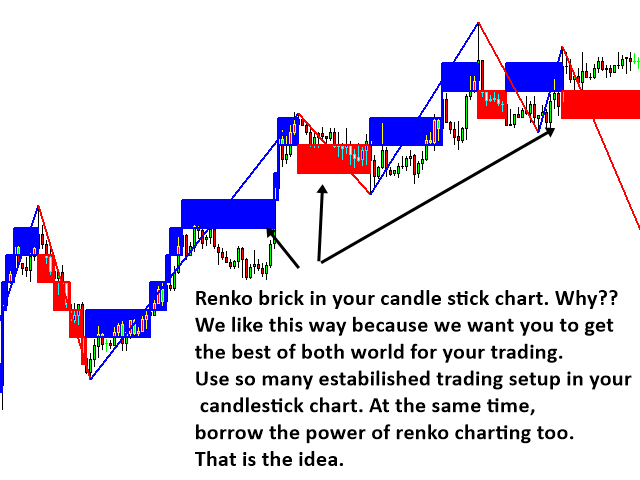
- Sie können die Spread-Ansicht der Renko-Bausteine auf Ihrem Hauptchart anzeigen, um Backtests mit anderen technischen Indikatoren durchzuführen.
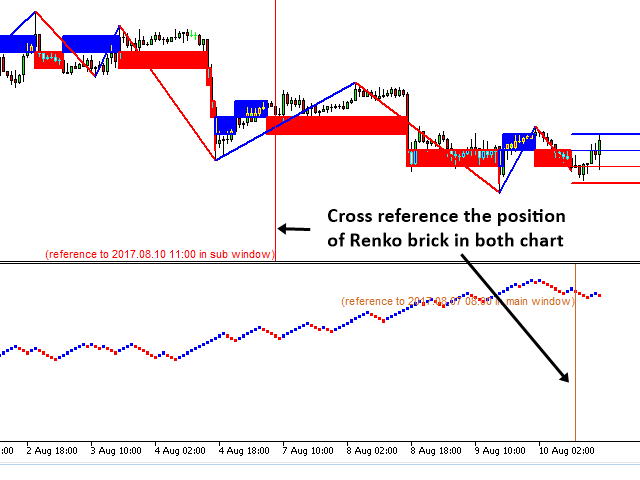
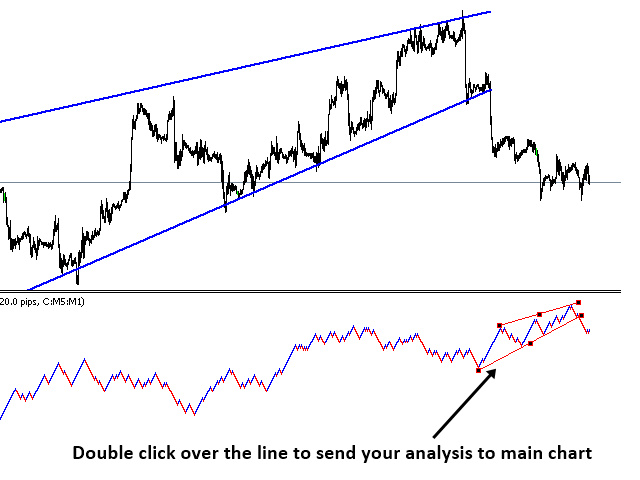
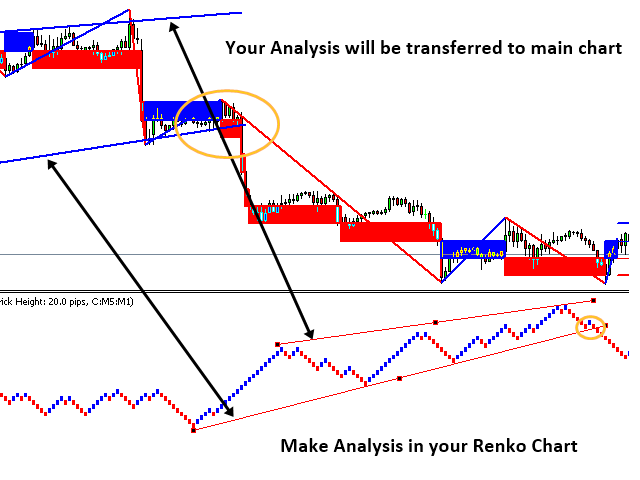
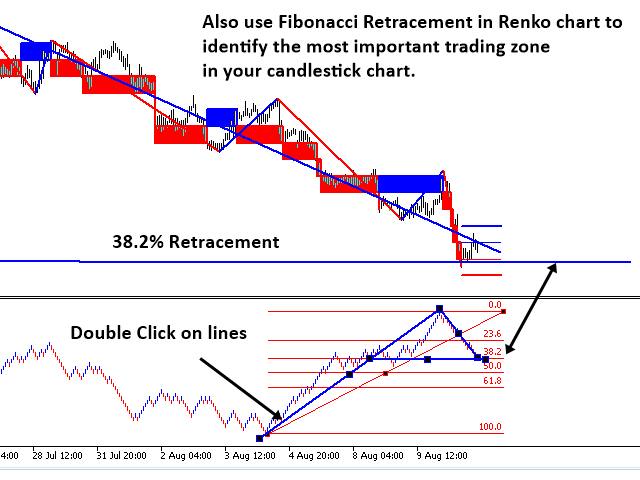
- Sie können Querverweise zwischen den Renko-Bausteinen auf Ihrem Hauptchart und den Renko-Bausteinen auf Ihrem Indikatorchart herstellen. (Doppelklicken Sie einfach auf Ihren Haupt- oder Indikator-Chart. Sie werden auf beiden Charts Referenzlinien sehen.)
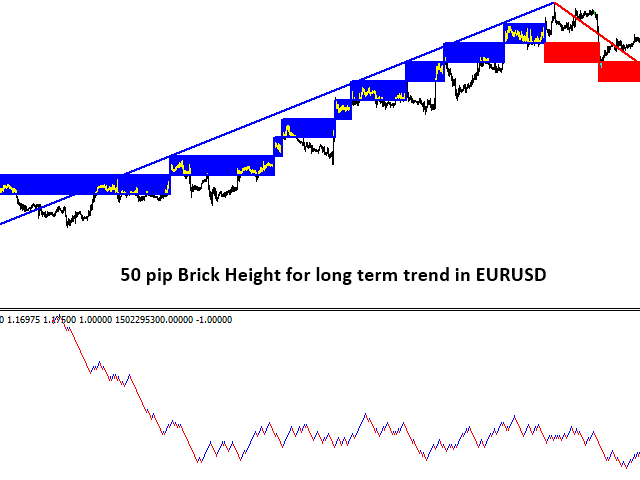
- Smart Renko beinhaltet eine automatische Berechnung der Steinhöhe unter Verwendung von Standardabweichung und Z-Wert. Daher kann auch ein Anfänger diesen Smart Renko Indikator verwenden.
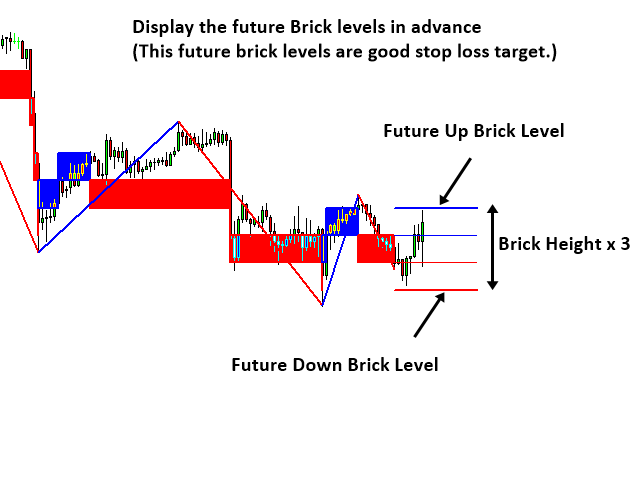
- Smart Renko zeigt das zukünftige Niveau für den Kauf und Verkauf von Ziegeln im Voraus an.
Einige Hinweise zu Smart Renko
- Smart Renko muss zusammen mit anderen Indikatoren verwendet werden. Sie können ihn mit vielen eingebauten technischen Indikatoren, wie MACD, RSI oder Stoch, Moving Average, erfolgreich verwenden, um Ihre Handelsstrategie zu erstellen.
- Das Liniendiagramm wird bei Smart Renko bevorzugt. Daher verwendet Smart Renko in der Standardeinstellung ein Liniendiagramm. Sie können jedoch jederzeit das Liniendiagramm ausschalten und ein Candlestick-Diagramm verwenden.
- Der Renko-Chart sollte mit M1-Daten berechnet werden. Sie können den M1-Zeitrahmen für die Berechnung mit Smart Renko wählen. Die meisten Broker haben jedoch nur wenige historische Daten für den M1-Zeitrahmen. Daher ist der Standard-Zeitrahmen für die Berechnung der M5-Zeitrahmen.
- Es ist möglich, Ziegelsteine auf den gesamten historischen Daten zu zeichnen. Dies kann Ihr Handelsterminal verlangsamen.
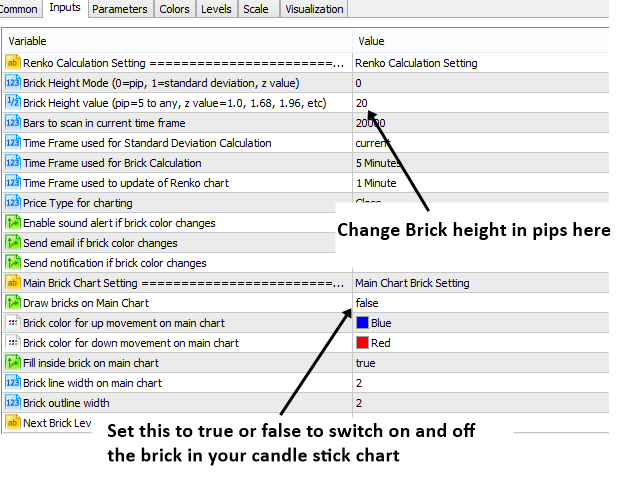
- Bei Brick Height Mode = 1 verwendet Smart Renko die Standardabweichung zur automatischen Berechnung der Brick-Höhe. Verwenden Sie den üblichen Z-Wert wie 1.0, 1.68, 1.96, etc. für einen profitablen Handel.
- Bei Brick Height Mode = 0 können Sie eine beliebige Brick Height in Pips eingeben. Smart Renko wird Ihre Eingaben verwenden, um den Renko Chart zu erstellen.
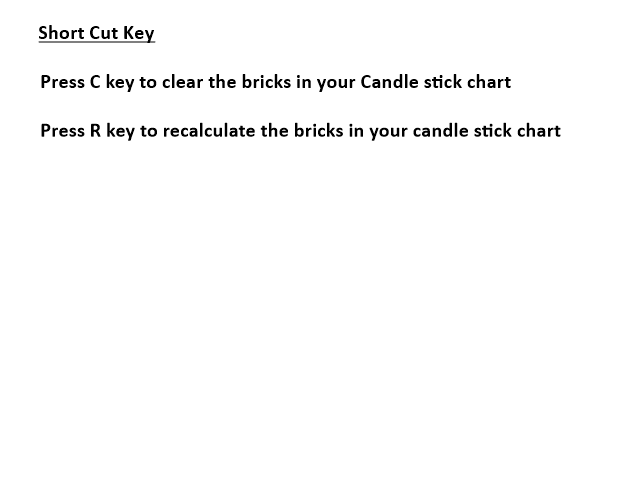
- Drücken Sie die Taste R auf Ihrer Tastatur, wenn Smart Renko beim Start nicht automatisch geladen wird. Dies geschieht aufgrund des anfänglichen Ladens der Daten auf einem Sub-Timeframe (M1, M5, etc.) des aktuellen Timeframes.
- Smart Renko verwendet den Sub-Timeframe (M1 oder M5) für die Berechnung der Bricks und zeigt die Bricks im aktuellen Timeframe an. Verwenden Sie keine Wochen- oder Monatscharts. Der M1- oder M5-Zeitrahmen verfügt meist nicht über ausreichende Daten, um Renko-Brick im Wochen- und Monatschart zu zeichnen.
Handelsstrategie-Leitfaden
Sie können Smart Renko zusammen mit einer der folgenden technischen Analysen verwenden.
Leitfaden für die Volumen-Spread-Analyse
Leitfaden für Harmonic Pattern Detection Indikator
Leitfaden für den Momentum-Indikator
Leitfaden für den Angebots-Nachfrage-Indikator
Leitfaden für Dreieck-Muster, fallende Keil-Muster, steigende Keil-Muster und Kanäle
Leitfaden für den Elliott-Wellen-Indikator
Wichtiger Hinweis
Dies ist ein Produkt von der Stange. Daher akzeptieren wir keine Änderungen oder Anpassungswünsche für dieses Produkt. Darüber hinaus bieten wir keine Code-Bibliothek oder Unterstützung für Ihre Codierung für dieses Produkt.