Trend Bands 5
- Indikatoren
- Version: 4.2
- Aktualisiert: 20 November 2021
- Aktivierungen: 5

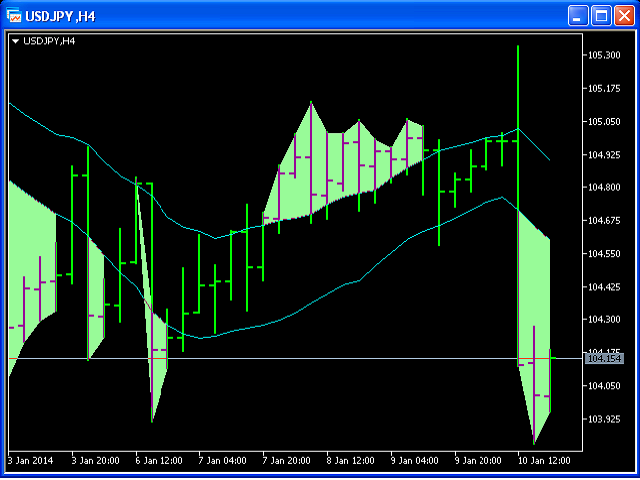
Bänder sind eine Form der technischen Analyse, die Händler verwenden, um Trendlinien zu zeichnen, die zwei Standardabweichungen vom einfachen gleitenden Durchschnittspreis eines Wertpapiers entfernt sind. Ziel ist es, dem Händler zu helfen, zu erkennen, wann er in eine Position ein- oder aussteigen sollte, indem er feststellt, wann ein Vermögenswert überkauft oder überverkauft ist.
Dieser Indikator zeigt obere und untere Bänder an. Sie können die Eingabeparameter nPeriod und nMethod ändern, um diese Bänder für jeden Zeitrahmen zu berechnen.
Aqua-Wolken zeigen Auf- oder Abwärtstrends an.