Inside bar api
- Indikatoren
- Version: 1.0
- Aktivierungen: 5

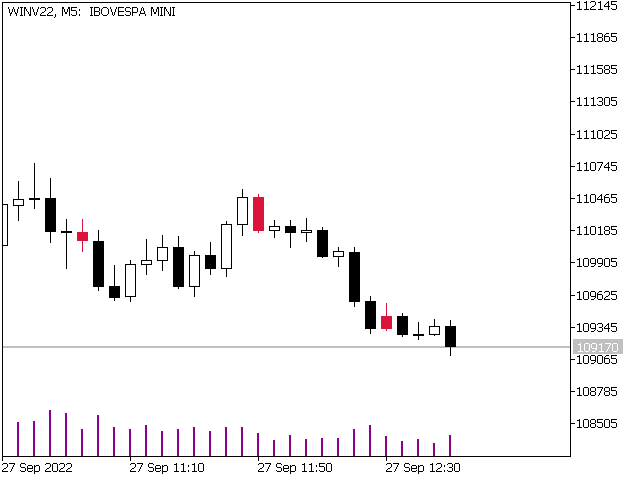
Ein Inside Bar ist eines der wichtigsten Zeichen für die Kontinuität eines bestehenden Trends und manchmal auch für eine Trendwende, da er uns besondere Einstiegspunkte zeigt, die ein gutes Risiko-Ertrags-Verhältnis ermöglichen.
Es ist einfach, sich eine Inside Candle vorzustellen.
Dieses Muster setzt sich aus nur zwei Kerzen zusammen.
Die erste Kerze sollte vorzugsweise groß sein, und die zweite Kerze sollte vollständig innerhalb des Hochs und Tiefs der ersten Kerze enthalten sein.