Bollinger colorido
- Indikatoren
- Version: 1.0

Es funktioniert wie normale Bollinger Bänder.
Es wurde von Joe Ross entwickelt und ist ein Setup mit höherem Risiko, da es gegen den Trend gerichtet ist. Es kann für Day Trade, Swing Trade und Position verwendet werden. Um es zu identifizieren, müssen Sie die Bollinger-Bänder mit einem einfachen gleitenden 20-Perioden-Durchschnitt und einer Breite (Abweichung) von 2 in das Diagramm einfügen.
Eine bestimmte Kerze schließt unterhalb des unteren Bollinger-Bandes. Wenn die nächste Kerze innerhalb der Bänder schließt, markieren Sie ihr Hoch. Der Bruch dieses Hochs löst den Handel aus, und der STOPP liegt beim unteren Tiefpunkt der beiden Kerzen (der Kerze, die außerhalb der Bänder geschlossen hat, und der Kerze, die innerhalb der Bänder geschlossen hat).
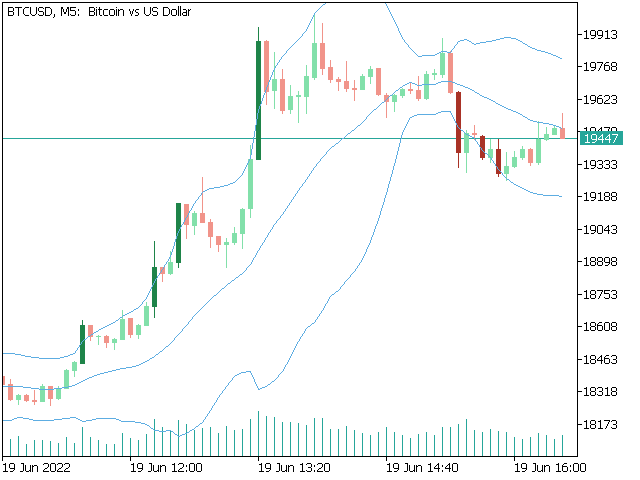
Die Idee des Indikators ist es, die Farbe zu wechseln, sobald die Kerze außerhalb des Bandes schließt;
Wenn der Schlusskurs über dem oberen Band liegt, färbt er die Kerze grün,
Wenn der Schlusskurs unter dem unterenBand liegt, färbt er die Kerze rot,
✔Die Kurse sind weit von der Mittellinie der Bänder entfernt;
✔ Die Umkehrkerze liegt größtenteils außerhalb der Bollinger Bänder (z.B. ein Hammer, bei dem der Schatten der Kerze außerhalb der Bänder und der Körper innerhalb der Bänder liegt);
✔ Wenn die Umkehrkerze von einem guten Volumen begleitet wird.
Quelle: https: //www.investimentonabolsa.com/2014/11/setup-fechou-fora-fechou-dentro-bandas.html

great stuff thank you