Inside bar api
- Indicadores
- Versión: 1.0
- Activaciones: 5

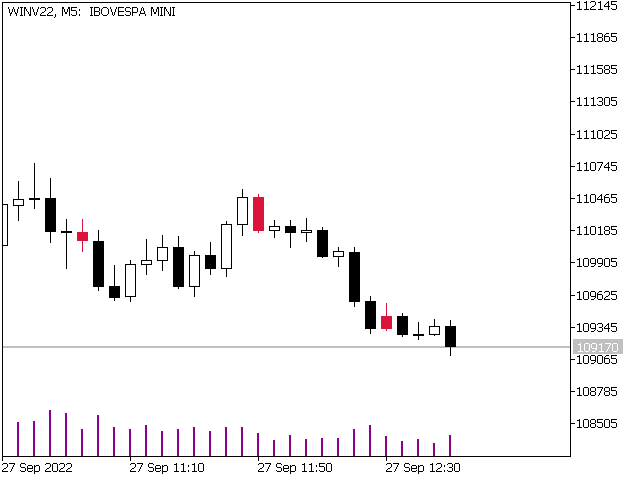
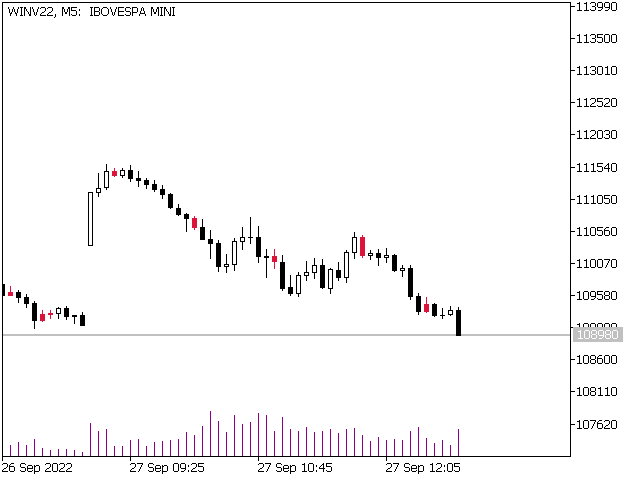
Una Inside Bar es una de las principales señales de continuidad en una tendencia existente, y a veces de inversión, ya que nos muestra puntos de entrada especiales, permitiendo una buena relación riesgo/recompensa.
Es sencillo visualizar una Inside Candle.
Este patrón se compone de sólo dos velas.
La primera debe ser preferiblemente grande, y la segunda debe estar totalmente contenida dentro del máximo y el mínimo de la primera.