Good Filtr

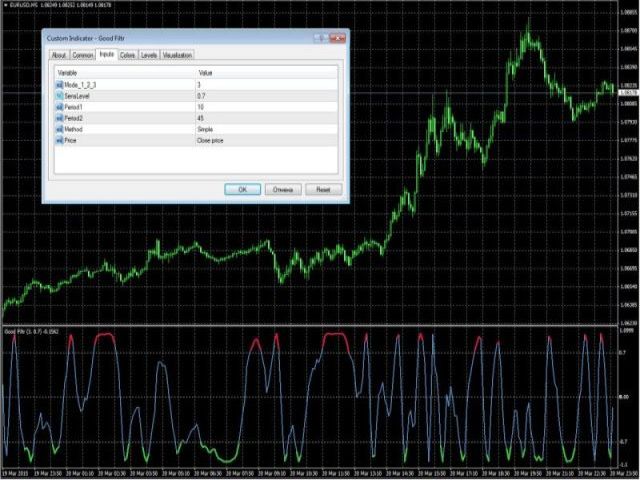
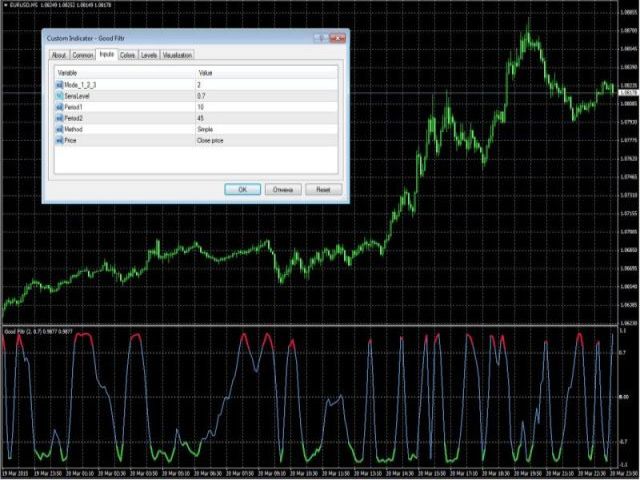
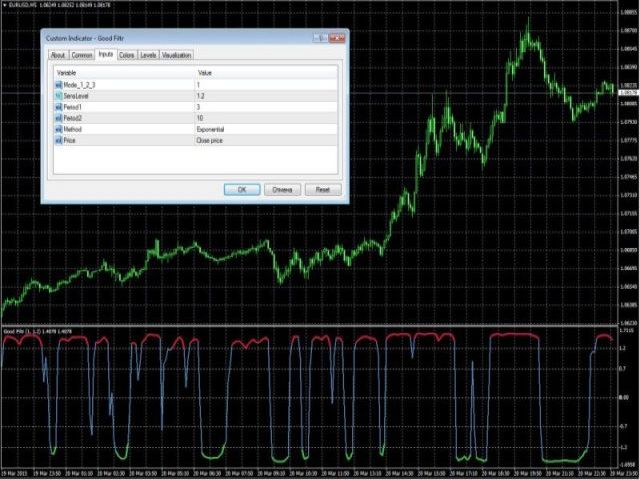
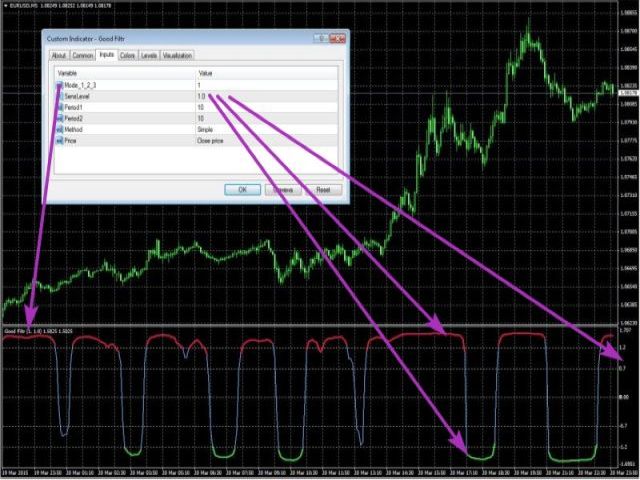
This is an indicator for additional signal filtering.

It can be used as an additional filter in a trading system.

The indicator does not redraw its data and can be used both in forex trading and with binary options.

It has 3 operation modes and flexible sensitivity settings.

The indicator uses multiple buffers, therefore it can be easily used in various Expert Advisors.

推荐产品
Advanced CRT Indicator MT4 — Candle Range Theory Tool Advanced CRT Indicator MT4 is a professional analysis tool that automates Candle Range Theory. It identifies consolidation ranges, breakout levels, Fair Value Gaps (FVG), and profit targets, with a real-time dashboard and alerts. Overview - Multi-timeframe candle range detection   - Automatic breakout levels with buffer settings   - Fair Value Gap identification and tracking   - Up to three customizable target levels (Risk:Reward ratios)  
The indicator shows entry points with Risk-Reward-Ratio 1 to 5. Main timeframe H1. Works on every pair. The main logic - is to find a reversal level, and then track the price reaction to this level. Doesn't need any settings. As a standard, it paint 5 levels of the same take-profit (red / blue for sellers and buys) and 1 stop-loss level - orange. ATTENTION! The full version of indicator. You can t est full work of indicator free only on the USDCAD pair here  https://www.mql5.com/en/market/produ
RaysFX Candlestick Signals RaysFX Candlestick Signals è un potente strumento progettato per migliorare la tua esperienza di trading su MT4. Questo indicatore personalizzato è stato sviluppato con l’obiettivo di fornire segnali di trading precisi e tempestivi basati su specifiche configurazioni di candele e l’indicatore RSI. Caratteristiche principali : Segnali di acquisto e vendita : L’indicatore genera segnali di acquisto e vendita basati su specifiche configurazioni di candele e valori dell’i
Dear traders, here is my other tool called the "Market Makers Trend Index".   The Market Makers Trend Index is created for the purpose of helping majority of traders to analyse the market direction in an easy way. This indicator is for serious traders who are eager to add edging tools to their trading arsenal. What are you waiting for just grab your copy today and amake a difference.  WHY THIS TOOL This indicator help traders analyse the trend direction and trading signals with precision and eff
Trade Direction
Gevorg Hakobyan
5 (1)
The oscillator shows trend direction using its own algorithm, which is based on calculating price values ​​by analyzing prices of separate currencies (original valuation of currencies). The histogram shows the average value of physical price change over the selected period. When the histogram has a positive value, the trend is rising, if negative - the trend id falling. The indicator uses standard RSI to determine the current market direction on a selected period as follows: the default value of
PipMaster is built using a powerful trend + momentum following algorithm. Made after years of testing and with market noise filtering built-in.  Aggressive traders can enter a trade as soon as an arrow appear. Conservative traders should wait for a visual alert after a closed candle bar. This indicator is a great tool to be used with your most trusted trend/momentum trading strategy and with solid money management rules. Key Benefits: -Super easy to use by following color coded arrow pointing t
Median Renko Terminator
Lesedi Oliver Seilane
Median Renko Terminator works best with renko charts if you do not have a renko chart generator I will email it to you for free and give you the correct settings for scalping or to swing trade NON-REPAINT  COMES WITH ALERTS WHEN THERE IS A SIGNAL Conditions to sell: big purple arrow shows you the direction first then you take the small purple arrow to enter the same direction of the purple arrow. Conditions to buy: big white arrow shows you the up direction first then you take small white arrow
Renko Bars 3in1
Yuriy Shatsckiy
5 (2)
The Renko_Bars_3in1 is designed for plotting 3 types of Offline Renko charts. Standard Renko Bar (the reversal bar is twice the size of the bar). Renko Range Bar (the size of all bars is the same). Renko Bars with the ability to adjust the size of the reversal bar. Attention : The demo version for review and testing can be downloaded here . Note . A chart with the M1 period is necessary to build an offline chart. When the indicator is attached to a chart, the offline chart is opened automaticall
Identify Take
Oleksii Ferbei
4.5 (2)
Identify Take - trend trading strategy, market noise filtering and all necessary functions built into one tool! The system itself shows in the form of arrows when to buy and when to sell. Uses only one setting parameter. Simple, visual and effective trend detection. The intelligent algorithm of the Identify Take indicator shows the points of a potential market reversal. Most often, a good trend can be seen visually on the price chart. But an experienced trader must clearly understand the curre
RenkoZigZag
Sergey Deev
The indicator displays Renko bars on the chart and uses them to plot the ZigZag - trend lines connecting the local Lows and Highs of the price movement. Renko - specialized display of the price action, in which the graph is displayed not every bar of the time frame, but only under the condition that the price had passed more than the specified number of points. Renko bars are not bound to a time frame, so the indicator can work on any time frame with the same efficiency. This implementation of t
RenkoMaPriceChannel
Sergey Deev
1 (1)
The indicator displays Renko bars on the chart, uses their data to calculate and display the moving average, PriceChannel and generates buy/sell signals. Renko is a non-trivial price display method. Instead of displaying each bar within a time interval, only the bars where the price moved a certain number of points are shown. Renko bars do not depend on a time interval, therefore the indicator works on any timeframe without losing its efficiency. The PriceChannel indicator displays the upper, lo
RENKOincrease
Jia Jie Tian
极大的提升了交易感官,一目了然的走势展示,简洁高效。 极大的突出展示了行情的趋势脉络,跟随时间周期适应变化,替用户交易者研判了行情走势,简洁高效 同时我们还提供了主窗口和副窗口的展现,有需要可以联系我作者本人,感谢支持。 像传统的renko,又不是传统的renko,技术在发展,同样的砖图可以有不一样的绘制和计算展现。 希望可以帮到大家的交易,再次感谢。 极大的提升了交易感官,一目了然的走势展示,简洁高效。 极大的突出展示了行情的趋势脉络,跟随时间周期适应变化,替用户交易者研判了行情走势,简洁高效 同时我们还提供了主窗口和副窗口的展现,有需要可以联系我作者本人,感谢支持。 像传统的renko,又不是传统的renko,技术在发展,同样的砖图可以有不一样的绘制和计算展现。 希望可以帮到大家的交易,再次感谢。
RaysFX Candlestick Exit  Il RaysFX Candlestick Exit è un indicatore di trading avanzato progettato per i trader che desiderano avere un controllo preciso sulle loro uscite di trading. Questo indicatore utilizza una combinazione di tecniche di trading per fornire segnali di uscita accurati e tempestivi. Caratteristiche principali: Range : Questo parametro consente di impostare il range di candele considerate per il calcolo dell’indicatore. Shift : Questo parametro consente di spostare l’indicator
History Pattern Search
Yevhenii Levchenko
该指标建立当前报价,可以与历史报价进行比较,并在此基础上进行价格走势预测。指示器有一个文本字段,用于快速导航到所需日期。 选项: 符号 - 选择指标将显示的符号; SymbolPeriod - 选择指标从中获取数据的时段; IndicatorColor - 指示器颜色; HorisontalShift - 由指标绘制的报价移动指定的柱数; Inverse - true 反转引号,false - 原始视图; ChartVerticalShiftStep - 图表垂直移动(键盘上的向上/向下箭头); 接下来是文本字段的设置,您可以在其中输入日期,您可以通过按“回车”立即跳转到该日期。 接下来是文本字段的设置,您可以在其中输入日期,您可以通过按“回车”立即跳转到该日期。
TradingDesk
Christian Weilinger
4 (1)
TradingDesk – Performance Analyse MT4 To test the indicator download free Demo version here: https://www.mql5.com/en/market/product/40471 TradingDesk analysed MetaTrader 4 historical data by Symbol, Magic Number, Trade or Comment. All these evaluations will be displayed in real time on your MetaTrader 4 chart window. All this information will be displayed in the following dashboards: account info General information about the account is displayed in the account info dashboard. performance inf
威廉姆斯分形追踪止损是一个专业的交易工具,结合了比尔威廉姆斯分形分析的原则和自适应追踪止损机制。 该指标提供了进入交易和最小化市场风险的时刻的准确定义。 系统自动识别图表上的分形结构,并计算移动止损单的最佳水平。 这使您可以保护利润并限制损失。 该指标不断分析市场动态,并根据价格结构的变化调整止损水平。 你得到一个专业的风险管理工具,并进入一个交易的实时. 分形的复杂数学计算已转化为可理解的图形信号。 不需要深入研究理论-该系统为资本保护和进入交易提供了现成的解决方案。 该指标识别关键的分形水平,并将其用作设置动态停止顺序的基准。 当达到新的极端时,系统会自动移动停止水平。 威廉姆斯分形追踪止损将复杂的分形分析技术转化为日常交易的实用工具,为任何培训水平的交易者提供专业的风险管理。 用威廉姆斯分形追踪止损指标确定交易的入口点。 推送通知是在信号出现时实现的,因此您将始终了解有关新信号出现的事件。 购买指标后,通过Telegram写信给我以接收设置文件。 t.me/j32056 最佳工具:任何 最佳时间范围: М5, H1 使用附加因素进入趋势,以
Matrixs
Andriy Sydoruk
Matrix is a Forex arrow indicator. Displays signals simply and clearly! The arrows show the direction of the transaction, and are colored accordingly, which can be seen in the screenshots. As you can see, trading with such an indicator is easy. I waited for an arrow to appear in the desired direction - I opened a deal. An arrow formed in the opposite direction - closed the deal. The indicator also displays the lines with the help of which the arrow signals are formed, taking into account the int
Trade with Gann on your side!! MASTER CIRCLE 360 CIRCLE CHART, originally created by Gann admitted that this is “The Mother of all charts”. It is one of the last studies that this great trader left for us. The numeric tab le is apparently quite simple like all the tables and is based on square numbers, the SQUARE OF 12 and is by evolution, one of the most important square numbers. Here we can find CYCLE, PRICE AND TIME thanks to angles and grades, to show past and future support and resistance.
Price Elevator MT4
Innovicient Limited
The Price Elevator indicator is developed to help you figure out the general long-term trend of the market. If the price is above the Green separator line, this is a clear indication the bulls are in control. Similarly, the bears are in control if the price continues to trend below the red separator line.   Download Price Elevator MT5   Trend Re-entry In this case you would plan your buy entries above the green dotted box (make sure to set the Buy / Sell Retracement Floor=30). The SL should be
Levels price
Levi Kevin Midiwo
Levels price is a mt4 indicator that shows various levels to enter the market based on indicator calculations. The indicator consists of the following buffers; Red buffer Blue buffer Purple buffer The blue buffer is the resistance level where price is expected to bounce back.  The red buffer is the support level based on the current market price. There is also a purple buffer below red buffer that can indicate the current support and resistance levels have been breached when price crosses this p
"Bitcoin indicator" is a ready-made mechanical trading system for Bitcoin. The system is implemented as an indicator that shows the trader on the chart the price reversal points and the current trend direction. This information is enough to effectively trade in the market. The "Bitcoin indicator" consists of a complex analytical block that constantly analyzes the market and shows the trader where the trend is heading. The indicator also shows with dots on the chart, the price reversal points. S
Renko Trade Alarm
Miroslaw Stachowiak
5 (1)
Renko Trade Alarm   is designed to work on chart with Renko and Mean Renko candles. It generate B uy and S ell signals on the chart and send notifications. Visualization of signals: Swing  - Formations 123. Pattern  - Double Bottom, Double Top, Triple Bottom, Triple Top, Formations 123 Reverse. Scalp  - Periodic change in the price direction, plus additional filters in the form of oscillators Stochastic  and  MACD. Ichi  - Signals filtered by the Ichimoku indicator. For correct operation an offl
Delta Fusion Pro
Francesco Secchi
5 (2)
Delta Fusion Pro – 高级订单流分析,专为日内交易设计 Delta Fusion Pro 是一款专业的 MetaTrader 4 指标,能够揭示市场中的主动订单流,实时显示机构压力的强度和方向。与传统的成交量指标不同,它分析买盘(Ask)与卖盘(Bid)之间的成交量差值(Delta),用于提前预测反转、确认趋势并识别专业兴趣区域。 主要特点 智能自动调节系统 根据以下条件自动调整所有参数: 交易品种类型(外汇、加密货币、指数、大宗商品、股票) 操作周期 市场波动率(ATR) 最近平均成交量 无需手动配置,适合新手交易者——指标自动完成校准! 核心功能 净Delta与累计Delta 计算主动买盘/卖盘成交量差值,支持自定义 EMA 平滑 实时显示方向性压力 可自定义直方图颜色(买入/卖出) 价格/成交量背离 自动检测常规与隐藏背离 强度分类:强/中/弱 高级过滤:成交量确认、趋势、时间距离 图形信号(彩色箭头) 市场失衡 识别显著的买盘/卖盘比例失衡(可配置比率) 最小成交量阈值验证 图表显示彩色点(多头/空头) Infusion Volume 检测异常成交量峰值(
Overview Harmonic Patterns MT4 is a technical analysis indicator designed for the MetaTrader 5 platform. It identifies and displays harmonic price patterns, such as Butterfly, Cypher, Crab, Bat, Shark, and Gartley, in both bullish and bearish directions. The indicator calculates key price levels, including entry, stop loss, and three take-profit levels, to assist traders in analyzing market movements. Visual elements and customizable alerts enhance usability on the chart. Features Detects six ha
Cyberosaur Ex
Maryna Shulzhenko
The     Cyberosaurus  bot is an innovative next-generation bot that serves as a powerful tool for trading in the classic Forex market and with cryptocurrencies (for corresponding brokers). It operates with the majority of pairs, so it is advisable to test it before using it on a specific pair. It is specifically designed to work with these markets, without the ability to trade other assets such as stocks or indices. The main control parameters of the bot are presented in a convenient and conci
UTBot with HTS filter
Bartlomiej Tadeusz Tomaja
Advanced UT Bot & HTS Indicator This indicator is an advanced technical analysis tool that combines two methods: UT Bot and HTS (Higher Timeframe Smoothing) , to generate accurate buy and sell signals. 1. Indicator Structure Works within the main chart window and utilizes 11 buffers to store various data points, including arrows (buy/sell signals) and bands from both UT Bot and HTS systems. Uses colored arrows to represent different trading conditions: Blue arrows : Normal buy signals. Red arro
Fourteen plus nine TD Sequential
MOHAMMED IMAD HUSSEIN BASSEE
Fourteen plus nine What is it for? Applying Tom DeMark’s TD Sequential serves the purpose of identifying a price point where an uptrend or a downtrend exhausts itself and reverses. . What are the main components of TD Sequential? TD Sequential has two parts – TD Setup and TD Countdown. The first phase of TD Sequential starts with a TD Setup and is completed with a 9 count. When the 9 count is completed, it is at that point, a price pause, price pullback, or reversal is likely. It is also at tha
Skalpex
Andrey Kozak
Skalpex is a system indicator for wave diagnostic analysis of the early phases of a market condition. The indicator lags exactly 1 bar. It shows the exact price reversals, does not redraw its values, but is 1 bar late. This is due to the fact that the last (zero bar) has not yet been formed before closing, which means that no one ever knows where it will go exactly and where it will close. We can assume. In order not to try to play fortune-telling, the Skalpex indicator is late by one candle an
Trend Sync
Pavel Verveyko
5 (1)
The indicator shows the trend of 3 timeframes: higher timeframe; medium timeframe; smaller (current) timeframe, where the indicator is running. The indicator should be launched on a chart with a timeframe smaller than the higher and medium ones. The idea is to use the trend strength when opening positions. Combination of 3 timeframes (smaller, medium, higher) allows the trend to be followed at all levels of the instrument. The higher timeframes are used for calculations. Therefore, sudden change
The Pure Price Action ICT Tools indicator is designed for pure price action analysis, automatically identifying real-time market structures, liquidity levels, order & breaker blocks, and liquidity voids. Its unique feature lies in its exclusive reliance on price patterns, without being constrained by any user-defined inputs, ensuring a robust and objective analysis of market dynamics. Key Features Market Structures A Market Structure Shift, also known as a Change of Character (CHoCH), is a pivot
该产品的买家也购买
Scalper Inside PRO
Alexey Minkov
4.74 (69)
An exclusive indicator that utilizes an innovative algorithm to swiftly and accurately determine the market trend. The indicator automatically calculates opening, closing, and profit levels, providing detailed trading statistics. With these features, you can choose the most appropriate trading instrument for the current market conditions. Additionally, you can easily integrate your own arrow indicators into Scalper Inside Pro to quickly evaluate their statistics and profitability. Scalper Inside
Gann Made Easy
Oleg Rodin
4.83 (156)
Gann Made Easy 是一个专业且易于使用的外汇交易系统,它基于使用先生理论的最佳交易原则。 W.D.江恩。该指标提供准确的买入和卖出信号,包括止损和获利水平。您甚至可以使用推送通知在旅途中进行交易。 购买后请联系我,即可免费获得交易指导和超棒的额外指标! 您可能已经多次听说过江恩交易方法。通常 Gann 的理论不仅对于新手交易者而且对于那些已经有一定交易经验的人来说都是非常复杂的东西。这是因为江恩的交易方法在理论上并不那么容易应用。我花了几年时间来完善这些知识,并将最好的原则应用到我的外汇指标中。 该指标非常易于应用。您所需要的只是将其附加到您的图表并遵循简单的交易建议。该指标不断进行市场分析工作并寻找交易机会。当它检测到一个好的入口点时,它会为您提供一个箭头信号。该指标还显示止损和获利水平。 换句话说,当您像先生一样进行交易时,该指标会为您提供最佳江恩建议。江恩亲自告诉你此时此刻该做什么。但最好的部分是您不需要了解任何有关江恩交易原则的知识,因为该指标会为您完成整个市场分析工作。
Linear Trend Predictor — 结合切入点和方向支撑线的趋势指标。按照突破高/低价通道的原理运作。该指标算法过滤市场噪音,考虑波动性和市场动态。 指示器功能  使用平滑方法,显示市场趋势和开立买入或卖出订单的切入点。  适合通过分析任何时间范围内的图表来确定短期和长期的市场走势。  输入参数可适应任何市场和时间范围,允许交易者独立定制指标。  设定的指示信号不会消失,也不会重新绘制——它是在蜡烛收盘时确定的。  几种类型的通知以箭头组合。  该指标既可以作为独立的交易系统使用,也可以作为其他交易系统的补充。  可供任何经验水平的交易者使用。 主要参数 Volatility Smoothing Level - 指标的主要参数,允许您配置指标以实现舒适的操作。 它的数字范围是 1 到 100,从而增加了您可以获得更长趋势运动的平滑度。 通过少量的数字,您可以获得短期走势并快速退出交易。 使用指标进行交易的时刻:  红线和箭头表示下降趋势和卖出开盘信号。止损应根据前一个上分形来设置。  黄线和箭头表示上升趋势和买入开盘信号。止损应根据前一个下分形来设置。
Dynamic Scalper System
Vitalyi Belyh
5 (1)
“ Dynamic Scalper System ”指标专为在趋势波内进行剥头皮交易而设计。 已在主要货币对和黄金上进行测试,并可与其他交易工具兼容。 提供顺势短线建仓信号,并提供额外的价格变动支持。 指标原理: 大箭头决定趋势方向。 在趋势波内,我们采用一种生成小箭头形式的剥头皮交易信号的算法。 红色箭头代表看涨方向,蓝色箭头代表看跌方向。 敏感的价格变动线会沿着趋势方向绘制,并与小箭头信号协同作用。 信号运作方式如下:当线在适当时刻出现时,将形成入场信号;在出现线时,持仓;线完成后,平仓。 建议的操作时间范围为M1 - H4。 箭头在当前K线上方形成,如果下一根K线已开仓,则不会重新绘制上一根K线上方的箭头。 输入参数 Trend Wave Period - 趋势方向(大箭头)的周期,改变趋势波的时间间隔。值 1 表示趋势方向的最长持续时间,参数值越大,持续时间越短。 Scalper Arrows Period - 信号箭头(小箭头)的计算周期,改变入场信号的生成频率。值 3 表示最频繁的生成频率,参数值越大,箭头频率越低,准确度越高。 这些参数可以根据不同的时间范
Atomic Analyst
Issam Kassas
5 (4)
首先值得强调的是,该交易指标是非重绘、非延迟的指标,这使其成为手动和机器人交易的理想选择。 用户手册:设置、输入和策略。 Atomic Analyst是一种PA价格行动指标,利用价格的力量和动量来寻找市场上更好的机会。配备了高级过滤器,可帮助去除噪音和假信号,并提高交易潜力。使用多层复杂的指标,Atomic Analyst扫描图表,并将复杂的数学计算转化为任何初学者都能理解并用来做出一致交易决策的简单信号和颜色。 “Atomic Analyst”是专为新手和经验丰富的交易者量身定制的综合交易解决方案。它将高级指标和一流功能融合为一体的交易策略,使其成为所有类型交易者的多功能选择。 日内交易和剥头皮策略:专为快速准确的日内交易和短期交易而设计。 日内和摆动交易策略:可用作追求价格大幅波动的日内和摆动交易者的可靠工具。 多货币和市场:凭借其可靠的精度,在不同的工具和市场上运作。 多个时间框架:可在多个时间框架上使用,性能良好。 稳定性:所有指标均不重绘、不重绘和不滞后,确保可靠的信号。 信号清晰度:提供箭头信号,用于清晰的入场和出场点。 实时警报:通过交易入场、SL和TP警报通知交易者
Trend Lines PRO
Roman Podpora
5 (1)
TREND LINES PRO 帮助您了解市场真正的方向转变点。该指标显示真实的趋势反转点以及主要参与者重新入场的时机。 您可以看到 BOS线、 趋势变化和更高时间框架的关键水平——无需复杂的设置或不必要的干扰。信号不会重绘,并在K线收盘后仍然保留在图表上。 VERSION MT 5    -   与……搭配使用时,可发挥其最大潜力   RFI LEVELS PRO 指示器 该指标显示的内容: 实际变化 趋势(BOS 线) 一旦信号出现,它就始终有效!这与会重绘的指标有着重要的区别,后者可能会发出信号后又改变信号,从而导致资金损失。现在,您可以更精准、更准确地进入市场。此外,还有一个功能,会在箭头出现后为K线着色,直到达到目标价位(止盈)或出现反转信号为止。 重复条目   以及主要玩家的充值 为了提高寻找入场点时的视觉清晰度,我们创建了一个模块,该模块首先显示买入/卖出区域,并在该区域内寻找最佳入场点。此外,我们还加入了智能逻辑来管理止损位,该逻辑会随着时间的推移逐步降低止损位的大小,从而降低入场交易时的初始风险(移动止损位)。 信号强度水平(BOS) 该指标采用三个显著性等级来衡量
NAM Order Blocks
NAM TECH GROUP, CORP.
3.67 (3)
MT4多時限訂單塊檢測指示器。 特徵 -在圖表控制面板上完全可自定義,提供完整的交互。 -隨時隨地隱藏和顯示控制面板。 -在多個時間範圍內檢測OB。 -選擇要顯示的OB數量。 -不同的OB用戶界面。 -OB上的不同過濾器。 -OB接近警報。 -ADR高低線。 -通知服務(屏幕警報|推送通知)。 概括 訂單塊是一種市場行為,它指示從金融機構和銀行收取訂單。著名的金融機構和中央銀行帶動了外匯市場。因此,交易者必須知道他們在市場上正在做什麼。當市場建立訂單塊時,它會像發生大多數投資決策的範圍一樣移動。 訂單建立完成後,市場將朝著上升和縮小的方向發展。訂單大宗交易策略的關鍵術語是它包括機構交易者正在做的事情。由於它們是主要的價格驅動因素,因此包括機構交易在內的任何策略都可以。 您將在任何時間範圍內實時看到訂單塊,使用我們的控制面板,您將能夠在所選的歷史記錄週期內檢測常規,拒收和未大寫的訂單塊。 現在您可以接收到訂單塊接近警報,我們在MT4上顯示屏幕通知,並將通知推送到您的手機!
GOLD Impulse with Alert
Bernhard Schweigert
4.67 (12)
这个指标是我们2个产品 Advanced Currency IMPULSE with ALERT  +   Currency Strength Exotics 的一个超级组合。 它适用于所有时间框架,并以图形方式显示8种主要货币和一种符号的强势或弱势冲动! 该指标专门用于显示任何符号的货币强度加速,如黄金、异国货币对、商品、指数或期货。这是它的第一个指标,任何符号都可以被添加到第9行,以显示黄金、白银、石油、DAX、US30、MXN、TRY、CNH等的真实货币强度加速(冲动或速度)。 建立在新的基础算法上,它使识别和确认潜在的交易更加容易。这是因为它以图形方式显示了一种货币的强势或弱势是否正在加速,并测量了这种加速的速度--把它想象成你汽车中的速度表。当你加速时,事情显然会发生得更快,这在外汇市场上也是一样的,即如果你配对的货币正在向相反的方向加速,你就会发现一个潜在的有利可图的交易。 动态市场斐波那契28水平被用作警报触发器,将适应市场活动。如果冲动击中黄色触发线,你将收到警报。然后你就知道作为一个交易员应该做什么。货币对和方向已经给出。只需点击警报按钮,就可以切换到该货
MTF Supply Demand Zones
Georgios Kalomoiropoulos
4.82 (22)
下一代自动化供需区。适用于任何图表的创新算法。所有区域都是根据市场的价格行为动态创建的。 两种类型的警报 --> 1) 当价格触及区域时 2) 当新区域形成时 你不会再得到一个无用的指标。您将获得一个完整的交易策略和经过验证的结果。     新的功能:     价格触及供需区时发出警报     创建新的供应/需求区时发出警报     推送通知警报     以点为单位的区域宽度标签     关于 MTF 的又一个时间表。因此,现在您将能够看到高于当前 3 个时间帧,而不是高于当前 2 个时间帧     启用/禁用警报/区域/MTF 功能的按钮 您获得的优势:     消除交易中的情绪。     客观化您的交易条目。     通过高概率设置提高您的利润。     节省绘图区域的时间。     像专业人士一样交易金融市场。     任何市场的即时多时间框架分析。 你在图表上看到了什么?     蓝色和红色矩形是当前时间范围的供需区。     虚线样式线是当前上方第一个时间范围内的供需区域。     实线样式线是当前上方第二个时间范围内的
Currency Strength Exotics
Bernhard Schweigert
4.88 (33)
目前8折优惠! 对任何新手或专家交易者来说都是最好的解决方案! 这个指标是专门用来显示任何符号的货币强度,如异国货币对、商品、指数或期货。它是同类产品中的第一个,任何符号都可以添加到第9行,以显示黄金、白银、石油、DAX、US30、MXN、TRY、CNH等的真实货币强度。这是一个独特的、高质量的、负担得起的交易工具,因为我们已经纳入了一些专有的功能和一个新的公式。想象一下,你的交易将如何改善,因为你能够准确地确定新趋势或剥头皮机会的触发点? 用户手册:点击这里   https://www.mql5.com/en/blogs/post/708876 它适用于所有时间框架。你将很快能够看到TREND! 根据新的基础算法设计,它使识别和确认潜在交易变得更加容易。这是因为它以图形方式显示了8种主要货币和一种符号的强弱。 该指标显示了8种主要货币(澳元加元瑞士法郎欧元英镑日元新西兰美元)的强弱线,再加上一个符号! 该指标显示了符号的真实价值。例如:对于XAUUSD(黄金):价格以美元报价。如果黄金在上涨,你怎么能知道是黄金的强势还是美元的弱势?只有当黄金走强时,我们才会进行交易。该指
MetaForecast M4
Vahidreza Heidar Gholami
5 (2)
MetaForecast能够根据价格数据中的谐波来预测和可视化任何市场的未来走势。虽然市场不总是可预测的,但如果价格中存在模式,MetaForecast可以尽可能准确地预测未来。与其他类似产品相比,MetaForecast通过分析市场趋势可以生成更精确的结果。 输入参数 Past size (过去的尺寸) 指定MetaForecast用于创建生成未来预测模型的柱数量。该模型以一条黄色线绘制在所选柱上。 Future size (未来的尺寸) 指定应预测的未来柱数量。预测的未来以粉色线表示,并在其上绘制了蓝色回归线。 Degree (程度) 此输入确定了MetaForecast将在市场上进行的分析级别。 Degree 描述  0 对于程度0,建议使用较大的值来设置“过去的尺寸”输入,以覆盖价格中的所有高峰、低谷和细节。  1 (建议的) 对于程度1,MetaForecast可以理解趋势,并通过较小的“过去的尺寸”生成更好的结果。  2 对于程度2,除了趋势,MetaForecast还可以识别反转点。对于大于1的程度,必须使用较高的“细节”和“噪音减少”输入值。  大于2 不建议使用大于
Super Reversal Indicator with Alert 概述 Super Reversal Indicator with Alert 是一款多时间周期交易工具,旨在通过结合随机指标动量、供需区域以及价格反转信号,帮助交易者识别高概率的市场反转机会。 该指标通过清晰的视觉信号和实时提醒,帮助交易者发现潜在的市场转折点。 核心功能 多时间周期随机指标分析 使用来自更高时间周期的随机振荡器(用户可自定义) 识别动量变化和交叉信号 包含超买和超卖水平,帮助实现更精准的入场 反转拒绝信号 检测关键价位上的强烈拒绝形态 识别以下位置的反转 日内高点卖出反转 日内低点买入反转 在图表上直接绘制箭头,直观清晰 供需区域 自动绘制来自 H4 和 D1 时间周期的重要区域 标记 供应区(潜在卖出区域) 需求区(潜在买入区域) 区域会动态更新并延伸至图表 智能提醒系统 弹出提醒 声音提醒 手机推送通知 邮件提醒(可选) 提醒触发条件包括 随机指标信号 拒绝信号 价格进入区域 可视化信号 在图表上显示买入和卖出箭头 清晰标注反转条件 界面简洁,易于阅读 交易逻辑 该指标结合三大核心要素来识别反
Introducing the Delta Volume Profile Indicator - Unleash the Power of Institutional Precision!  Technical Indicator: Are you ready to trade like the pros? The Delta Volume Profile Indicator is no ordinary tool. It’s a high-precision, cutting-edge indicator that puts the power of institutional-grade trading in your hands. This unique indicator analyses delta volume distribution in real-time, revealing the market's hidden buy/sell imbalances that the biggest financial institutions rely on to antic
Order Block Hunter
Noha Mohamed Fathy Younes Badr
5 (10)
Order block hunter indicator is the best indicator for  hunt the order blocks that area where there has been a large concentration of limit orders waiting to be executed Order blocks are identified on a chart by observing previous price action and looking for areas where the price experienced significant movement or sudden changes in direction .This indicator does that for you by using very complicated codes and helps you to take the best areas To buy and sell because it make marks at the best a
Dynamic Forex28 Navigator
Bernhard Schweigert
4.43 (7)
Dynamic Forex28 Navigator - 下一代外汇交易工具。 当前 49% 折扣。 Dynamic Forex28 Navigator 是我们长期流行的指标的演变,将三种功能合二为一: 高级货币强度 28 指标 (695 条评论)+ 高级货币 IMPULSE 带警报 (520 条评论)+ CS28 组合信号(奖励)。 有关指标的详细信息 https://www.mql5.com/en/blogs/post/758844 下一代强度指标提供什么? 您喜欢的原始指标的一切,现在通过新功能和更高的精度进行了增强。 主要特点: 专有货币强度公式。  所有时间范围内的平滑和准确的强度线。 非常适合识别趋势和精确进入。 动态市场斐波那契水平(市场斐波那契)。  此指标独有的独特功能。 斐波那契应用于货币强度,而不是价格图表。 适应实时市场活动以获得准确的反转区域。 实时市场动量。  第 9 行显示市场是活跃还是被动。 对于定时交易至关重要。 全面的警报和显示。  每种货币最强的买入和卖出动量。 ​​28 对的双重动量买入和卖出。 超买/超卖警告外部范围和止损。 反转
Advanced Supply Demand
Bernhard Schweigert
4.91 (299)
现在优惠 40%! 任何新手或专业交易者的最佳解决方案! 该指标是一款独特、高质量、且价格合理的交易工具,因为我们已经整合了许多专有功能和新公式。 依据此更新,您将能够显示双重时间帧区域。 您不仅可以显示一个较高的时间帧,还可以同时显示图表时间帧,加上更高的时间帧:显示嵌套时区。 供需双方所有交易者都会喜欢它。 :) 重要信息披露 高级供需的最大潜力,请访问 https://www.mql5.com/zh/blogs/post/720245   想象您的交易如何得以改善,是因为您能够精准定位入场或目标位吗? 构建于新的底层算法,它可以更轻松地识别出买卖双方之间的潜在失衡。 这是因为它以图形方式展示供需最强劲区域,及其过去的表现(显示旧区域)。 这些功能旨在帮助您更轻松地发现最佳入场区域和价位。 现在您可以针对您的交易品种和时间帧来优化和编辑区域强度! 高级供需指标适用于所有产品和时间帧。 它是一个新的公式,非常新的功能是两个区域强度函数可由用户输入进行调整! 这在交易中是一大优势。 当您学习如何使用专有功能,例如带有价格游离最小 X 因子的区域强度时,您能够判断该区域强劲与否。 供需
RFI levels PRO
Roman Podpora
5 (1)
该指标能够准确显示反转点和价格回落区域。     行业领军人物 。您能洞察新趋势的形成,并以最高的精准度做出决策,掌控每一笔交易。 与……结合时,展现其最大潜力     趋势线专业版   指标  VERSION MT5 该指标显示的内容: 新趋势开始时的反转结构和反转水平及其激活。 显示屏   获利了结   和   止损   风险回报比最低的水平     RR 1:2       。 具有智能减值逻辑的止损。 显示指定指标中两种趋势类型的反转形态。 指标: 根据     趋势线     (全球趋势变化) 潮流专业版     (趋势快速变化) 简单有效   扫描器   实时趋势(新增)。 多时间框架工具筛选。 展示   利润   在 LOGIC AI 信号之后。 以下列出今日走势积极的金融工具。(RB键) 能够为终端启用通知(警报)功能,并向移动设备推送通知。 逻辑人工智能     — 利用人工智能寻找最佳切入点。 只有在启用 MTF(多时间框架分析)模式时,该功能才可用。 兼容性。 当与趋势线指标结合使用时,该指标能发挥其最大潜力。 这     RFI LEVELS PRO    
Adaptive Volatility Range
Stanislav Konin
5 (3)
Adaptive Volatility Range [AVR] is a powerful tool for identifying key trend reversal points. AVR accurately reflects the Average True Range (ATR) of volatility, taking into account the Volume-Weighted Average Price (VWAP). The indicator adapts to any market volatility by calculating the average volatility over a specific period, ensuring a stable rate of profitable trades. You receive not just an indicator but a professional automated trading system , AVR-EA . Advantages: Automated Trading Sys
TPSpro RFI Levels
Roman Podpora
4.86 (28)
俄语说明 /  英文 说明   -  MT5 版本 主要功能: 显示卖家和买家的活跃区域! 该指标显示所有正确的买入和卖出的初始脉冲水平/区域。当这些水平/区域被激活时,即开始寻找入场点的位置,水平线会改变颜色,并填充特定颜色。此外,还会显示箭头,以便更直观地了解情况。 LOGIC AI - 激活模板时显示用于搜索入口点的区域(圆圈) 为了提高视觉清晰度,添加了使用人工智能搜索入口点的显示区域的功能。 显示更高时间范围内的级别/区域(MTF 模式) 新增使用更高时间间隔显示级别/区域的功能。此外,该指标还具有自动趋势检测功能 (   TPSproTREND PRO   )。 独立的专业分步交易算法 该算法专为顺势和逆势的日内交易而设计。每个活动模板均提供详细的说明。 适用于不同的时间范围 TPSpro RFI 水平指标可用于图表上的任何时间间隔,从分钟(M1)到每月(MN)。 图形和声音警报 该指标提供图形和声音提示,让您不会错过交易信号。 此外,还支持手机通知。 简单有效的活性模板扫描器 这是一个非常紧凑的主动模式扫描仪,当在一个方向上的所有时间间隔内激活模式时,它会自动发出警报并
BTMM State Engine Pro MT4
Garry James Goodchild
BTMM State Engine Pro is a MetaTrader 4 indicator for traders who use the Beat The Market Maker approach: Asian session context, kill zone timing, level progression, peak formation detection, and a multi-pair scanner from a single chart. It combines cycle state logic with a built-in scanner dashboard so you do not need the same tool on many charts at once. What it does Draws the Asian session range; session times can follow broker server offset or be set in inputs. Tracks level progression (L
TrendLine PRO MT4
Evgenii Aksenov
4.83 (167)
Trend Line PRO   指标是一个独立的交易策略。 它显示趋势变化,交易的入口点,以及自动计算三个级别的止盈和止损保护 Trend Line PRO  非常适合所有元交易者符号:货币,金属,加密货币,股票和指数 该指标用于真实账户交易,这证实了该策略的可靠性 您可以在这里找到使用   Trend Line PRO   和真实信号的机器人:   https://robomarket.org/product-category/signals/ 目前,Trend Line PRO指标的售价为75美元。 促销后价格为 149 美元 。 趋势线专业的优点 永远不要重绘它的信号; 将其作为独立策略的可能性; 它有三个自动水平止盈和止损水平  该指标具有iCustom信号缓冲区,允许您基于它创建交易机器人 具有通知功能 该指标已证明其在真实账户交易中的有效性 如何设置和优化趋势线PRO指标: 通过更改幅度参数以及 TP 和 SL 水平,将重点放在指标面板上的利润上 您可以使用以下方式自动优化指标参数: Optimizer Utility 详细说明(ENG): 这里 趋势线PRO指标如
Currency Strength Wizard
Oleg Rodin
4.85 (59)
货币强度向导是一个非常强大的指标,为您提供成功交易的一体化解决方案。该指标使用多个时间范围内所有货币的数据来计算这个或那个外汇对的力量。此数据以易于使用的货币指数和货币电力线的形式表示,您可以使用它们来查看这种或那种货币的力量。 您所需要的只是将指标附加到您要交易的图表上,该指标将向您显示您交易的货币的真实强度。该指标还向您显示买卖量压力的极值,您可以在顺势交易时利用这些压力。该指标还显示了基于斐波那契的可能目标。该指标可用于各种交易时间范围。该指标支持各种货币对的交易。 该指标为您提供所有类型的警报,包括推送通知。 购买后请联系我。我将与您分享我的交易技巧,并免费为您提供丰厚的红利指标! 祝您交易愉快,获利丰厚!
Volatility Trend System - a trading system that gives signals for entries. The volatility system gives linear and point signals in the direction of the trend, as well as signals to exit it, without redrawing and delays. The trend indicator monitors the direction of the medium-term trend, shows the direction and its change. The signal indicator is based on changes in volatility and shows market entries. The indicator is equipped with several types of alerts. Can be applied to various trading ins
Buy Sell Arrow Swing MT4
Sahib Ul Ahsan
3 (2)
Looking for a powerful yet lightweight swing detector that accurately identifies market structure turning points? Want clear, reliable buy and sell signals that work across any timeframe and any instrument? Buy Sell Arrow MT Swing is built exactly for that — precision swing detection made simple and effective. This indicator identifies Higher Highs (HH) , Higher Lows (HL) , Lower Highs (LH) , and Lower Lows (LL) with remarkable clarity. It is designed to help traders easily visualize market stru
Trend indicator AI
Ramil Minniakhmetov
4.49 (84)
趋势人工智能指标是一个伟大的工具,将加强交易者的市场分析结合趋势识别与可操作的进入点和逆转警报。 该指标使用户能够自信和精确地驾驭外汇市场的复杂性 除了主要信号,趋势Ai指标识别在回调或回调期间出现的次要入口点,使交易者能够利用既定趋势内的价格修正。 重要优势: *MT4及MT5工程 *明确买入或卖出信号 ·不重绘 *适用于所有资产 小心我不卖EA或设置电报它骗局. 所有设置免费在这里的博客。  重要! 购买后立即与我联系,以获得指示和奖金! 真实的操作监控以及我的其他产品可以在这里找到: https://www.mql5.com/en/users/mechanic/seller&nbsp ; 设置和输入: 建议为所有资源设置默认设置。 第...
Auto Optimized Parabolic RSI: 高级 3D 动量引擎 大多数零售指标之所以失效,是因为它们依赖于静态输入,一旦市场波动率发生变化,这些输入就会崩溃。Auto Optimized Parabolic RSI 通过不断重新计算自身的数学优势,解决了“指标衰退”的问题,将机构级别的量化自适应能力直接引入您的 MT5 终端。 核心优势:定制的内存 3D 优化   标准的自动优化器通常会导致 MT5 平台卡顿,因为它们通过标准的指标调用使终端超载。该工具完全绕过了这些性能瓶颈。内部引擎采用定制的原生基于 RAM 的计算器构建,每次加载图表或更改时间周期时,它都会执行极速的 3D 网格搜索。它同时扫描 RSI 周期(频率)、SAR 步长(加速度)和 SAR 最大值(速度限制),在绝对的毫秒级时间内测试数以万计的参数组合,且完全不会拖慢您的平台。它不是仅仅寻找一个“不错”的设置,而是映射整个参数空间,以寻找资产当前动量结构的绝对全局最大值。 严格的财务评分与逼真的交易模拟   与基于抽象“指标点数”进行优化评分的业余工具不同,该引擎的 3.10 版本严格与资金数学挂钩。每
Matrix Arrow Indicator MT4
Juvenille Emperor Limited
5 (3)
矩阵箭头指标 MT4 是一种独特的 10 合 1 趋势,遵循 100% 非重绘多时间框架指标 ,可用于所有符号/工具:外汇、商品、加密货币、指数、股票。  Matrix Arrow Indicator MT4 将在其早期阶段确定当前趋势,从多达 10 个标准指标中收集信息和数据,它们是: 平均定向运动指数 (ADX) 商品渠道指数 (CCI) 经典 Heiken Ashi 蜡烛 移动平均线 移动平均收敛散度 (MACD) 相对活力指数 (RVI) 相对强弱指数 (RSI) 抛物线SAR 随机振荡器 威廉姆斯的百分比范围 当所有指标给出有效的买入或卖出信号时,相应的箭头将打印在图表上,在下一根蜡烛/柱线开盘时,指示强劲的上升趋势/下降趋势。用户可以选择使用哪些指标,并可以单独调整每个指标的参数。 Matrix Arrow Indicator MT4 仅从选定的指标中收集信息,并仅根据其数据打印箭头。 Matrix Arrow Indicator MT4 还可以为所有新信号发送终端、推送通知或电子邮件警报。无论您是黄牛、日内交易者还是波段交易者, Matrix Arrow Indicat
目前八折优惠! 对任何新手或专家交易者来说都是最好的解决方案! 这个仪表板软件适用于28种货币对。它基于我们的两个主要指标(高级货币强度28和高级货币冲动)。它对整个外汇市场提供了一个伟大的概述。它显示高级货币强度值,货币运动速度和28个外汇对在所有(9)时间段的信号。想象一下,当你可以使用图表上的单一指标观察整个市场,以确定趋势和或剥头皮的机会时,你的交易将得到改善 我们已经在这个指标中建立了一些功能,使你更容易识别强势和弱势货币,同时识别和确认潜在的交易。该指标以图形方式显示货币的强势或弱势是增加还是减少,以及它在所有时间段的表现。 增加的新功能是动态市场斐波那契水平,它适应当前的市场条件变化,这是一个已经在我们的高级货币强度28和高级货币冲动指标中使用的成熟的加分项。 在交易时,总是将弱势货币和强势货币配对,这个新指标将帮助你做到这一点。 用户手册:点击这里  https://www.mql5.com/en/blogs/post/708783 特点  显示每个时间段的ACS28和GAP-speed(冲动)的货币强度值。 列:颜色代码以7种颜色显示货币强度:强势
购买此指标即可免费获得我的专业交易管理器。 首先,值得强调的是,这个交易系统是一个非重绘、非重画和非滞后的指标,这使得它非常适合手动和机器人交易。 在线课程,手册和下载预设。 “智能趋势交易系统 MT5”是专为新手和经验丰富的交易者量身定制的综合交易解决方案。它结合了超过 10 个优质指标,具有 7 多个强大的交易策略,使其成为适用于各种市场条件的多功能选择。 趋势跟随策略:提供精确的入场和止损管理,以有效地跟随趋势。 反转策略:识别潜在的趋势反转,使交易者能够利用区域市场的机会。 剃头策略:专为快速准确的日内交易和短期交易而设计。 稳定性:所有指标都不会重绘、不会重画和不会滞后,确保可靠的信号。 定制:支持自定义策略,以满足个人交易偏好。超过 7 种策略和组合可帮助您找到最佳策略。 信号清晰度:提供箭头信号,以指示清晰的入场和退出点。 实时警报:通过交易进出警报使交易者保持了解。 深入分析:提供更高时间框架的趋势分析和实时交易监控。 自适应颜色编码:利用蜡烛颜色编码来显示成交量、趋势和反转蜡烛信号。通过蜡烛颜色分析市场方向。 “智能趋势交易系统 MT5”赋予交易者必要的工具,以便在
Trend Screener
STE S.S.COMPANY
4.79 (95)
趋势指标,趋势交易和过滤的突破性独特解决方案,所有重要趋势功能都内置在一个工具中! 它是 100% 非重绘多时间框架和多货币指标,可用于所有符号/工具:外汇、商品、加密货币、指数、股票。 限时优惠:支撑和阻力筛选指标仅售 50美元,终身有效。(原价 250 美元)(优惠延长) 趋势筛选器是有效的指标趋势跟踪指标,它在图表中提供带有点的箭头趋势信号。 趋势分析器指标中可用的功能: 1.趋势扫描仪。 2. 具有最大利润分析的趋势线。 3.趋势货币强度计。 4. 带有警报的趋势反转点。 5. 带有警报的强趋势点。 6. 趋势箭头 每日分析示例,每日信号表现...等与我们的趋势筛选指标,可以在这里找到: 点击这里 限时优惠:Trend Screener Indicator 仅售 50 美元且终身可用。原价 125$) 通过访问我们的 MQL5 博客,您可以找到我们所有的高级指标以及分析示例、每日信号表现...等。 : 点击这里 我们的趋势系统由 2 个指标组成: 1. Trend Screener Indicator:显示趋势仪表盘、图表中的趋势线、入场点...等。 2. Trend
作者的更多信息
A new interpretation of the classical indicator in the form of an oscillator for a more accurate representation of the situation on the market. Less lagging than the standard Alligator. All settings are fully accessible, such as the type and prices for which it is built. Thanks to the additional parameters, it became possible to fine tune. Distinctive features Does not redraw. Additional parameters for fine tuning. Works on all timeframes and symbols. Suitable for manual trading and developmen
FREE
SFT Full OsMA
Artem Kuzmin
4 (1)
A classic indicator with advanced features for more accurate display of the market situation. All settings of all moving averages are available, such as the moving average type and the priced used in its calculation. It is also possible to change the appearance of the indicator - line or histogram. Additional parameters provide the ability of fine tuning. Distinctive features Does not redraw. Additional parameters for fine tuning. Displayed as a line or as a histogram. Works on all timeframes a
FREE
The support and resistance levels are among the main components of the entire technical analysis. They are used both by professional traders and by beginners. Prices usually move within the price channels. The upper boundary of such a channel is called resistance, and the lower one is support. This indicator plots fractal support and resistance lines at the highest and lowest local price values (fractals). Distinctive features Does not redraw. Clear and understandable signals. It is possible to
SFT Go Trend
Artem Kuzmin
Opening positions in the direction of the trend is one of the most common trading tactics. The main idea is that the probability of the trend continuation is higher than that of its change. This indicator determines the direction of a local movement, marking the beginning of a trend with a large dot and its continuation with a line of the corresponding color. Distinctive features No Repaint. Simple and accurate settings. Clear and understandable signals. Works on all timeframes and symbols. Sui
This highly informative indicator applies overbought/oversold levels for more accurate representation of the market situation. It is also possible to change the appearance of the indicator - line or histogram. Additional parameters enable more fine-tuning, while trading can be inside the channel and along a trend. Distinctive features Oversold/overbought levels; Does not redraw. Displayed as a line or a histogram; Works on all timeframes and symbols. Suitable for manual trading and development
MACD indicator with overbought and oversold zones. Two display options - classic lines and a histogram. Can be used to detect a possible reversal or pullback in price, as well as for channel strategies All settings are simple and straightforward - all like a standard indicator, but with additional support and resistance levels Can be used both separately and together with other indicators
Awesome oscillator with overbought and oversold zones. A series of OBS indicators (overbought and oversold) - these are indicators enhanced with overbought and oversold zones. This makes it possible to determine when the instrument is trending, as well as when it is flat. Works on all timeframes, all currency pairs, metals and cryptocurrencies. Can be used with binary options. Settings OBS Period - period of overbought and oversold calculation
Accelerator indicator with overbought and oversold zones. A series of OBS indicators (overbought and oversold) - these are indicators enhanced with overbought and oversold zones. This is the standard indicator, but it provides additional possibilities for the analysis of any market. Thanks to a special algorithm, this indicator has overbought zones =70 and =100, as well as oversold zones -70 and -100, which allows you to use it to determine the possible reversal or pullback of the price, as well
The Bears indicator with overbought and oversold zones. Two display options - as a line and as a histogram.  A series of OBS indicators (overbought and oversold) - these are indicators enhanced with overbought and oversold zones. This is the standard indicator, but it provides additional possibilities for the analysis of any market. Thanks to a special algorithm, this indicator has overbought zones =70 and =100, as well as oversold zones -70 and -100, which allows you to use it to determine the
Bulls indicator with overbought and oversold zones. Two display options - as a line and as a histogram. OBS (overbought and oversold) indicator series - are indicators that have been provided with overbought and oversold zones. This is the standard indicator, but it provides additional possibilities for the analysis of any market. Thanks to a special algorithm, this indicator has overbought zones =70 and =100, as well as oversold zones -70 and -100, which allows you to use it to determine the p
The Force Index indicator with overbought and oversold zones. Two display options - as a line and as a histogram.  A series of OBS indicators (overbought and oversold) - these are indicators enhanced with overbought and oversold zones. Settings OBS Period - overbought/oversold calculation period Force Period - period of Force Price MA - prices for MA calculation Method MA - MA calculation method Line or Histo - display by line or histogram
Multicurrency indicator Any chart obs is a price chart with a percentage scale. Can be displayed as a line and as a histogram. There is also a reverse function available, it mirrors the chart. The name of an instrument to be displayed is specified in the input parameters, the current symbol is used on default. The indicator doesn't have lags as it is not smoothed with any formulas, but bound to a percentage scale, what allows detecting the price equilibrium, the overbought and oversold state. Th
The Accumulation indicator with overbought and oversold zones. Two display options - as a line and as a histogram.  A series of OBS indicators (overbought and oversold) - these are indicators enhanced with overbought and oversold zones.  Simple and straightforward settings that are easy to match to the right tool In the indicator, you can adjust: Display depth of the indicator Color of indicator levels
指标提供良好的信号,趋势反转 或离开该单位时,价格变动的可能方向。 功能和设置: Sensitivity       = 3         - (下图中为例)的多个信号的灵敏度为1〜 5 ,较高的值; DeepBars        = 3000 - 深度计显示; ZeroBarCalc     = FALSE;  - 用于在零杆的计算,如果是这样的信号将被使用,但目前的蜡烛结束前可能会消失; UseAlert          = FALSE;   - 包容警告; AlertSound      = TRUE;   - 声音; AlertMessage = TRUE;         - 显示; AlertMail          = FALSE;   - 发送消息到邮局; FileSound          = “ alert2.wav ” ; - 文件磬;
显著指标计算的价格水平,如果红的水平,那么价格将其分解,如果蓝到了。如果价格接近蓝色级别低于他的罢工toskoree总价,如果顶部更容易从水平反弹。同样,如果价格移动到红色顶层,它很可能是故障的水平,如果低于,则有可能反弹。 因为酒吧的水平已失去意义从计划中删除后得出水平等于CalculationBars 。 非常适合用于交易市场上挂单:停止改正的趋势和限制, SL和TP水平下一个最低/最高价格设定。与此交易建议的比例SL / TP为不小于1/2。     设置及说明: CalculationBars - 酒吧来计算的水平; LineLength -个长度的线棒; Filtr- 滤噪平滑的价格,价值较低的级别越高( 1 〜100 ) ; UpColor -色水平,该价格打破了; DnColor - 色水平,该价格打破了; LineWidth- 线宽,线的粗细;
The indicator is based on pair trading methods. It is not redrawn unlike similar indicators. Shows correlation between two selected instruments in percent for a predetermined period, and the positions of the instruments relative to each other. Has a function for reverse display of any of the analyzed symbols - for instruments with negative correlation. Can be drawn as a line or as a histogram. Settings: Symb1 - first symbol name. Revers1 - reverse display of the first symbol. Symb2 - second symb
Trend Factor
Artem Kuzmin
An indicator for entering with trend and timely exiting. It has sensitivity setting, by adjusting which it can be applied to both long-term and short-term speculation.  The highest sensitivity = 1, with this setup, you can even scalp on M1. No lag, does not withdraw after candlestick closure.  One of the use options: enter after a candlestick closes, if the vertical line consists of squares of the same color; exit if the color of two or more squares changes. Before using it, be sure to analyze t
The indicator builds fractals on extrema of the OsMA indicator Appears on the chart as a fractal or a fractal channel. It has a flexible setting and, in contrast to the standard fractals, lags only by 1 bar. Settings: DeepBars - the indicator's depth of display; Sensitivity_1_or_2 - 1 - for small periods of OsMA, 2 - for large periods; Arrow_or_channel - display on the chart fractals or channel; FastMA - period of the fast moving average;  SlowMA - period of slow moving average;  SignalSMA - per
Flat Factor
Artem Kuzmin
5 (1)
The indicator is designed for visual determining market directions. It allows to determine the distance from a price and helps in drawing correct conclusions. Perfectly defines flat zones, horizontal intraday trends and trend movements, and an additional setting allows to use the indicator on any instrument. Does not redraw its readings. You get professional trading indicator for a reasonable price. Settings: Period_FF = 7 - indicator period Sensitivity_FF = 5 - sensitivity in % Wish you all su
Extremum bars
Artem Kuzmin
The indicator colors bars displaying prices of overbought and oversold areas on the chart. It will help you to estimate moments when market climate changes and the price has its local extreme values. It can be used both independently and as a good supplement to any channel trading system. And this indicator is easy-to-use in expert advisors due to usage of indicator buffers instead of graphical objects. Settings ExtPeriod = 100 — indicator period; Sensitivity = 80 — indicator sensitivity.
This is a moving average which can move not only to the right/left, but also up/down. You can also select a mode of displaying the indicator (as a line or as dots) and all other settings of a standard moving average. If you overlay several indicators in one window, you can clearlier determine price channels setting each border individually. Settings Line_or_Dot - mode of displaying the indicator: true - as a line, false - as dots; MA_period - moving average period; MA_shift_X - number of candle
Alarm arrow indicator of increased sensitivity After closing the candle the arrows do not disappear Allows you to enter the transaction on time at the lowest price movements Can be used on any currency pairs, metals and cryptocurrency Suitable for working with binary options Distinctive features Does not redraw; Determines the price correction; Advanced settings for fine tuning; Works on all timeframes and on all symbols; Suitable for trading currencies, metals, options and cryptocurrency (Bitco
SFT Full MACD
Artem Kuzmin
A classic indicator with advanced features for more accurate display of the market situation. All settings of all moving averages are available, such as the moving average type and the priced used in its calculation. It is also possible to change the appearance of the indicator - line or histogram. Additional parameters provide the ability of fine tuning. Distinctive features Does not redraw. Additional parameters for fine tuning. Displayed as a line or as a histogram. Works on all timeframes a
This highly informative indicator applies overbought/oversold levels for more accurate representation of the market situation. All moving average settings are available, including average type and price it is based on. It is also possible to change the appearance of the indicator - line or histogram. Additional parameters enable more fine-tuning, while trading can be inside the channel and along a trend. Distinctive features Oversold/overbought levels; Does not redraw. Additional parameters for
Arrow indicator, to determine adjustments and local trends The arrow appears on the current bar and after closing the bar will not disappear. Allows you to enter the transaction at the very beginning of the movement Thanks to the flexible settings you can use on any currency pairs, metals and cryptocurrency Can be used when working with binary options Distinctive features Does not redraw. Additional parameters for fine tuning. Works on all timeframes and symbols. Suitable for trading curren
Opening positions in the direction of the trend is one of the most common trading tactics. This indicator determines the direction of the local movement and colors the candles on the chart in the appropriate color. Allows you to enter the transaction at the very beginning of the movement Thanks to the flexible settings you can use on any currency pairs, metals and cryptocurrency Can be used when working with binary options Distinctive features Does not redraw. Additional parameters for fine
One of the main components of successful trading is the correct determination of the direction of the market. This indicator shows the general directionality of the price movement and is painted in the corresponding color. Allows you to conduct trend and counter trend trading It works on all timeframes, on any currency pairs, metals and cryptocurrency Can be used when working with binary options Distinctive features Does not redraw; Simple and clear settings; Works on all timeframes and symbols
Arrow indicator, for determining price reversals Arrow appears on the closed bar Allows you to enter the transaction at the very beginning of the turn Can be used on any currency pairs, metals and cryptocurrency Suitable for working with binary options Distinctive features Determines the price correction; Advanced settings for fine tuning; It works on all timeframes and on all symbols; Suitable for trading currencies, metals, options and cryptocurrency (Bitcoin, Litecoin, Ethereum, etc.) Suitab
筛选:
无评论
回复评论