Next Possible Bar MT4
- Indikatoren
- Version: 7.7
- Aktualisiert: 23 Mai 2020
- Aktivierungen: 5

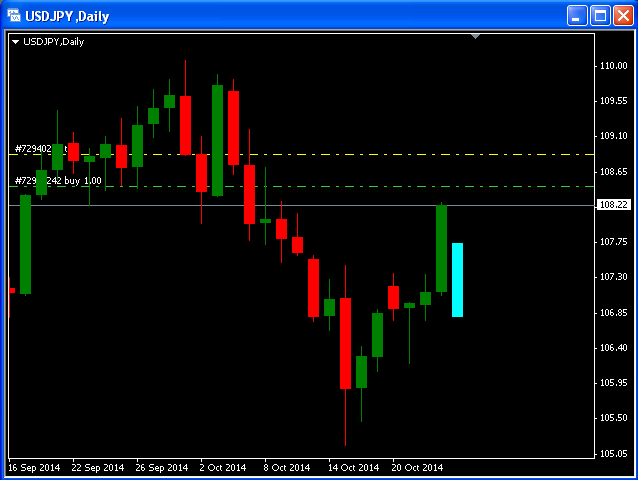
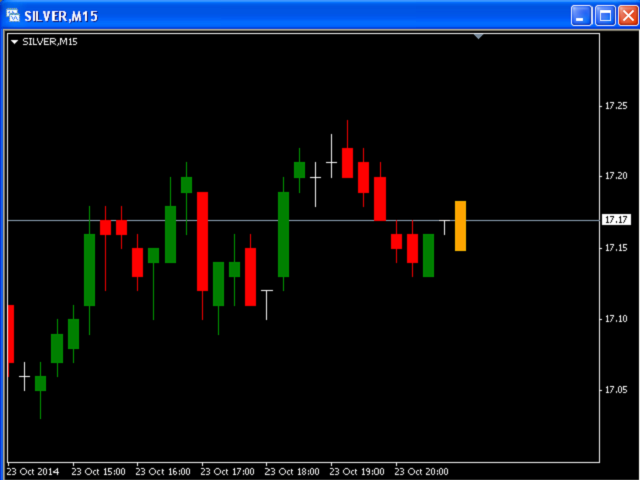
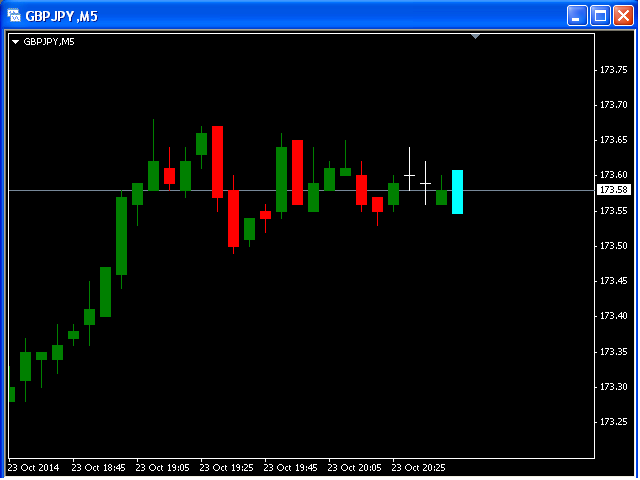
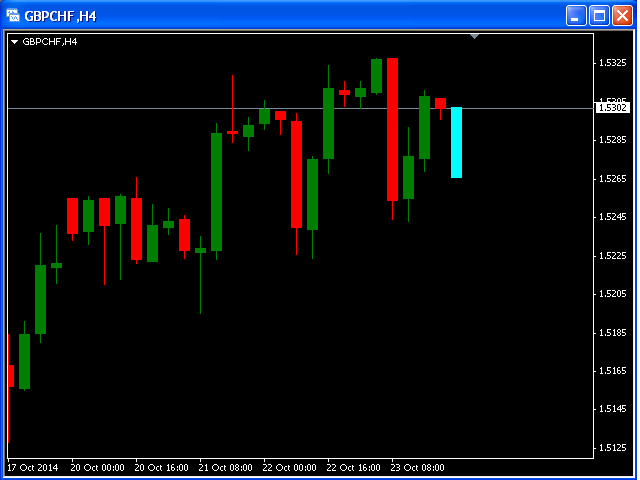
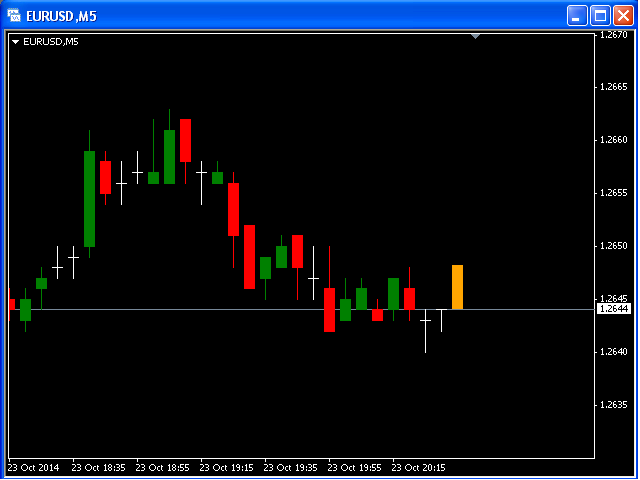
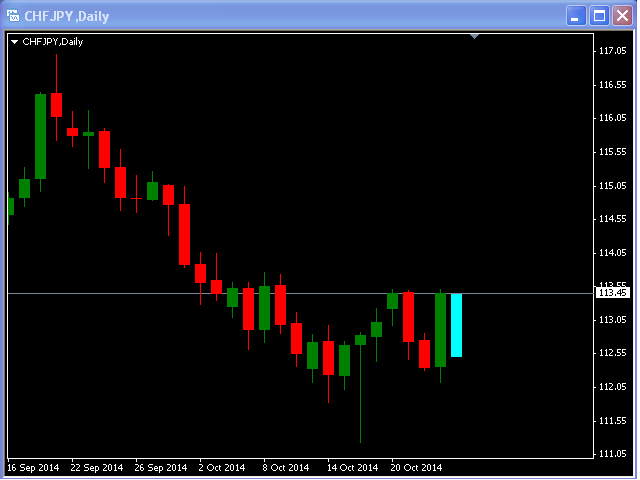
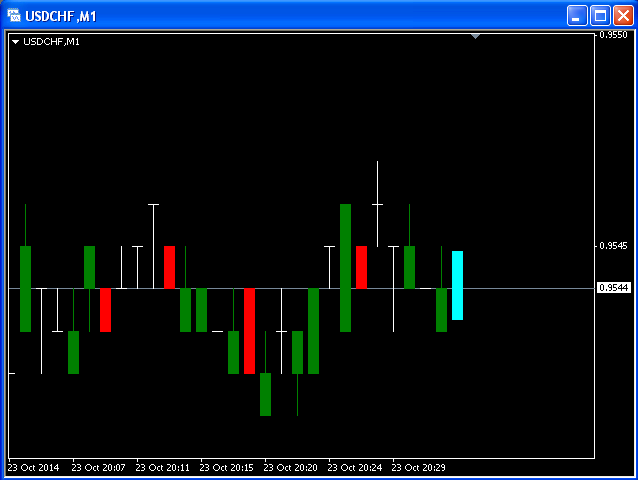
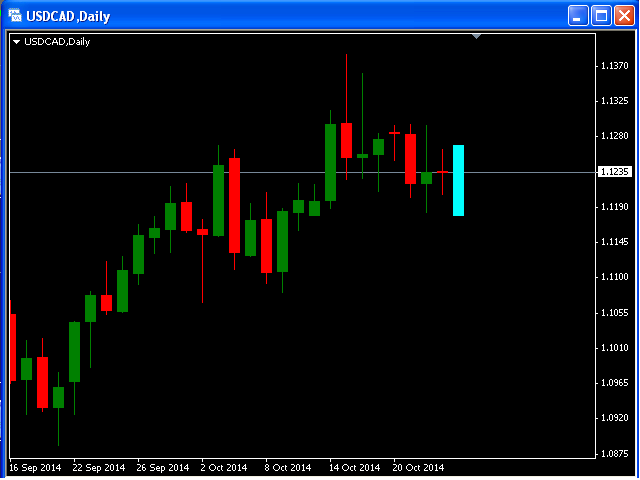
Dieser Indikator berechnet den nächstmöglichen Balken für jedes Währungspaar und jeden Zeitrahmen.
- Wenn der nächstmögliche Schlusskurs größer als der Eröffnungswert ist, wird der nächstmögliche Balken in der Farbe Aqua angezeigt.
- Wenn der nächstmögliche Schlusskurs kleiner als der Eröffnungswert ist, wird der nächstmögliche Balken in Orange angezeigt.
Natürlich zeigt der nächste mögliche Balken nicht die große Preisbewegung an.
Dieser Indikator ist am nützlichsten in der ruhigen Zeit.