Next Possible Bar MT4
- Indicadores
- Versión: 7.7
- Actualizado: 23 mayo 2020
- Activaciones: 5

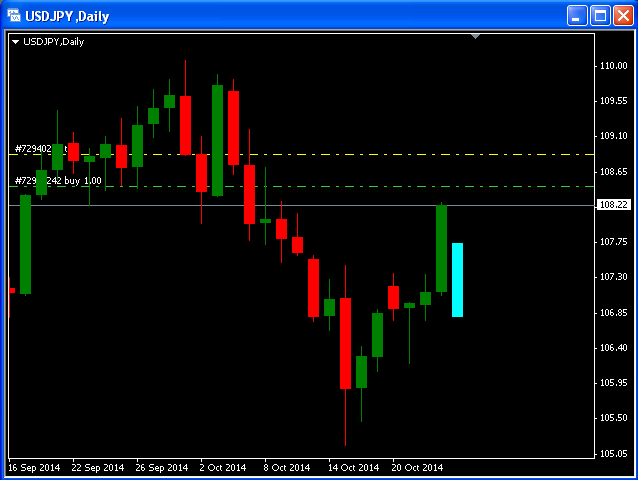
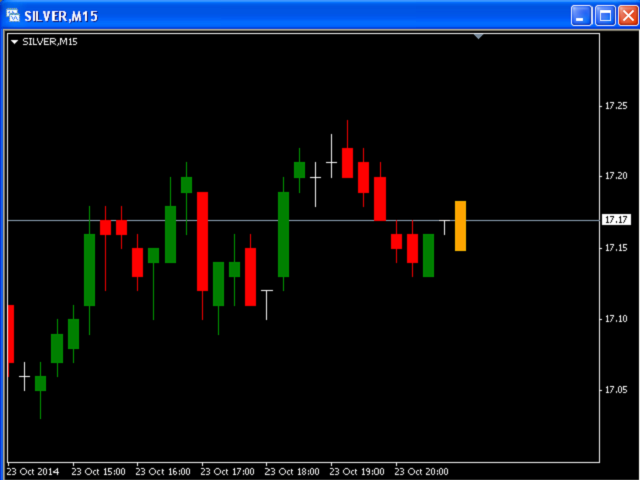
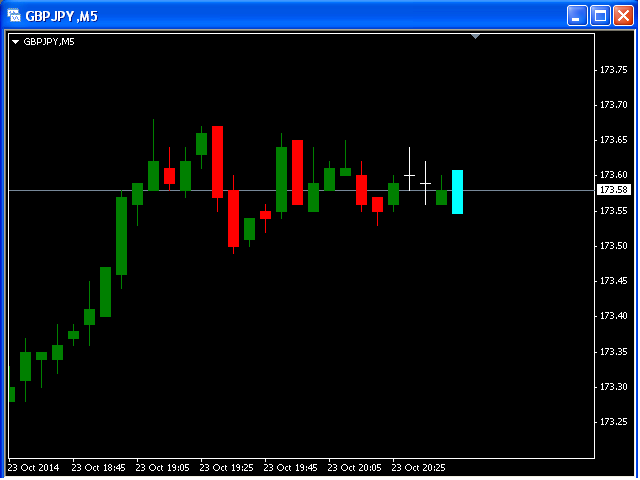
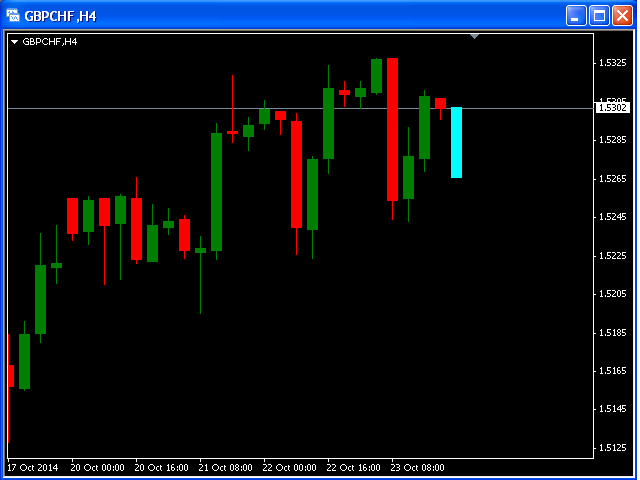
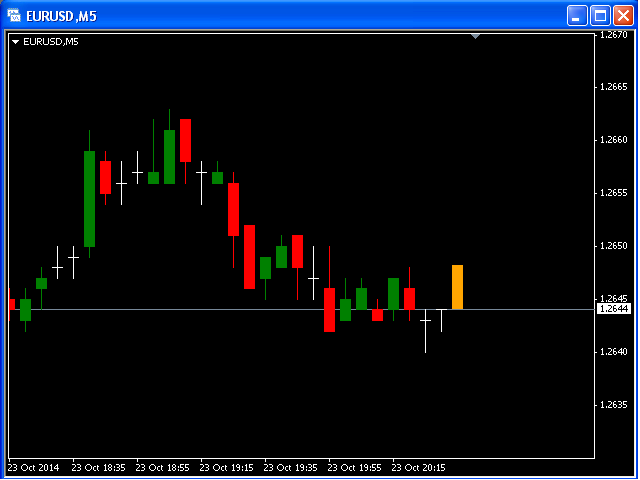
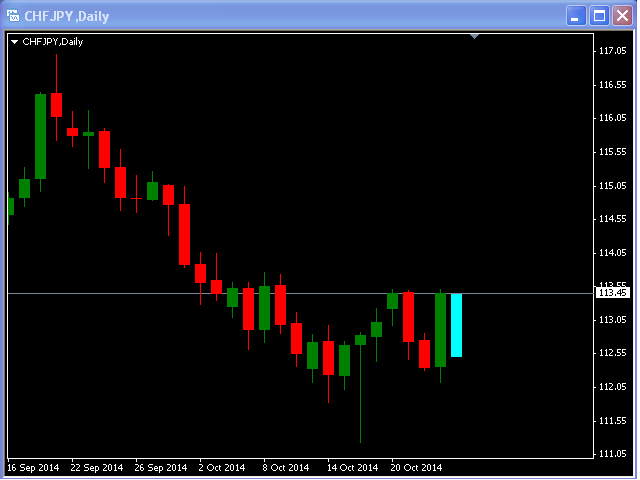
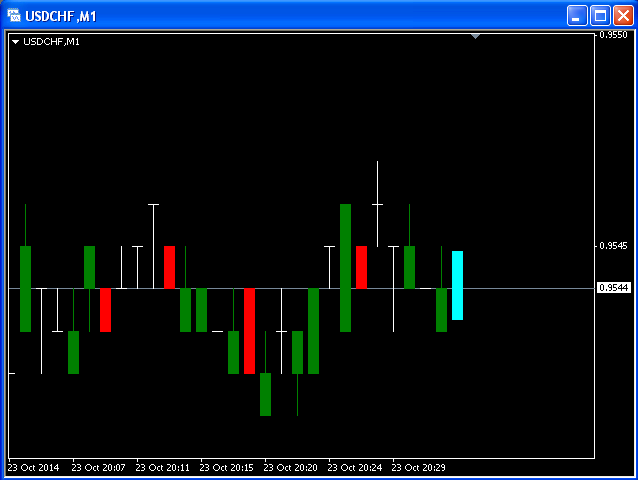
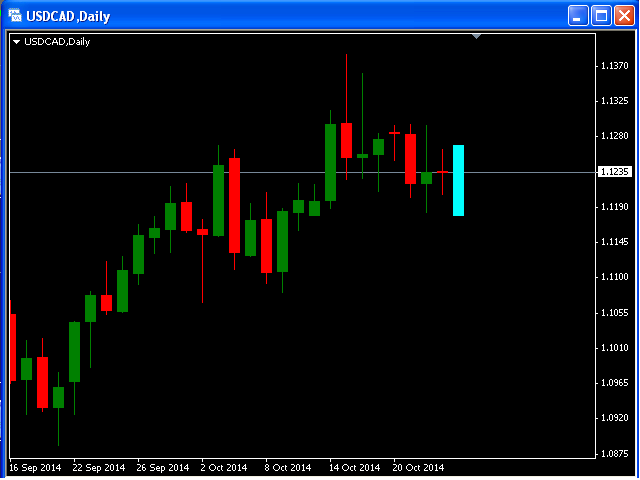
Este indicador calcula la siguiente barra posible para cada par de divisas y marco temporal.
- Si el siguiente cierre posible es mayor que la apertura, la siguiente barra posible será de color aguamarina.
- Si el próximo cierre posible es menor que la apertura, la próxima barra posible será de color naranja.
Por supuesto, la siguiente barra posible no mostrará el gran movimiento del precio.
Este indicador es más útil en tiempos de calma.