MESA Spectrum
- Indikatoren
- Version: 1.4
- Aktualisiert: 4 Oktober 2018
- Aktivierungen: 5

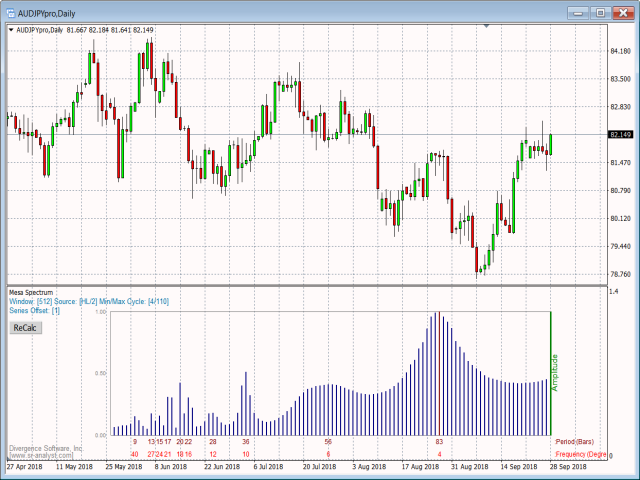
Der MESA-Spektrum-Indikator berechnet das Leistungsspektrum einer Datenreihe mithilfe der Maximum-Entropie-Spektrum-Schätzmethode und erstellt ein Leistungsspektrum-Diagramm. Der Maximum-Entropie-Algorithmus umfasst im Gegensatz zu einer einfachen FFT-Transformation Frequenzen aus der gesamten komplexen Frequenzebene und nicht nur aus dem Nyquist-Intervall, was im Allgemeinen bedeutet, dass er Zyklusperioden auflösen kann, die größer sind als das an die Funktion übergebene Datenfenster. Darüber hinaus ist MESA in der Lage, sehr scharfe spektrale Merkmale zu erfassen, die bei anderen Analysemethoden oft übersehen werden.
Das angezeigte Leistungsspektrum hebt die dominanten Zyklen und Frequenzen innerhalb der Daten hervor und zeigt die Periode und die Frequenz unter jeder Spitze an.
Vor der Weiterleitung an den MESA-Algorithmus wird der Logarithmus der Preisdaten mithilfe eines Filters mit dem kleinsten quadratischen Mittelwert detrendiert.
Wenn Sie mit diesem Tool experimentieren, werden Sie schnell feststellen, dass die meisten Finanzzeitreihen ihre höchsten Amplituden am unteren Ende des Frequenzspektrums haben und die meisten dieser "dominanten" Zyklen zu lang sind, um für den kurzfristigen Handel verwendet zu werden. Das Skript verfügt über zwei anpassbare Anzeigefilter (Obere Zyklusgrenze und Untere Zyklusgrenze), in die Sie eine obere und untere Grenze für die Zyklusperiode eingeben können. Auf diese Weise können Sie sehr hohe und/oder sehr niedrige Frequenzen effektiv ignorieren, so dass Sie sich auf die Suche nach Zyklen innerhalb eines Periodenbereichs konzentrieren können, der für Ihren Handelsstil sinnvoll ist. Darüber hinaus können Sie die Fenstergröße für die Zyklusanalyse auswählen, die Eingabepreisquelle festlegen und den Offset der Eingabedaten bestimmen.
Perioden werden als die Anzahl der Balken berechnet, die für einen Zyklus erforderlich sind, und Frequenzen werden als die Anzahl der Änderungsgrade pro Balken berechnet.
P = Balken pro Zyklus;
F = 360/P (360 Grad geteilt durch die Periode)
Ein alternativer F-Wert kann als Anzahl der Zyklen in der Datenperiode N berechnet werden:
F = N/P.
Die Spektralinformationen können als Grundlage für weitere Zyklusstudien oder für die Feinabstimmung verschiedener Oszillatoren und Indikatoren verwendet werden. Der typische Ansatz besteht darin, das Leistungsspektrum zu verwenden, um den dominanten Zyklus in Ihren Daten zu identifizieren und dann Ihren gleitenden Durchschnitt oder Oszillator auf eine Periode einzustellen, die 1/2 des dominanten Zyklus beträgt.
Optionen:
| Menü Option | Beschreibung |
|---|---|
| Fenstergröße | Wählen Sie zwischen 1024, 512, 256 oder 128. Im Allgemeinen wird die Fenstergröße 512 oder 256 empfohlen. Die Standardeinstellung ist 512. |
| Quelle | Wählen Sie die Quelle für die Preiseingabe. Die Standardeinstellung ist Medianpreis. |
| Daten-Offset | Legen Sie den Offset für die Preisreihe fest. Der Standardwert ist 1 (Balken). |
| Obere Zyklusgrenze | Wählen Sie die größte akzeptable Zykluslänge. Der Standardwert ist 110. Der Bereich ist 1-512. |
| Untere Zyklusgrenze | Wählen Sie die kleinste zulässige Zykluslänge. Der Standardwert ist 4. Der Bereich ist 1-512. |
| Farbe des Spektrums (reg) | Legen Sie die Farbe für die Spektraldarstellung fest. |
| Spektrum (max) Farbe | Legen Sie die Farbe fest, mit der der dominante Zyklus hervorgehoben wird. |
| Farbe des Spektrums (Rahmen) | Legen Sie die Farbe für den Spektrumsrahmen fest. |
| Spektrale Legende 1 Farbe | Legen Sie die Farbe für die Periodenlegende fest. |
| Spektrale Legende 2 Farbe | Legen Sie die Farbe für die Frequenzlegende fest. |
| Farbe der Infobox | Legen Sie die Farbe für das Informationsfeld fest, das unter dem Titel angezeigt wird. |