New MACD Multi Timeframes
- Indikatoren
- Version: 1.7
- Aktualisiert: 3 November 2020
- Aktivierungen: 5

Dies ist ein neuer Single/Multi-Zeitrahmen-Indikator, der auf dem Konzept der gleitenden Durchschnittsdivergenz basiert.
Sie können ihn in verschiedenen Modi verwenden:
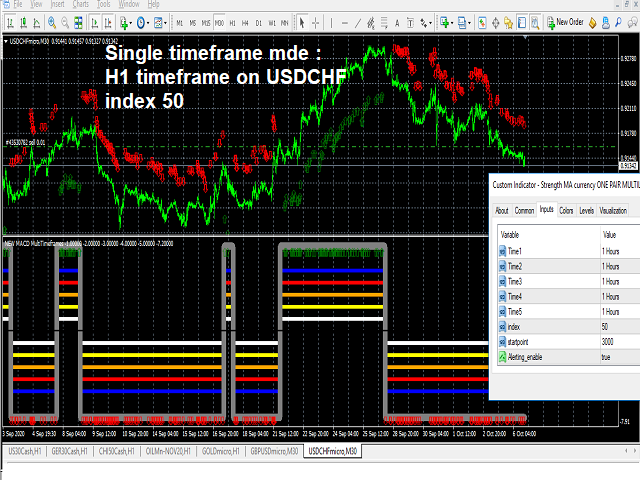
Einzelner Zeitrahmen-Modus: (2. bevorzugt)
Sie geben die Zeitrahmen alle mit der gleichen Periode ein - Sie erhalten eine Rechteckwelle für Bären-/Bullenbereiche
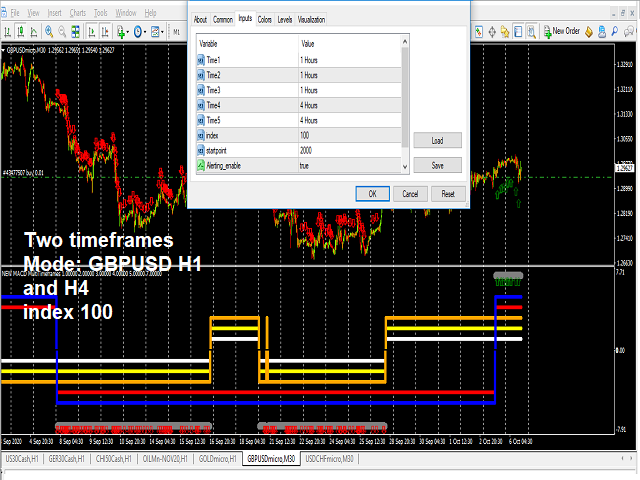
Zwei-Zeitrahmen-Modus: (1. bevorzugt)
Sie geben die beiden Zeitrahmen ein, die Sie bevorzugen - Sie erhalten zwei Rechteckwellen, die die 2 Zeitrahmen repräsentieren -
Wenn die beiden quadratischen Wellen einen Bärenbereich anzeigen, erscheint ein roter Abwärtspfeil und das gleiche für den Bullenbereich.
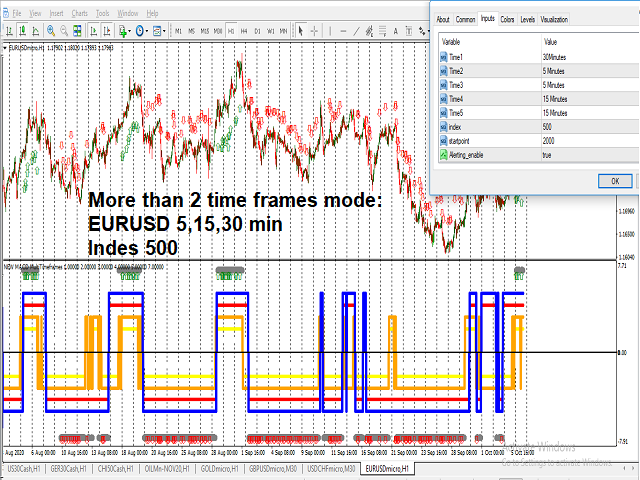
Multi-Zeitrahmen-Modus:
Sie geben bis zu fünf Zeitrahmen ein, die Sie bevorzugen - Sie erhalten fünf quadratische Wellen, die die Signale aus den 5 Zeitrahmen repräsentieren -
Wenn die fünf quadratischen Wellen einen Bärenbereich anzeigen, erscheint ein roter Abwärtspfeil, dasselbe gilt für den Bullenbereich.
die Multi-Modi zeigen weniger Bereiche für den Handel an
Eine weitere Haupteingabe ist der Indexwert: 10 /20....500 (je nach Ihrer Wahl)
niedrige Indexwerte bei Verwendung von Zeitrahmen mit hohem Input, wie 30 Minuten und darüber, auch für den kurzfristigen Handel
Hohe Indexwerte bei der Verwendung von niedrigen Eingabezeitrahmen wie 30 Minuten und darunter auch für den kurzfristigen Handel