Multi TimeFrames Bollinger Bands Signals
- Indikatoren
-
Valter Pegoraro
 Hi, I'm a freelance Programmer Analyst.
I work for Banks and Insurance.
If you need programs or program changes, contact me! - Version: 1.0
- Aktivierungen: 5
Dieser Indikator basiert auf den Bollinger Bändern auf einem oder mehreren Zeitrahmen und auf einem beliebigen Währungspaar (Cross Pair).
Der Indikator erzeugt eine Warnmeldung, wenn er ein Kauf- oder Verkaufssignal feststellt.
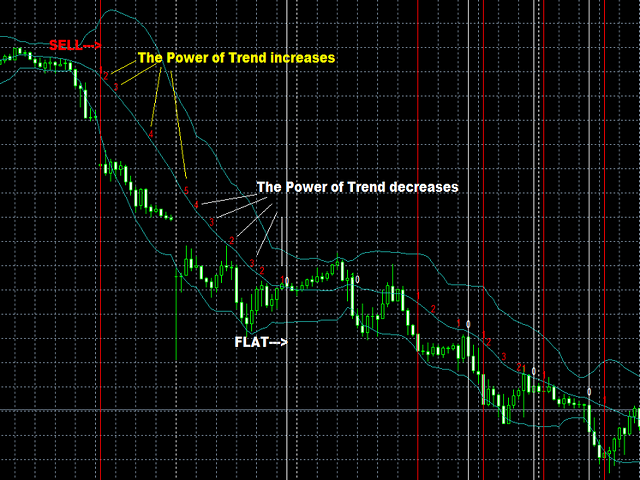
Außerdem zeichnet er einen vertikalen Balken auf dem Preisdiagramm: grün für Kauf oder rot für Verkauf, weiß, wenn er flach ist.
Warnmeldungen und vertikale Balken für KAUF oder VERKAUF werden generiert, wenn die Bollinger Bänder für alle gewählten Zeitrahmen konsistent sind, andernfalls wird ein FLAT-Signal generiert.
Darüber hinaus misst der Multi TimeFrames Bollinger Bands Signals Indikator die"POWER" des Trends, die auf der mittleren Linie der Bollinger Bands (SMA-Linie) mit einer Zahl (1, 2, 3,...) hervorgehoben wird.
Je höher die Zahl ist, desto stärker ist der Trend.
Dies ist nützlich, um zu erkennen, wann der Trend stark wird (so dass es geeignet sein könnte, einen Auftrag zu eröffnen) und wann er schwach wird (so dass es geeignet sein könnte, einen Auftrag zu schließen).
Merkmale
Einfache und flexible Einstellungen:
- Erkennung des Bollinger Bands Signals für einen oder mehrere Zeitrahmen
- Einstellen der Niveaus der Bollinger Bands
Beispiel
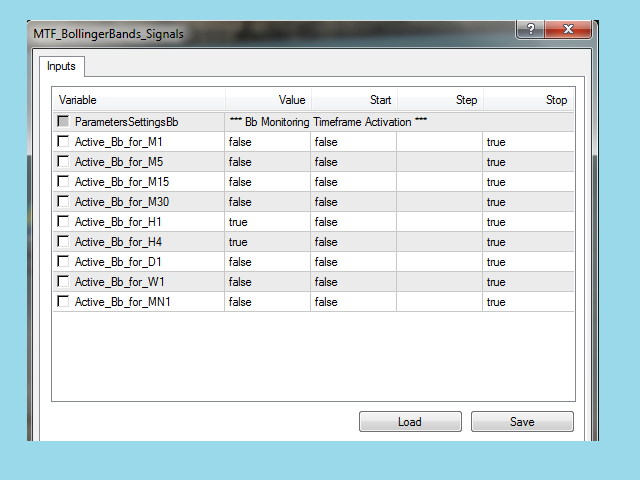
Sie hängen den Indikator an einen Chart mit H1 an, setzen Active_Bb_for_H1 auf "true" und Active_Bb_for_H4 auf "true" (Standardeinstellung).
Der Indikator verwendet die Standardparameter der Bollinger Bands:
- Band-Periode = 20
- Bänder Verschiebung = 0
- Band-Abweichungen = 2.0
Parameter
BB Überwachung Zeitrahmen Aktivierung
- Active_BB_for_M1 - wahr/falsch.
- Active_BB_for_M5 - wahr/falsch.
- Aktiv_BB_für_M15 - wahr/falsch.
- Aktiv_BB_für_M30 - wahr/falsch.
- Aktiv_BB_für_H1 - wahr/falsch.
- Aktiv_BB_für_H4 - wahr/falsch.
- Aktiv_BB_für_D1 - wahr/falsch.
- Aktiv_BB_für_W1 - wahr/falsch.
- Aktiv_BB_für_MN1 - wahr/falsch.
Hinweis
In den Screenshots der Beispiele ist der Bollinger Bands Oszillator, der erscheint, nicht die Arbeit von "Multi TimeFrames Bollinger Bands Signals".
Sie können ihn sehen, wenn Sie den Standard-MetaTrader 4-Oszillator oder ein anderes kostenloses Programm verwenden.