New MACD Multi Timeframes
- Indicadores
- Versión: 1.7
- Actualizado: 3 noviembre 2020
- Activaciones: 5

Este es un Nuevo Indicador de Single/Multi Timeframes basado en conceptos de divergencia de Medias Móviles.
Se puede utilizar en diferentes modos:
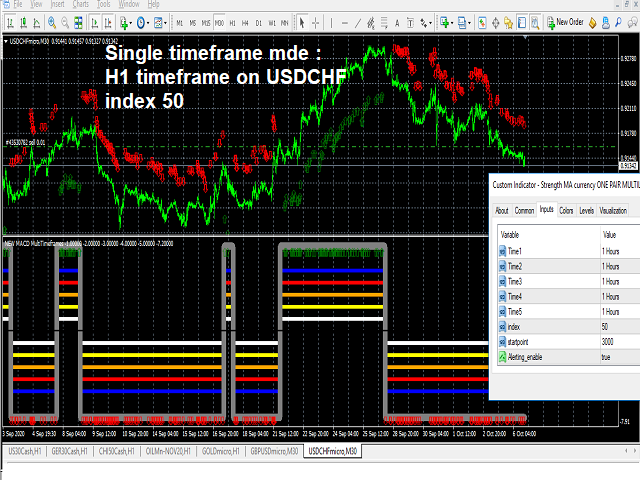
Modo Single time frame :(2º preferido)
si introduce todos los marcos temporales en el mismo periodo, obtendrá una onda cuadrada para las zonas bajistas/alcistas.
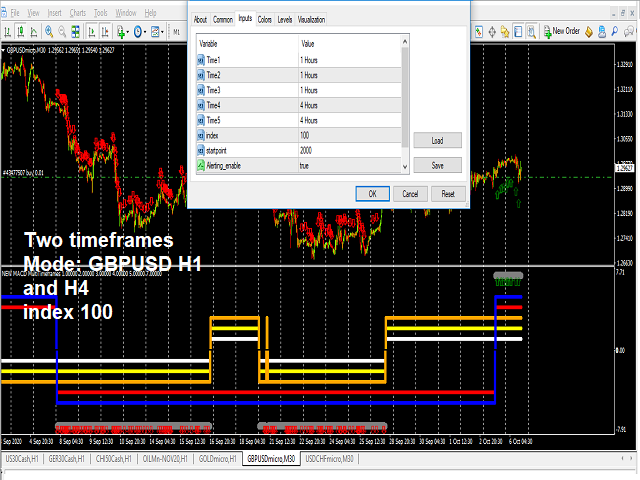
Modo de dos marcos de tiempo :(1er preferido)
introduzca los dos marcos de tiempo que prefiera - obtendrá dos ondas cuadradas representando los 2 marcos de tiempo -
Cuando las dos ondas cuadradas muestren una zona bajista, aparecerá una flecha roja hacia abajo y lo mismo para la zona alcista.
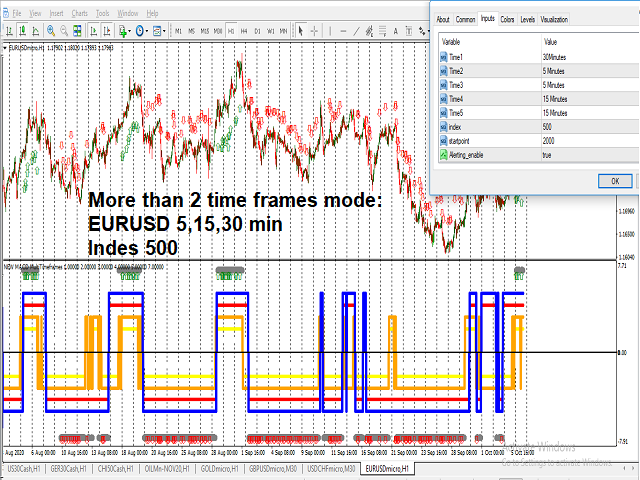
Modo Multi-marco temporal :
introduzca hasta cinco marcos temporales de su preferencia - obtendrá cinco ondas cuadradas que representan las señales de los 5 marcos temporales - cuando las cinco ondas cuadradas muestren una zona bajista, aparecerá una flecha roja hacia abajo, y lo mismo para la zona alcista.
Cuando las cinco ondas cuadradas muestren una zona bajista, aparecerá una flecha roja hacia abajo y lo mismo para la zona alcista.
los modos Multi mostrarán menos áreas para operar
También una entrada principal es el valor del índice: 10 /20....500 (según su elección)
valores de índice bajos cuando se utilizan marcos de tiempo de entrada altos como 30 min y superiores también para operaciones a corto plazo
Valores de índice altos cuando se utilizan marcos de tiempo de entrada bajos como 30 min e inferiores, también para operaciones a largo plazo.