• Aperçu
  • Avis (1)
  • Commentaires (11)
  • Nouveautés

Peaks and Troughs

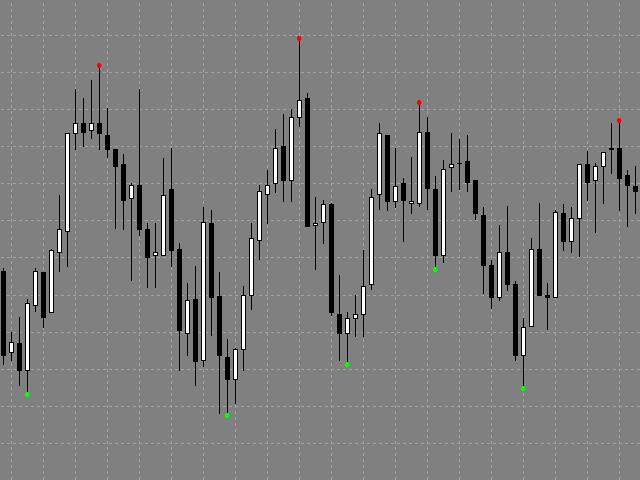
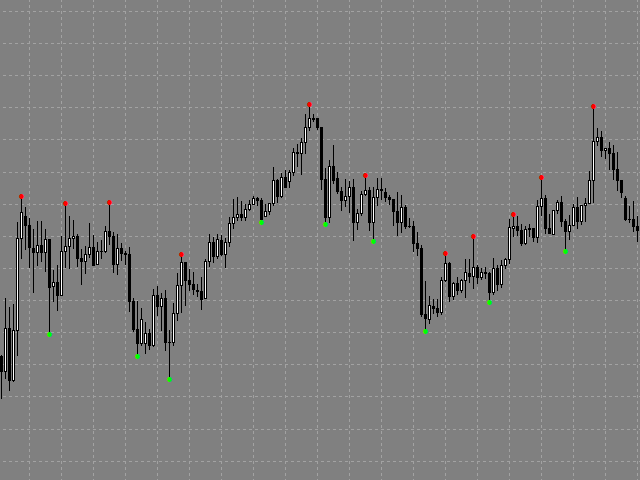
The indicator detects important peaks and troughs (extremes) on the chart.
These points can be used to plot support/resistance levels and trend lines, as well as any other graphical analysis.
These points can serve as reference points for setting trading orders.
The indicator does not redraw.

Settings:

  • Size_History - the size of the calculated history.
  • Num_Candles_Right - number of candles to the right of the peak or trough.
  • Num_Candles_Left - number of candles to the left of the peak or trough.
  • Type_Arrows_extremum - label style.
  • Send_Sound - sound alert. 
  • Send_Mail - send an email notification. 
  • Send_Notification - send a mobile notification. 
  • Send_Alert - standard terminal alert.
Produits recommandés
Auto Levels
Yaroslav Varankin
Auto Level this tool is able to determine the levels of support and resistance. search and display when the price has broken through the level and when it pushed off from it. the indicator can be useful if you use resistance support levels in your trading. or the highs and lows of the price, then it will greatly simplify your work and help you more quickly and more accurately determine the rebound or breakdown of the current trend or tendencies level. blue line bottom uptrend red line on top dow
This is a well-known ZigZag indicator. But it differs by the fact that its plot is based on values of the middle line which is set by a user. It can display Andrews’ Pitchfork and standard or Bobokus Fibo levels. NO REPAINTING. Parameters Period МА — middle line period. Default value is 34. Minimum value is 4. Maximum value is set at your discretion. Used to calculate price - base price to calculate the middle line. The averaging method - method of smoothing the middle line. Turning pitchfork
Introduction to X3 Chart Pattern Scanner X3 Cherart Pattern Scanner is the non-repainting and non-lagging indicator detecting X3 chart patterns including Harmonic pattern, Elliott Wave pattern, X3 patterns, and Japanese Candlestick patterns. Historical patterns match with signal patterns. Hence, you can readily develop the solid trading strategy in your chart. More importantly, this superb pattern scanner can detect the optimal pattern of its kind. In addition, you can switch on and off individu
The Master Figures indicator analyzed the market for the most common chart patterns. The first pattern is called Pin bar . This pattern can rightly be considered one of the most widespread. This pattern looks like a candle with a small body and large tail (wick). Once you see it on the chart, open a position against the wick. It is better to use the resistance lines for closing. Master Figures shows this pattern in the form of circles. A position should be opened when a new candle appears after
Reversal Pattern Pro
Boonyapagorn Rodvattanajinda
Reversal Patterns Pro Reversal Patterns Pro is a Price Action (PA) analytical tool that scans the reversal patterns.  - Finds and marks the most dependable Japanese candlestick patterns in real-time. - Supports all time frames (Best for Scalping) - Doesn't repaint making it an exceptional indicator for Expert Advisors. Input parameters : - Support & Resistance Mode ( true or false ) for enabling advanced filtering - Donchian Period - RSI Period - RSI Oversold Level - RSI Overbought Level - 
This Indicator was used on  EA  Advanced Fibo levels . Indicator is designed to trade for most popular Fibonacci strategy that's completely automated. It automatically identifies and show Entry levels included Support/ Resistance Zones , according to the time zone candle by Fibonacci levels. As well as the traditional Fibonacci tool also included. However, it is very user friendly rather than default available one. On the other hand one more tool included. It automatically identifies real Suppo
FREE
Индикатор ищет подобную ценовую структуру, сравнивая с последней ценовой структурой. Размер паттерна (грубо говоря количество переломов зигзага) настраивается (всегда меньше на 1, чем введено - нулевой перелом не считается). Все найденные совпадения отмечаются прямоугольником. Так же к паттернам существует быстрая навигация с помощью кнопочек "Next patt" и "Prev patt". В индикатор вшиты два индикатора типа ЗигЗа г : стандартный зигзаг и пользовательский , моей разработки. Параметры настройки ста
Cet indicateur détectera les motifs harmoniques tracés sur le graphique à l'aide de méthodes manuelles et automatiques. Ajoutez votre avis, s'il vous plaît. Notes: Cet indicateur dispose d'un panneau de contrôle et il enregistrera chaque réglage (graphique et unité de temps). Vous pouvez le réduire pour avoir plus d'espace sur le graphique et vous pouvez appuyer sur le bouton de fermeture pour masquer toutes les données de l'indicateur sur le graphique si vous préférez travailler avec d'autres o
Fibonacci SR Indicator This indicator creates support and resistance lines. This indicator is based on Fibonacci Retracement and Extension levels. It will consider many combinations of the Fibonacci levels and draw support/resistance lines based on these. This indicator uses tops and bottoms drawn by the ZigZag indicator in its calculations. The ZigZag can also be drawn on the chart, if necessary. The indicator considers many combinations of past reversal points and Fibonacci ratio levels, and
FREE
COG LR Osc AM
Andriy Matviyevs'kyy
The presented indicator allows you to determine potential entry points into the market and set protective orders at reasonable levels. This product can be useful for both beginners and experienced traders. The indicator is based on calculation methods proven by time and practicing traders. The indicator is calculated in two stages: At the first stage, linear regression (LR) of the selected price type is determined for a given number of chart periods. At the second stage, the obtained data is p
Pi
Vasja Vrunc
Professional Prediction Indicator Based on matching the history with selected pattern model and shows the most likely outcome. Pi indicator includes Pattern line, Scanned_Past line, Matching_Pattern line, Future_Predicted line, adjustable Model Band , and some other controls. This indicator is designed primarily for professional use and is very useful in the search for the probability of the results relating to the future. Note : The results depend on model_band and past_bars . They are appro
Cet indicateur fonctionne en conjonction avec la théorie des vagues d'Elliott de deux manières : Mode automatique : Dans ce mode, l'indicateur détectera automatiquement les cinq vagues motrices sur le graphique conformément à la théorie des vagues d'Elliott. Il fournira des prédictions et identifiera les zones potentielles de retournement. De plus, il a la capacité de générer des alertes et des messages push pour informer les traders des développements importants. Cette fonctionnalité automatiqu
Introduction Harmonic Patterns are best used to predict potential turning point. Traditionally, Harmonic Pattern was identified manually connecting peaks and troughs points in the chart. Manual harmonic pattern detection is painfully tedious and not suitable for everyone. You are often exposed under subjective pattern identification with manual pattern detection. To avoid these limitations, Harmonic Pattern Plus was designed to automate your harmonic pattern detection process. The functionality
All Symbols   AND  All Time frames Scan                                                                                                                 Document Introduction   The ABCD is a basic harmonic pattern. The ABCD pattern is a visual, geometric chart pattern comprised of three consecutive price swings. It looks like a diagonal lightning bolt and can indicate an upcoming trading opp
The Grid Inside
Luiz Godoy
5 (1)
The Grid Inside works on a counter trend mode, automatically opens a new order when it hits the price target due to the Fibonacci levels at 23.6 and 73.6. If the price goes the wrong way it opens another order with a calculated lot and position. All the positions are closed when it reaches the target profit defined on settings. As TGI does not use stop loss, I don't recommend you put on your account more than you can afford to lose, the higher the timeframe safer it gets. Once an order is trigge
Divergence Osw Metatrader 4
William Oswaldo Mayorga Urduy
DIVERGENCE OSW  (For Metatrader 4) This indicator works on divergences and has the following functions: Generate an alert when a divergence occurs. Create lines by calculating the Stoploss and Takeprofit according to projection waves of inverse waves. Create an arrow indicating the possible direction of the market. The signals sent by the indicator are given when the candle ends. The Trader must evaluate each divergence to take entries. Settings: Activation and deactivation of alerts. Alert inte
TrendControl is an arrow indicator of technical analysis for determining a trend, which can adjust to the price, is a graphical plot calculated using mathematical formulas, the initial data for which is a price chart. The indicator shows the direction of the trend, takes into account the minimum and maximum values ​​of the extreme candles on the chart, then brings them to the average and compares them with the past data. The principle of operation of the indicator is to automatically determin
The Icarus Auto Dynamic Support and Resistance  Indicator provides a highly advanced, simple to use tool for identifying high-probability areas of price-action automatically - without any manual input whatsoever. .  All traders and investors understand the importance of marking horizontal levels on their charts, identifying areas of supply and demand, or support and resistance. It is time-consuming and cumbersome to manually update all instruments, across all timeframes, and it requires regular
The indicator displays Renko bars on the chart, uses them to plot the ZigZag - trend lines connecting the local Lows and Highs of the price movement, and highlights them based on the Gartley patterns, showing the potential price reversal points. Renko - specialized display of the price action, in which the graph is displayed not every bar of the time frame, but only under the condition that the price had passed more than the specified number of points. Renko bars are not bound to a time frame, s
Fibonaccitools
Aymn Sʿyd Ahmd Hsn Alkwmy
Fibonacci retracements are popular tools that traders can use to draw support lines, identify resistance levels, place stop-loss orders, and set target prices. A Fibonacci retracement is created by taking two extreme points on a stock chart and dividing the vertical distance by the key Fibonacci ratios of 23.6%, 38.2%, 50%, 61.8%, and 100%. Fibonacci tools indicator will Draw Fibonacci Tools e.g. Retracement, Arc, Fan, Expansion, TimeZones. Based on zigzag indicator"
FiboRec
Alfred Kamal
This indicator depends on Fibonacci lines but there is a secret lines i used them, by using FiboRec indicator you will be able to know a lot of important information in the market such as: Features You can avoid entry during market turbulence. You can enter orders in general trend only. You will know if the trend is strong or weak. Signal Types and Frame used You can use this indicator just on H1 frame. Enter buy order in case Candle break out the square area and closed over it, at least 20
PZ 123 Pattern
PZ TRADING SLU
3.75 (4)
The 123 Pattern is one of the most popular, powerful and flexible chart patterns. The pattern is made up of three price points: a bottom, a peak or valley, and a Fibonacci retracement between 38.2% and 71.8%. A pattern is considered valid when the price breaks beyond the last peak or valley, moment at which the indicator plots an arrow, rises an alert, and the trade can be placed. [ Installation Guide | Update Guide | Troubleshooting | FAQ | All Products ] Clear trading signals Customizable c
Master Scalping M1 est un indicateur innovant qui utilise un algorithme pour déterminer rapidement et avec précision la tendance. L'indicateur calcule le temps d'ouverture et de fermeture des positions, les algorithmes de l'indicateur vous permettent de trouver les moments idéaux pour entrer dans une transaction (acheter ou vendre un actif), ce qui augmente le succès des transactions pour la plupart des commerçants. Avantages de l'indicateur : Facile à utiliser, ne surcharge pas le graphique ave
For this set of indicators 1. General information     - Calculates with high performance mathematical algorithms.     - Calculated from the price of candles     - The entry point of this order is filtered by the train EMA and the oscillator.     - Calculate the integrity of the candle 2. How does it work?     - You can see two types of order entry points: the notification on the monitor and the arrow.     - You can trust 75-95 percent of this entry point. 3. Settings     - A complete candle
This indicator filters the Zigzag indicator to calculate the main support and resistance levels. Variables minimum gap between peaks : is the distance (GAP) between the peaks of the Zigzag peaks sensitivity : Minimum number of nearby peaks look back: it means that it has to test the last 50 peaks in the Zigzag object name perfix: a prefix for level’s line name on chart
FREE
PZ Wedges
PZ TRADING SLU
3 (2)
This indicator finds wedges , which are continuation patterns identified by converging trendlines surrounding a price consolidation period. It signals trades using a donchian breakout alongside the formation breakout. [ Installation Guide | Update Guide | Troubleshooting | FAQ | All Products ] Easy to use Customizable colors and sizes It implements breakout signals It implements alerts of all kinds Optimal Usage To see wedges of all sizes, which can overlap, load the indicator several times on
PZ Pennants
PZ TRADING SLU
This indicator finds pennants , which are continuation patterns identified by converging trendlines surrounding a price consolidation period. Trades are signaled using a breakout period alongside the formation breakout.   [ Installation Guide | Update Guide | Troubleshooting | FAQ | All Products ] Easy to use Customizable colors and sizes It implements breakout signals It implements alerts of all kinds Optimal Usage To see pennants of all sizes, which can overlap, load the indicator several ti
The   ICT Unicorn Model   indicator highlights the presence of "unicorn" patterns on the user's chart which is derived from the lectures of   "The Inner Circle Trader" (ICT) . Detected patterns are followed by targets with a distance controlled by the user.   USAGE (image 2) At its core, the ICT Unicorn Model relies on two popular concepts, Fair Value Gaps and Breaker Blocks. This combination highlights a future area of support/resistance. A   Bullish Unicorn Pattern   consists ou
Indicator plots price cycle blocks and sends signals with smart volume confirmation. Price cycles and fractals are combined to determine the demand/supply blocks. The indicator can be used alone or combined with other Cycle Indicators Inputs: Period: Recommended value is between 35 and 55( Which are Set 1 and Set 2 periods of cycle sniper ) Engulfing: If true, you will be able to see the engulfing bar confirmation. Volume Filter: True (The  arrow comes with volume confirmation ) Videos with dif
Les acheteurs de ce produit ont également acheté
Atomic Analyst
Issam Kassas
5 (1)
Tout d'abord, il convient de souligner que cet indicateur de trading n'est ni repainting, ni redrawing et ne présente aucun délai, ce qui le rend idéal à la fois pour le trading manuel et automatisé. L'Analyste Atomique est un indicateur d'action sur les prix PA qui utilise la force et le momentum du prix pour trouver un meilleur avantage sur le marché. Équipé de filtres avancés qui aident à éliminer les bruits et les faux signaux, et à augmenter le potentiel de trading. En utilisant plusieur
TPSproTREND PrO
Roman Podpora
5 (15)
TPSpro TRENDPRO  - is a trend indicator that automatically analyzes the market and provides information about the trend and each of its changes, as well as giving signals for entering trades without redrawing! The indicator uses each candle, analyzing them separately. referring to different impulses - up or down impulse. Exact entry points into transactions for currencies, crypto, metals, stocks, indices!  -  Version MT5               DETAILED DESCRIPTION        /       TRADING SETUPS           
Présentation       Quantum Trend Sniper Indicator   , l'indicateur révolutionnaire MQL5 qui transforme la façon dont vous identifiez et négociez les inversions de tendance ! Développé par une équipe de traders expérimentés avec une expérience commerciale de plus de 13 ans,       Indicateur Quantum Trend Sniper       est conçu pour propulser votre parcours de trading vers de nouveaux sommets grâce à sa manière innovante d'identifier les inversions de tendance avec une précision extrêmement élevée
TPSpro RFI Levels
Roman Podpora
5 (13)
A key element in trading is zones or levels from which decisions to buy or sell a trading instrument are made. Despite attempts by major players to conceal their presence in the market, they inevitably leave traces. Our task was to learn how to identify these traces and interpret them correctly. Reversal First Impulse levels (RFI)   -  Version MT5                INSTRUCTIONS                 RUS                 ENG                                       R ecommended to use with an indicator   -  
ACTUELLEMENT 26% DE RÉDUCTION La meilleure solution pour tout débutant ou trader expert ! Cet indicateur est un outil de trading unique, de haute qualité et abordable car nous avons incorporé un certain nombre de caractéristiques exclusives et une nouvelle formule. Avec seulement UN graphique, vous pouvez lire la force de la devise pour 28 paires Forex ! Imaginez comment votre trading va s'améliorer parce que vous êtes capable de repérer le point de déclenchement exact d'une nouvelle tendan
Actuellement 20% de réduction ! La meilleure solution pour tout débutant ou trader expert ! Ce logiciel de tableau de bord fonctionne sur 28 paires de devises. Il est basé sur 2 de nos principaux indicateurs (Advanced Currency Strength 28 et Advanced Currency Impulse). Il donne un excellent aperçu de l'ensemble du marché Forex. Il montre les valeurs de l'Advanced Currency Strength, la vitesse de mouvement des devises et les signaux pour 28 paires de devises dans tous les (9) délais. Imagine
Entry Points Pro
Yury Orlov
4.7 (224)
Indicateur supérieur pour MT4 fournissant des signaux précis pour entrer dans un trade sans repeindre ! Il peut être appliqué à tous les actifs financiers : forex, cryptocurrencies, métaux, actions, indices.  La version MT5 est ici Il fournira des signaux de trading assez précis et vous dira quand il est préférable d'ouvrir un trade et de le fermer. Regardez la vidéo (6:22) avec un exemple de traitement d'un seul signal qui a rapporté à l'indicateur ! La plupart des traders améliorent l
Advanced Supply Demand
Bernhard Schweigert
4.92 (310)
CURRENTLY 26% OFF !! Best Solution for any Newbie or Expert Trader! This indicator is a unique, high quality and affordable trading tool because we have incorporated a number of proprietary features and a new formula. With this update, you will be able to show double timeframe zones. You will not only be able to show a higher TF but to show both, the chart TF, PLUS the higher TF: SHOWING NESTED ZONES. All Supply Demand traders will love it. :) Important Information Revealed Maximize the potenti
XQ Indicator MetaTrader 4
Marzena Maria Szmit
3 (2)
Step into the realm of Forex trading with confidence and precision using XQ, a cutting-edge Forex indicator designed to elevate your trading game to unprecedented heights. Whether you're a seasoned trader or just stepping into the world of currency exchange,   XQ Forex Indicator   empowers you with the insights and signals needed to make informed trading decisions. The signal conditions are a combination of three indicators, and XQ Forex Indicator only display  medium and long-term trends . The
TrendMaestro
Stefano Frisetti
5 (2)
note: this indicator is for METATRADER4, if you want the version for METATRADER5 this is the link: TRENDMAESTRO recognizes a new TREND in the bud, he never makes mistakes. The certainty of identifying a new TREND is priceless. DESCRIPTION TRENDMAESTRO identifies a new TREND in the bud, this indicator examines the volatility, volumes and momentum to identify the moment in which there is an explosion of one or more of these data and therefore the moment in which prices have strong probability of f
Présentation de l'indicateur miraculeux Forex : Libérez la puissance du trading précis En avez-vous assez de chercher le meilleur indicateur Forex qui fournisse réellement des résultats exceptionnels sur tous les délais ? Ne cherchez plus ! L'indicateur miraculeux Forex est là pour révolutionner votre expérience de trading et propulser vos gains vers de nouveaux sommets. Basé sur une technologie de pointe et des années de développement minutieux, l'indicateur miraculeux Forex se positionne comme
FX Power MT4 NG
Daniel Stein
5 (8)
Obtenez votre mise à jour quotidienne du marché avec des détails et des captures d'écran via notre Morning Briefing ici sur mql5 et sur Telegram ! FX Power MT4 NG est la nouvelle génération de notre très populaire indicateur de force des devises, FX Power. Et qu'est-ce que ce compteur de force de nouvelle génération offre ? Tout ce que vous avez aimé de l'original FX Power PLUS Analyse de la force de l'OR/XAU Des résultats de calcul encore plus précis Périodes d'analyse configurables individuel
Quantum Breakout Indicator PRO
Bogdan Ion Puscasu
4.96 (26)
Présentation       Quantum Breakout PRO   , l'indicateur révolutionnaire MQL5 qui transforme la façon dont vous négociez les zones d'évasion ! Développé par une équipe de traders expérimentés avec une expérience de trading de plus de 13 ans,   Quantum Breakout PRO   est conçu pour propulser votre parcours de trading vers de nouveaux sommets grâce à sa stratégie de zone de discussion innovante et dynamique. Quantum Breakout Indicator vous donnera des flèches de signalisation sur les zones d
TakePropips Donchian Trend Pro
Eric John Pajarillaga Aldana
4.82 (17)
TakePropips Donchian Trend Pro   (MT4) est un outil puissant et efficace qui détecte automatiquement la direction de la tendance à l'aide du canal Donchian et vous fournit des signaux de trading d'entrée et de sortie ! Cet indicateur multifonction comprend un scanner de tendance, des signaux de trading, un panneau statistique, un filtre, des sessions de trading et un tableau de bord de l'historique des alertes. Il est conçu pour vous fournir des signaux de trading et vous faire gagner des heures
Scalper Inside PRO
Alexey Minkov
4.75 (55)
SALE NOW! Limited Time Offer! An exclusive indicator that utilizes an innovative algorithm to swiftly and accurately determine the market trend. The indicator automatically calculates opening, closing, and profit levels, providing detailed trading statistics. With these features, you can choose the most appropriate trading instrument for the current market conditions. Additionally, you can easily integrate your own arrow indicators into Scalper Inside Pro to quickly evaluate their statistics and
FX Volume
Daniel Stein
4.6 (35)
Obtenez votre mise à jour quotidienne du marché avec des détails et des captures d'écran via notre Morning Briefing ici sur mql5 et sur Telegram ! FX Volume est le PREMIER et SEUL indicateur de volume qui fournit un VRAI aperçu du sentiment du marché du point de vue d'un courtier. Il fournit des informations impressionnantes sur la façon dont les acteurs institutionnels du marché, comme les courtiers, sont positionnés sur le marché des changes, bien plus rapidement que les rapports COT. Voir c
Cycle Sniper
Elmira Memish
4.41 (34)
NEW YEAR SALE PRICE FOR LIMITED TIME!!! Please contact us after your purchase and we will send you the complimentary indicators to complete the system Cycle Sniper is not a holy grail but when you use it in a system which is explained in the videos, you will feel the difference. If you are not willing to focus on the charts designed with Cycle Sniper and other free tools we provide, we recommend not buying this indicator. We recommend watching the videos about the indiactor and system before pu
Shepherd Harmonic Pattern
Abdullah Alrai
4.68 (59)
Cet indicateur détectera des motifs harmoniques dessinés sur le graphique par des méthodes manuelles et automatiques. Vous pouvez consulter le manuel d'utilisateur à partir de ce lien: Ajoutez votre avis et contactez-nous pour l'obtenir. Il existe une version gratuite pour essayer ce produit sur MT4. Vous pouvez l'utiliser pour détecter les motifs Gartley et Nenstar: https://www.mql5.com/en/market/product/30181 Vous pouvez acheter la version complète de MT4 à partir de: https://www.mql5.com/en/m
Tout d'abord, il convient de souligner que ce système de trading est un indicateur non repainting, non redrawing et non lagging, ce qui le rend idéal pour le trading professionnel. Le "Système de Trading de Support et Résistance Intelligent" est un indicateur avancé conçu pour les traders novices et expérimentés. Il permet aux traders de bénéficier de précision et de confiance sur le marché du forex. Ce système complet combine plus de 7 stratégies, 10 indicateurs et diverses approches de trad
RelicusRoad Pro
Relicus LLC
4.78 (139)
Maintenant 147 $ (augmentant à 499 $ après quelques mises à jour) - Comptes illimités (PCS ou Mac) Manuel d'utilisation RelicusRoad + Vidéos de formation + Accès au groupe Discord privé + Statut VIP UNE NOUVELLE FAÇON DE REGARDER LE MARCHÉ RelicusRoad est l'indicateur de trading le plus puissant au monde pour le forex, les contrats à terme, les crypto-monnaies, les actions et les indices, offrant aux traders toutes les informations et tous les outils dont ils ont besoin pour rester renta
Présentation de l'indicateur Zeus : Votre outil ultime pour percer dans les bénéfices en trading. Cet indicateur simplifie le trading en éliminant la nécessité d'une analyse approfondie avec des stratégies de breakout. Il dessine automatiquement des zones en fonction de vos intervalles de temps prédéfinis, suggère des niveaux de Stop Loss (SL), Take Profit (TP) et Trailing Stop. L'indicateur Zeus vous avertira rapidement et affichera des flèches de signal lorsque le prix atteindra les points d'e
ACTUELLEMENT 31% DE RÉDUCTION ! ! La meilleure solution pour tout débutant ou Expert Trader ! Cet indicateur est un outil de trading unique, de haute qualité et abordable car nous avons incorporé un certain nombre de caractéristiques exclusives et une formule secrète. Avec seulement UN graphique, il donne des alertes pour les 28 paires de devises. Imaginez comment votre trading s'améliorera parce que vous serez capable de repérer le point de déclenchement exact d'une nouvelle tendance ou d'
Nous vous présentons ON Trade Waves Patterns Harmonic Elliot Wolfe, un indicateur avancé conçu pour détecter divers types de schémas sur le marché à l'aide de méthodes manuelles et automatiques. Voici comment il fonctionne : Schémas Harmoniques : Cet indicateur peut identifier les schémas harmoniques qui apparaissent sur votre graphique. Ces schémas sont essentiels pour les traders qui pratiquent la théorie du trading harmonique, telle qu'elle est décrite dans le livre de Scott Carney "Harmonic
Up down v6T
Guner Koca
5 (1)
Thise indicator is up down v6  comes with tradingwiev version. purchased people, after installed on terminal ,contact me on mql5  to get BONUS  TradingView version. up-down indicator is no repaint and works all pairs and lower than weekly time frames charts. it is suitable also 1 m charts for all pairs. and hold long way to signal. dont gives too many signals. when red histogram cross trigger line that is up signal.and price probably will down when blue histogram cross trigger line that is dow
Currency Strength Exotics
Bernhard Schweigert
4.88 (33)
ACTUELLEMENT 20% DE RÉDUCTION ! La meilleure solution pour tout débutant ou trader expert ! Cet indicateur est spécialisé pour montrer la force de la devise pour tous les symboles comme les paires exotiques, les matières premières, les indices ou les contrats à terme. C'est le premier de son genre, n'importe quel symbole peut être ajouté à la 9ème ligne pour montrer la force réelle de la devise de l'or, l'argent, le pétrole, DAX, US30, MXN, TRY, CNH etc. Il s'agit d'un outil de trading uniq
Quantum Heiken Ashi PRO MT4
Bogdan Ion Puscasu
4.43 (7)
Présentation de la       Cartes   Quantum Heiken Ashi PRO Conçues pour fournir des informations claires sur les tendances du marché, les bougies Heiken Ashi sont réputées pour leur capacité à filtrer le bruit et à éliminer les faux signaux. Dites adieu aux fluctuations de prix déroutantes et bonjour à une représentation graphique plus fluide et plus fiable. Ce qui rend le Quantum Heiken Ashi PRO vraiment unique, c'est sa formule innovante, qui transforme les données traditionnelles des chandelie
Th3Eng PipFinite PRO Indicator This product is distinct from the Th3Eng PipFinite Original, utilizing a different logic and algorithms. The Th3Eng PipFinite Pro indicator offers analysis of trend directions using custom algorithms. It provides indications of trend direction, entry points, a stop loss point, and three take profit points. The indicator also displays pivot points, dynamic support and resistance channels, and a side-box with detailed current signal information. How to Trade with
This Indicator does not repaint itself at all, it's identifies a new TREND in the bud, this indicator examines the volatility, volumes and momentum to identify the moment in which there is an explosion of one or more of these data and therefore the moment in which prices have strong probability of following a new TREND. CandleBarColorate never misses a beat, he always identifies a new TREND in the bud without error. This indicator facilitates the reading of charts on METATRADER; on a single wi
CONGESTION BREAKOUT PRO This indicator scans the breakout of congestion zones . This indicator unlike any other congestion indicator you will find in the market right now,  it uses an advanced algorithm not peculiar to most traditional congestion indicators available today . The advanced algorithm used to define the congestions  is greatly responsible for the high rate real congestion zones and low rate fake congestion zones spotted by this product. UNDERSTANDING CONGESTION Congestion are
Ultimate Sniper Dashboard
Hispraise Chinedum Abraham
4.84 (25)
Prix réduit à 299 $ ! Les prix peuvent augmenter à l'avenir ! Lisez la description ci-dessous ! Meilleur système d'entrée pour le tableau de bord Ultimate Sniper : NIVEAUX DYNAMIQUES ULTIMES. (Veuillez consulter mes produits) L'Ultimate Sniper Dashboard fonctionne UNIQUEMENT sur les marchés en direct en raison des limites des tests multidevises de MT4. Voici l'Ultimate-Sniper Dashboard ! Notre meilleur produit qui contient à la fois HA-Sniper, MA-Sniper et de nombreux modes spéciaux. L'
Plus de l'auteur
Scalper Assistant MT5
Pavel Verveyko
3.67 (3)
The indicator is a trading system for short-term trading. Scalper Assistant helps to determine the direction of the transaction, and also shows the entry and exit points. The indicator draws two lines (possible points for opening positions). At the moment of the breakdown of the upper line up (and when all trading conditions are met), an up arrow appears (a buy signal), as well as 2 goals. At the moment of the breakdown of the lower line down (and when all trading conditions are met), a do
The indicator displays the key support and resistance levels on the chart. The significance of these levels lies in that the price may reverse or strengthen the movement when passing such levels, since they are formed as a consequence of the natural reaction of market participants to the price movement, depending on which positions they occupied or did not have time to occupy. The psychology of the level occurrence: there always those who bought, sold, hesitated to enter or exited early. If the
Trend Sync
Pavel Verveyko
5 (2)
The indicator shows the trend of 3 timeframes: higher timeframe; medium timeframe; smaller (current) timeframe, where the indicator is running. The indicator should be launched on a chart with a timeframe smaller than the higher and medium ones. The idea is to use the trend strength when opening positions. Combination of 3 timeframes (smaller, medium, higher) allows the trend to be followed at all levels of the instrument. The higher timeframes are used for calculations. Therefore, sudden change
Turn
Pavel Verveyko
The indicator shows the market turning points (entry points). Reversals allow you to track rebound/breakout/testing from the reverse side of the lines of graphical analysis or indicators. Reversals can be an independent signal. The indicator allows you to determine reversals taking into account the trend and without it. You can choose a different period for the movement preceding the reversal, as well as the volatility coefficient. When plotting reversals, the indicator takes into account vola
Length Movement
Pavel Verveyko
5 (2)
Measures the length of the selected movement in points, shows the duration of the movement, as well as the speed of movement.   Outputs the average value of each dimension. It is designed to calculate the expected target based on typical market movements. The intended goal will provide information about the ratio of the stop size to the possible profit and will allow you not to open positions with a small expected profit. It will also help you determine the point at which it is more logical t
The indicator allows you to quickly switch from one instrument to another, from one time period to another using the keyboard or buttons on the monitor. Each command can be assigned a hot key from 0-9, a-Z (case-insensitive) and VK_OEM_COMMA ("<" on the keyboard) and VK_OEM_PERIOD (">" on the keyboard). This can help you to operate the maximum number of instruments that are available at your broker, analyze more instruments/periods in less time. This product cannot be tested in the tester , beca
Ratio TP SL
Pavel Verveyko
5 (1)
This indicator allows you to measure the profitability of each specific transaction (the ratio of Stop and Profit). The indicator allows you to adjust the ratio by step size and number of steps. You can build an unlimited number of ratios to compare the risks from different movements. Note: in MT4, the number of horizontal lines in a single ratio cannot exceed 32. Building a line : click the " Ratio " button and draw a line (mouse click - the first point of the line, where the mouse is relea
Corporate Report
Pavel Verveyko
5 (1)
The script displays info about the share's corporate reports and dividends. The data is downloaded from   investing.com : Report date Profit per share (EPS) Revenue Market capitalization Amount of dividends Date of payment of dividends Dividend income The product cannot be tested in the tester (since it is not possible to receive data from the Internet). Before launching:  Add 2   URL   https://ru.investing.com/earnings-calendar/Service/getCalendarFilteredData  and   https://ru.investing.com/
Channel FTF
Pavel Verveyko
5 (2)
The Envelopes indicator determines the presence of a trend or flat. It has 3 types of signals, shows the probable retracement levels and levels of the possible targets. The Fibonacci coefficients are used in the indicator's calculations. Signals (generated when touching the lines or rebounding from lines): Trend - the middle line of the Envelopes has a distinct inclination; the lines below the channel's middle line are used for buy trades, the lines above the middle line and the middle line itse
Mr Big
Pavel Verveyko
The indicator shows and highlights the chart candles, which are formed as a result of large players entering the market in large volumes. Such candles can also be formed after achieving a certainty on the market, when most of the participants hold positions in the same direction. The movement is likely to continue in that direction after such candles. The indicator highlights the significant candles from the existing ones on the chart; The indicator allows identifying the trends based on candles
Splash
Pavel Verveyko
The indicator identifies the most suitable moment for entering the market in terms of market volatility, when the market has the strength to move (the signal is indicated by an arrow under the candle). For each of the signals, the presence of trends on the current and higher timeframes is determined, so that the signal is in the direction of the majority of positions opened on the market (denoted near the signal by abbreviations of timeframes with a trend present). The signal appears after the c
The indicator displays the key support and resistance levels on the chart. The significance of these levels lies in that the price may reverse or strengthen the movement when passing such levels, since they are formed as a consequence of the natural reaction of market participants to the price movement, depending on which positions they occupied or did not have time to occupy. The psychology of the level occurrence: there always those who bought, sold, hesitated to enter or exited early. If the
This indicator is a multitimeframe trading strategy. It has the levels for stop loss, take profit and entry point. The order level can also be set manually. The indicator uses the regularity of the market, which manifests itself on all instruments, and does not require adjustment of the parameters. The strategy uses a proprietary approach to determining: trend, volatility, hierarchy of timeframe significance, the size of the history period (the number of candles), which is important for making a
Running along Lines
Pavel Verveyko
3.67 (3)
The indicator draws support and resistance lines on an important part of the chart for making decisions. After the trend line appears, you can trade for a breakout or rebound from it, as well as place orders near it. Outdated trend lines are deleted automatically. Thus, we always deal with the most up-to-date lines. The indicator is not redrawn . Settings: Size_History  - the size of the calculated history. Num_Candles_extremum  - the number of candles on each side of the extremum. Type_Ar
Key Volumes
Pavel Verveyko
1 (1)
The indicator shows key volumes confirmed by the price movement. The indicator allows you to analyze volumes in the direction, frequency of occurrence, and their value. There are 2 modes of operation: taking into account the trend and not taking into account the trend (if the parameter Period_Trend = 0, then the trend is not taken into account; if the parameter Period_Trend is greater than zero, then the trend is taken into account in volumes). The indicator does not redraw . Settings Histo
This trading system is based on market impulses of varying complexity.   To generate a signal, the indicator uses the moments when the direction of the pulse and the necessary section of the trend coincide. The indicator also takes into account the current market volatility. Stop_loss tags can be set with the parameter "0" or "1", then Stop_Loss will take into account market volatility.   Take_Profit tags can be set with the parameter "0", then Take_Profit will take into account market volat
Indexes
Pavel Verveyko
The stocks that make up the index are one of the drivers of the movement. Analyzing the financial performance of all elements of the index, we can assume further development of the situation. The program (script) displays corporate reports of shares that are part of the index selected in the settings.   "Indexes" cannot be tested in the tester (since there is no way to get information from the Internet). Information is downloaded from the site investing.com: Report Date Earnings per share
Fibo World
Pavel Verveyko
The indicator builds a graphical analysis based on the Fibonacci theory. Fibo Fan is used for the analysis of the impulses and corrections of the movement. Reversal lines (2 lines at the base of the Fibonacci fan) are used to analyze the direction of movements. The indicator displays the of 4 the target line in each direction. The indicator takes into account market volatility. If the price is above the reversal lines, it makes sense to consider buying, if lower, then selling. You can op
The indicator determines the state of the market: trend or flat. The state of the market is determined by taking into account volatility. The flat (trading corridor)is displayed in yellow. The green color shows the upward trend. The red color shows the downward trend. The height of the label corresponds to the volatility in the market. The indicator does not redraw . Settings History_Size   - the amount of history for calculation. Period_Candles  - the number of candles to calculate the
The indicator plots flexible support and resistance levels (dots). A special phase of movement is used for construction. Levels are formed dynamically, that is, each new candle can continue the level or complete it. The level can provide resistance or support to the price even where it is no longer there. Also, support and resistance levels can change roles. The importance of levels is affected by: the amount of time the level is formed and the number of touches. The significance of these l
The indicator is a trading system for short-term trading. Scalper Assistant helps to determine the direction of the transaction, and also shows the entry and exit points. The indicator draws two lines (possible points for opening positions). At the moment of the breakdown of the upper line up (and when all trading conditions are met), an up arrow appears (a buy signal), as well as 2 goals. At the moment of the breakdown of the lower line down (and when all trading conditions are met), a do
Gold n XAU
Pavel Verveyko
The trading system is designed to work with gold on time periods: 30M, 1H. The indicator allows you to adjust to the market situation. Parameters for 1H :   PERIOD=9F ,   FILTER=300 .   Parameters for  30M :   PERIOD=22B ,   FILTER=450 .   A small adjustment to a specific broker is allowed .   If you change the amount of history displayed, you may also need to adjust the parameters. The indicator is not redrawn.     "Gold n XAU" uses different rules for entering a trade and different ru
The indicator determines the most important component of any trading system - the possible exit point from the transaction. As the price moves, depending on the market situation, the indicator builds goals. The target becomes relevant when the price starts moving towards the target. If the movement is strong, then it may take a certain number of targets to stop or reverse price. The accumulation of targets is most likely able to stop the price. Some goals are executed several times. But the
The indicator builds "psychological levels": levels of round numbers and intermediate levels of round numbers. Round numbers play an important role in forming support and resistance levels. There is a pattern in which the decline or growth of the price can stop at round numbers. The level whose price ends at 0 is the level of a round number of the first order. Intermediate level, this is the level between two round levels, for example, between 10 and 20 this is level 15. In the " Num_Zero
Ichimoku Map (instant look at the markets) - built on the basis of the legendary Ichimoku Kinko Hyo indicator. The task of the Ichimoku Map is to provide information about the market strength on the selected time periods and instruments, from the point of view of the Ichimoku indicator. The indicator displays 7 degrees of buy signal strength and 7 degrees of sell signal strength. The stronger the trend, the brighter the signal rectangle in the table. The table can be dragged with the mouse. T
The indicator displays a stock chart of a non-standard type, in which the price and time have the same value. The usual chart of Japanese candlesticks does not take into account all the information that the time analysis can give. Renko charts do not use all the information that price can give in relation to time. The "Chart Price and Time" indicator takes into account price and time equally and shows the predominance of price or time. Taking into account price and time equally gives an i
The indicator tracks sharp volatility (moments when the market has shown increased activity and movement may occur), on the selected instruments and time periods. The information is displayed as colored rectangles. Thus, it is possible to assess at a glance which tool should be given priority attention. The indicator will be useful for scalpers when they need a quick reaction or for traders working with a large number of instruments. The indicator does not redraw. The indicator displays 8 degr
This program is designed to test ideas and acquire analytical skills. The main task of the analyst is to be able to predict the direction and range on the chart, where the price should soon come. This product cannot be tested in the tester. All the functionality is shown in full in the description and screenshots. How it works : Situations for analysis are selected at random. (The more historical data, the greater the number of examples). Click " Start Game ". Between the orange vertical li
The Alert Creator indicator is designed to create alerts for selected conditions. You can select one or several indicators for the notification. If several conditions are selected, the alert is triggered when all the selected conditions are met. The signals can be configured separately for buying and separately for selling. Example, a buy alert: the closing price is above the moving average, the RSI is below 20. (In this example, 2 indicators are used to generate an alert: MA and RSI) At
The indicator determines the strength of the trend and its possible reversal points, based on the author's arithmetic approach . Each new peak or trough is a trend development. Such peaks and troughs are numbered so that the strength of the trend development can be seen. Attempts to change the trend are also numbered. This gives an understanding of a possible change in the direction of the trend. Indicator signals are generated when trying to change the trend . In the settings, it is possib
Filtrer:
mambobody
462
mambobody 2022.06.04 10:03 
 

L'utilisateur n'a laissé aucun commentaire sur la note

Répondre à l'avis
Version 1.5 2020.12.08
The Num_Candles_extremum parameter is divided into 2 parameters. Now you can select the number of candles to the left of the peak/trough and the number of candles to the right of the peak/trough separately.
Version 1.4 2020.11.27
Overall improvement.
Version 1.2 2020.09.06
Added settings:
sound alert.
send an email notification.
send a mobile notification.
standard terminal alert.
Version 1.1 2020.05.04
Added new types of arrows.