Bears Bulls Complex MT4
- Indikatoren
- Version: 4.7
- Aktualisiert: 23 Mai 2020
- Aktivierungen: 5

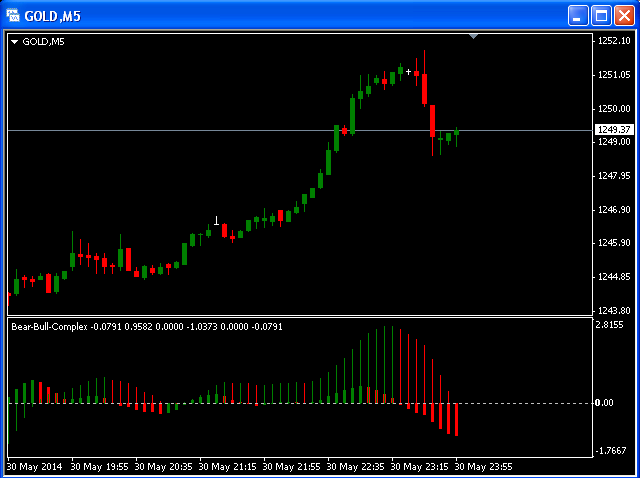
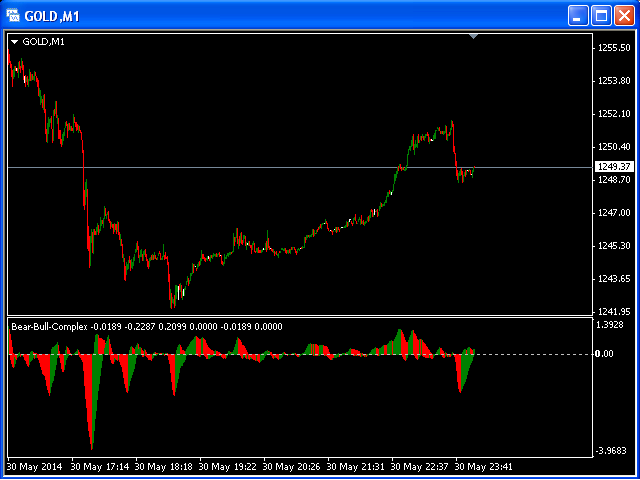
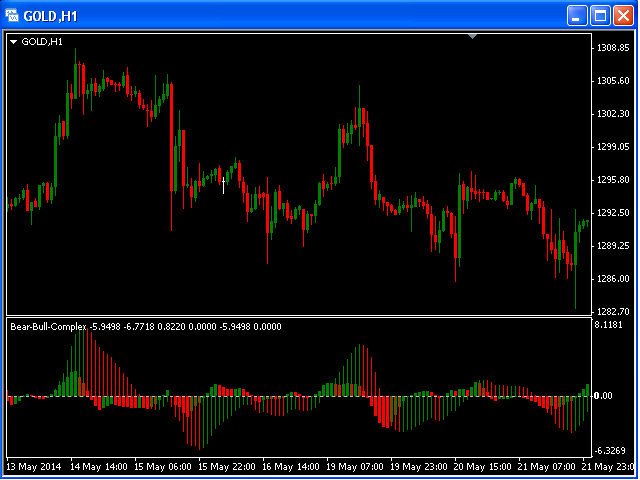
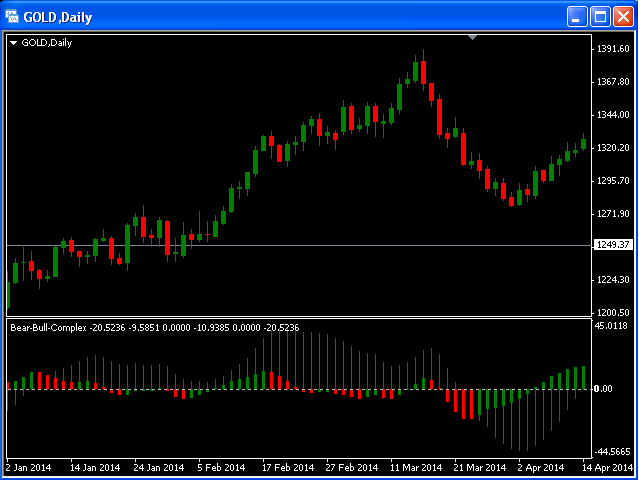
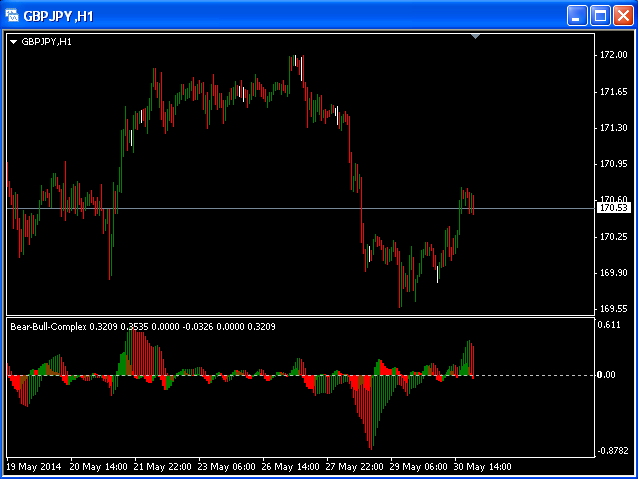
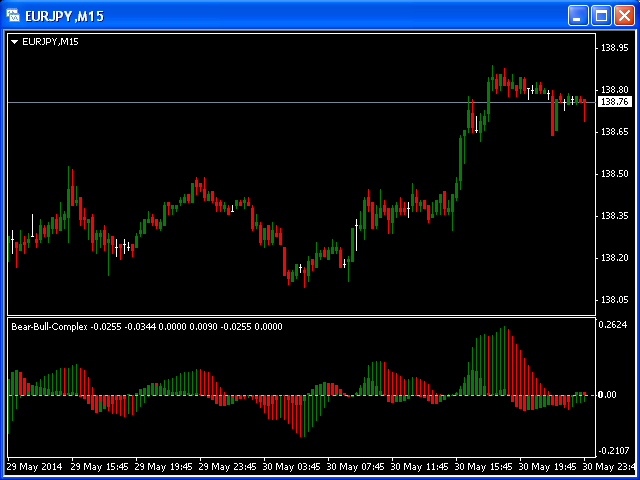
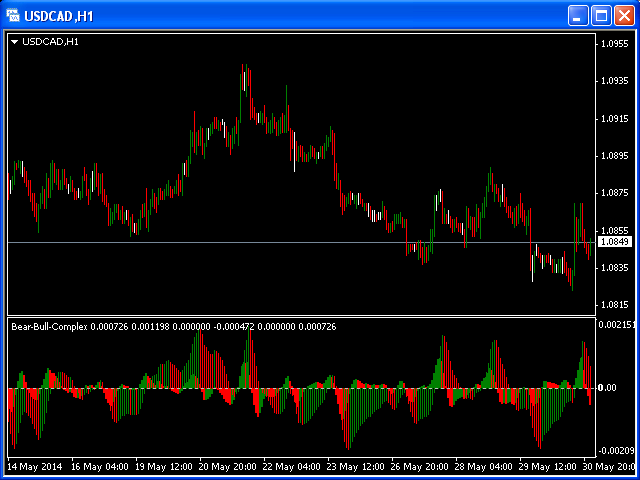
Die Bullen- und Bären-Power-Indikatoren zeigen an, ob die Käufer oder die Verkäufer auf dem Markt die Macht haben, und führen somit zu einem Kursausbruch in die jeweilige Richtung.
Der Bären-Power-Indikator versucht, den Appetit des Marktes auf niedrigere Preise zu messen.
Der Bulls-Power-Indikator versucht, den Appetit des Marktes auf höhere Preise zu messen.
Dieser Indikator ist besonders effektiv, wenn sich das schmale Histogramm und das breite Histogramm auf der gleichen Seite befinden (über oder unter der Nulllinie).